Developing a holistic understanding of service delivery and value
(co-) creation in order to improve value (co-)creation processes and
value propositions of service providers.
Author: Job (J.P) Leemreize
Supervisors:
(1
st) Dr. K. Zalewska-Kurek,
(2
nd) Dr. R.P.A. Loohuis, MBA
2
ABSTRACT
The goal of this research is to present a deeper understanding of value (co-) creation in service settings. We complement to the existing literature by presenting a newly-developed holistic understanding of value (co-) creation, based on an integration of the three existing models on value creation of Zeithaml, Parasuraman & Berry (1990), Grönroos (2011) and Lovelock & Gummesson (2004). This integration has resulted into a threefold of subsequent processes that are able to explain value (co-) creation in a holistic manner: (1) The service interaction process; (2) the co-creation process and; (3) the value-in-use facilitation process. In turn, a practical instrument was developed in order to give the holistic understanding practical applicability as well. The instrument consists of both quantitative as well as qualitative measurements resulting out of the mixed methods approach of this study. The measurements allow firms to assess value attribute importance and the gap between the customer’s perception and expectation through the three distinguished processes. This enables service providers to improve their (knowledge on) customer value creation and, subsequently, to improve their value propositions by doing so.
Job (J.P) Leemreize – Master thesis - Page 1
Index
1 Introduction ... 1
1.1 Introduction and problem statement ... 1
1.2 Research Question ... 2
2 Theoretical Framework ... 3
2.1 Customer Value explained ... 3
2.2 Value propositions in a service provider setting. ... 3
2.3 How delivering services is different from delivering goods: The IHIP Framework ... 4
2.4 Existing theories on value (co-)creation. ... 5
The SERVQUAL model of Zeithaml et al: Assessing the gap between service expectation and perception. ... 5
Grönroos’ service logic & value (co-)creation in the service setting ... 6
Lovelock & Gummesson’s critiques on the IHIP framework ... 9
2.5 Towards a holistic understanding on service delivery and value (co-) creation: integrating existing understandings. ... 10
3 Methodology ... 15
3.1 Research Design ... 15
3.2 Operationalization ... 15
The quantitative research instrument based on the holistic understanding. ... 15
Qualitative Research: Semi-structured interviews ... 17
3.3 Sampling ... 18
Quantitative research sample ... 18
Central Limit Theorem ... 18
Qualitative research sample ... 18
3.4 Data collection ... 19
3.5 Data analysis ... 20
Quantitative data analysis methods ... 20
Methods for testing the reliability of the developed quantitative research instrument ... 20
Qualitative data analysis methods ... 21
4 Results... 22
4.1 Quantitative research results ... 22
Adequacy of the sample ... 22
Reliability of the newly-developed research instrument ... 23
Assessing process and attribute importance ... 24
4.2 Value (co-)creation performance along the three processes: Gap analysis ... 26
4.3 Attributes for most effective value optimization. ... 33
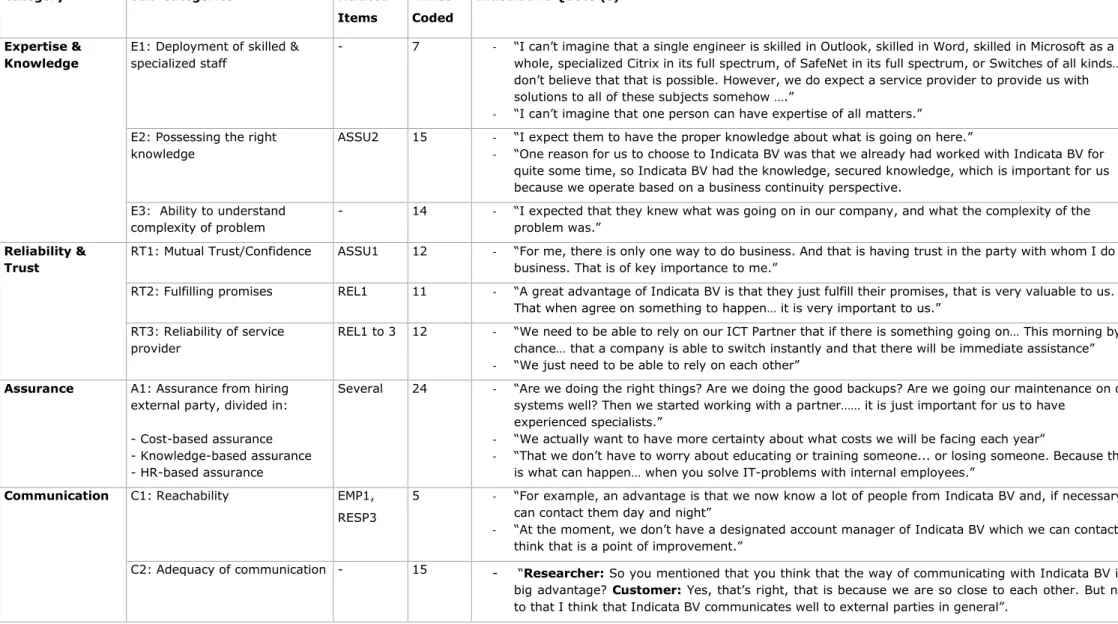
4.4 Qualitative research results ... 35
Qualitative results regarding the service interaction process ... 36
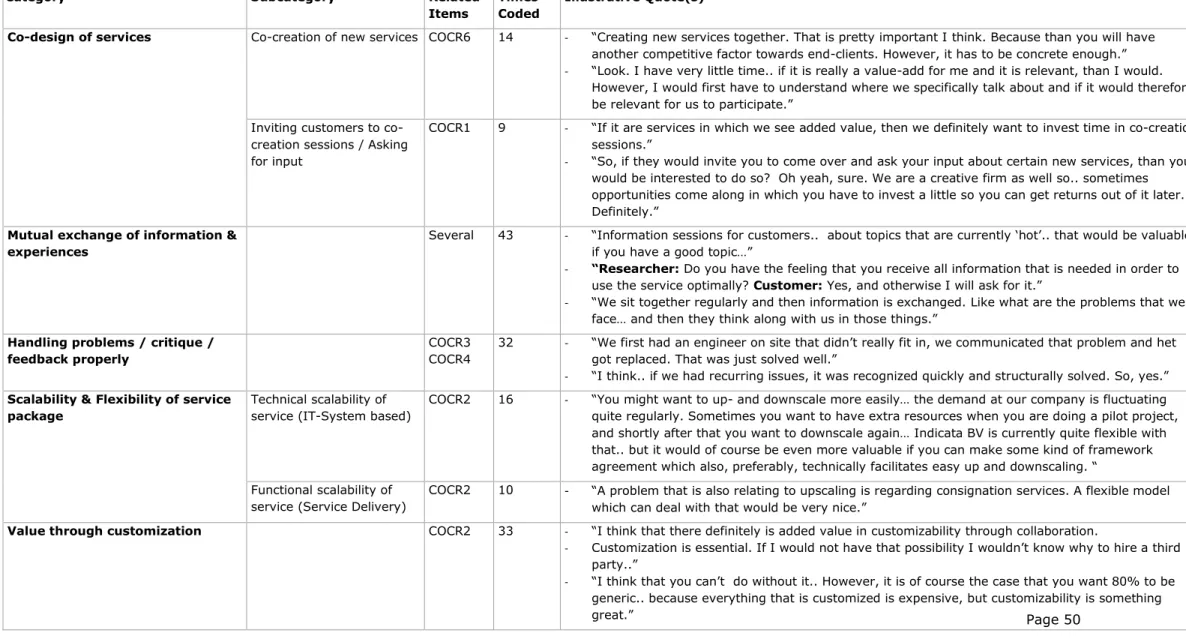
Qualitative results regarding the value co-creation process. ... 44
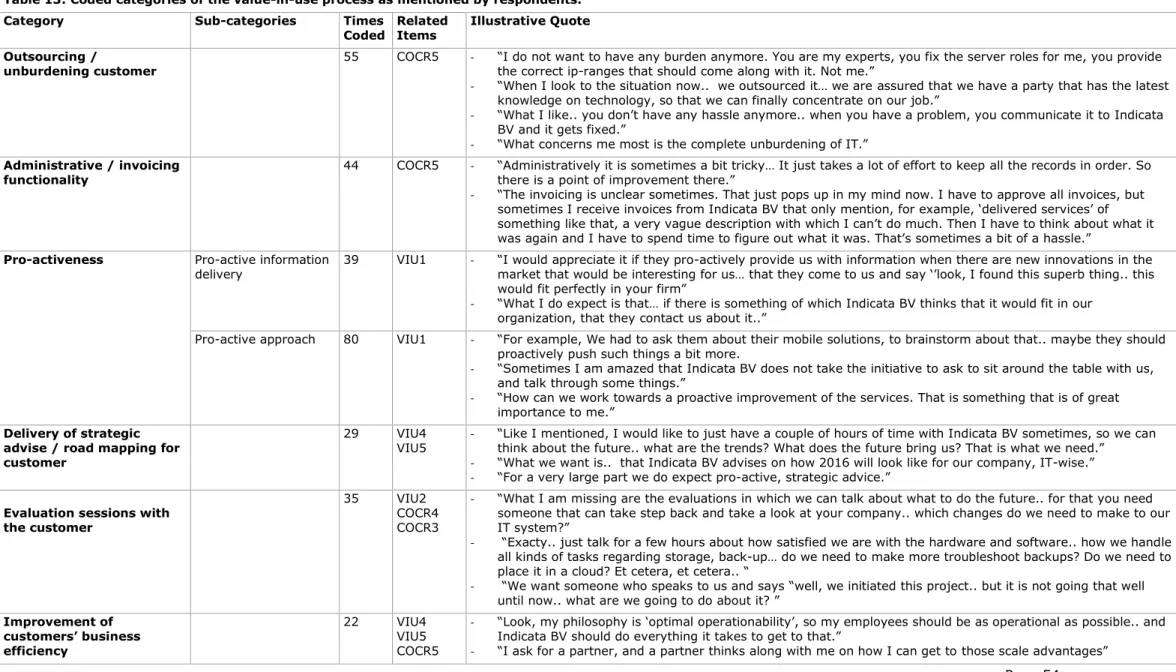
Qualitative results regarding the value-in-use facilitation process ... 51
General influencing factors regarding the service perception & potential additions to the service package. ... 55
Job (J.P) Leemreize – Master thesis - Page 2
6 Discussion & advice for future research ... 60
7 Recommendations ... 62
8 References ... 64
Page 1
1
Introduction
1.1
Introduction and problem statement
Since the 1980’s, service delivery, service quality and value creation have been relevant topics in marketing literature. Hence, a number of theories have been developed to shed light on this subject. Zeithaml (1990), Lovelock & Gummesson (2004) and Grönroos (2011) aimed to delve deeper into how value can be created through service delivery by creating models which aimed to conceptualize this phenomenon. In doing so, Zeithaml et al. (1990) developed the SERVQUAL model, analyzing the gap between the perceptions of service delivery and the expectations of service delivery in order to improve service quality and therewith enabling further value creation. Grönroos (2011) provided a renewed view on the service-dominant logic from Vargo & Lusch (2008) called the “service-logic” and thereby giving a deeper understanding of value (co-) creation and the firm’s and customer’s role in doing so. In addition, Lovelock & Gummesson (2004) scrutinzed the IHIP framework. With the IHIP framework, one initially tried to explain the difference between services and goods and their implications when delivering services through for characteristics: Intangibility, Heterogeneity, Inseparability and Perishability. Lovelock & Gummesson (2004, p. 20-21), however, show that services cannot be distinguished to be different from goods through these four characteristics as there are “sufficient exceptions to discredit the claim of universal generalizability”. It can be argued that these are the current views on services marketing that lie at the basis for explaining how value can be created and evaluated in a service setting. Nowadays, we live in a world in which the wide availability of communications technology is forcing companies to think differently in value creation by becoming more responsive to customer experiences and co-creation of value becomes more of a necessity (Prahalad & Ramaswamy, 2002). Hence, one of the purposes of this research is to use this existing knowledge about service delivery and value creation processes in order create an understanding of value proposition effectiveness through an overarching understanding of value creation. That is, value propositions as a “description of the experiences a target user will realize upon purchase and use of a product” (Chesbrough & Rosenbloom, 2002). Anderson, Narus & Van Rossum (2006) thereby state that in order to let a customer value proposition function more effectively, it should be based in the two or three elements which deliver the greatest value to the customer as well as it should be communicated in such a way that it is understandable to the customer (Edvardsson & Klaus, 2014). The models of Zeithaml (1990), Lovelock & Gummesson (2004) and Grönroos (2011) can thereby act as a fundament for understanding how greater value can be delivered to the customer through services, providing a basis which enable us to create more effective value propositions. (Edvardsson et al. 2014). Thereby, delivering superior value will help in getting a competitive advantage (Anderson, Narus & Van Rossum, 2006; Woodruff, 1997).
Page 2 this gap by presenting an integration of the three theories of Zeithaml et al. (1990), Lovelock & Gummesson (2004) and Grönroos (2011) by making them complementary to each other and therewith creating a holistic understanding of service delivery and value (co-)creation processes in the present time. This holistic integration of existing models resulted into a threefold of connected processes that explain the value creation process a whole: (1) the service interaction process, (2) the value co-creation process and (3) the value-in-use facilitation process.
Subsequently, we aim to provide a research instrument that is based on this holistic understanding (and these three processes), and which is able to provide solutions to practical problems regarding value delivery through services and improving value proposition effectiveness. Hence, our goal is also to create a research instrument to bring the holistic understanding in practice. In order do so, the instrument was tested on the case of Indicata BV, an IT Service Provider. The instrument was utilized in this company in order get an advice on how they could improve their customer value through optimization of the value delivery & value (co-) creation processes as well as how their value proposition could be improved based on these results. This provided us the opportunity to test the reliability of the developed instrument as well as the applicability of our holistic understanding in practice. Hence, we provide an example of how the holistic understanding can be used to gather insight on improving value at the firm level, giving this research both theoretical and practical relevance.
1.2
Research Question
In order to give an answer regarding the stated problem, the following research question has been set up:
How can customer value be created and delivered through a holistic understanding of service delivery & value (co-)creation processes in service settings and how can this help in improving customer value and value propositions of service providers?
In order answer the main research question; the following sub-questions have been set up:
- What is customer value in the context of the service setting?
- How can the existing theory on service delivery and value (co-)creation be combined in such a
complementary way so that it creates a holistic understanding?
- Which dimensions and/or processes of service delivery and value creation can be distinguished based
on this holistic understanding?
- How can this holistic understanding be shaped into a practical research instrument and be used to
create a practical understanding of value creation at the firm level?
- How can the usage of this practical instrument help the focal firm in understanding how they can
Page 3
2
Theoretical Framework
2.1
Customer Value explained
According to Woodruff (1997) customer value or customer-perceived value or perceived value (among many other similar concepts) is a concept that is used interchangeably throughout the literature. Broekhuizen (2006), for example, states that there are as much as eighteen concepts which are all used for explaining this same value which consumers derive from buying and using the product (Woodall, 2003 in Broekhuizen, 2006). Customer value can be further defined as “a customer's perceived preference for and evaluation of those product attributes, attribute performances, and consequences arising from use that facilitate (or block) in achieving the customer's goals and purposes in use situations.” (Woodruff, in Parasuraman, 1997, p. 154). Customer value can, simply put, be seen as “a trade-off between (customer-perceived) quality and (customer-perceived) price” (Desarbo, Jedidi & Sinha, 2001, p. 846; Lapierre; 2000; Slater, 1996). Some, however, state that it implies much more than a trade-off between product quality and price (Lapierre, 2000). The goal and use of assessing customer value is to get an “understanding what buyers value within a given offering, creating value for them, and then managing it over time” (Desarbo et al., 2001, p. 845). Desarbo et al. (2001) thereby state that assessing this is a key element of every market-oriented firm’s strategy. Slater & Narver (1994) state a business can be typified as market-oriented “when its culture is systematically and entirely committed to the continuous creation of customer value”. Determining what the customer values in a service helps a firm formulate a clear statement of its value proposition (Desarbo et al., 2001). It can be argued that an understanding of customer value and value creation is necessary in order to be able to build a value proposition that is attractive to a customer. A great number of authors thereby seem to agree on customer value as the basis for competitive advantage (Woodruff, 1997).
2.2
Value propositions in a service provider setting.
Page 4 that their offering might deliver to target customer” (Anderson et al., 2006). The common thought is the more benefits are given in an offering, the better the CVP is. Second, Anderson et al. (2006) describe the “favorable points of difference” (FPOD) type of CVP’s and is considered as preferable to an all benefits proposition. For this type of CVP, knowledge of the next best alternative offering is needed in addition to the knowledge about a company’s own market offering (Anderson et al, 2006). This view explicitly recognizes that there is also an alternative available for the customer. Subsequently, Anderson et al. (2006) distinguish the ‘Resonating Focus’ type of CVP. The resonating focus seen as the ‘Golden standard’ of CVP’s according to Anderson et al (2006) as well as Rintamäki et al. (2007). This approach to a CVP “acknowledges that the managers who make purchase decisions have major, ever-increasing levels of responsibility and often are pressed for time” (Anderson et al, 2006, p. 94). Thereby, Anderson et al. (2006) state that managers preferably want to do business with those companies “that fully grasp critical issues in their business” and with a CVP that is simple but also powerfully captivating. Anderson et al. (2006) state that this can be done by making the proposition superior on those few elements that matter the most to target customers and to document and demonstrate this superior performance. In addition, Edvardsson & Klaus (2014) suggest that experience strategies and value propositions connect through service systems. Service systems can be described as “configurations of resources and actors, designed and managed to support a firms experience strategy strategically by fostering value proposition” and is stated to be connected with profit and revenue through customer satisfaction and service quality (Edvardsson & Klaus, 2014, p.11). Edvardsson & Klaus (2014) state that service systems enable value propositions, based on creation of both customer service experiences as well as the value perceptions. In addition, Ng, Parry, Smith & Briscoe (2012) relate value-in-use with value propositions, which can be seen as similar to the view of Chesborough & Rosenbloom (2002). Value-in-use is hereby being described as the value that a customer receives from the service upon using it. Macdonald, Wilson, Martinez & Toossi (2011, p. 673) define value-in-use as “a customer’s outcome, purpose or objective that is achieved through service”. Ng et al. (2012) acknowledge a shift in value propositions from a manufactured offering to “an integrated product and service offering that delivers value-in-use” (Ng et al., 2012, p.4). Macdonald et al. (2011) also acknowledges this by stating that providers are currently challenged to assess the perceived value that ‘integrated solutions’ deliver. It is stated that these integrated solutions, which are interactively designed to solve complex individual problems, offer higher value to the customer in comparison to the value that sum of the separate underlying components would bring to the customer (MacDonald et al., 2011).
2.3
How delivering services is different from delivering goods:
The IHIP Framework
Page 5 characteristics that should explain the differences between services and good, leading to the implications of service delivery, can be distinguished: intangibility, heterogeneity, inseparability and perishability. The
intangibility of services makes it hard to assess and evaluate quality of the service. According to Bateson (1979) it is “the critical distinction goods-services distinction from which all other differences emerge” (Zeithaml et al., 1985, p. 33). Because services are “immaterial” performances, rather than “things”, they cannot be seen, sensed or be tested in the same manner in which goods can be sensed or tested (Zeithaml et al, 1985: Lovelock, 1991; Gadrey, 2000). Next to intangibility, the heterogeneous character of services also causes implications in assessing and evaluating the quality of the service delivery. Especially labor intensive services differ from customer to customer and can differ from day to day. One of the factors that help in explaining this heterogeneity in labor intensive services is the consistency of the employees in their task (Parasuraman et al., 1985). Third, it is proposed that services are
inseparable in the production and consumption. Whereas goods are produced first and sold afterwards, services are sold first and produced afterwards. (Zeithaml et al., 1985; Parasuraman et al., 1985). It can be argued that this leads to a difference in how a service is delivered (delivered over time) and how a product is delivered (instant exchange). The last characteristic, perishability, stems from the problem that services cannot be stored for later sales or use and therefore have an implication relating to the supply and demand of services. If the demand exceeds the supply, the demand cannot be met by taking it out of inventories and “cannot be held in stock” (Mudie & Pirrie, 2006; Gadrey, 2000, p. 370). These four combined characteristics are often named as the “IHIP” scheme(see Lovelock & Gummesson, 2004; Vargo & Lusch, 2004; Edvardsson, Gustafsson & Roos, 2005).
2.4
Existing theories on value (co-)creation.
The SERVQUAL model of Zeithaml et al: Assessing the gap between service
expectation and perception.
Understanding service quality will help in creating a model which “describes how the quality of services is perceived by customers” (Grönroos, 1984). Firms are constantly looking for goods and services which fulfill the needs of the high quality demanding market (Parasuraman, Zeithaml & Berry, 1985). Subsequently, the delivery of higher service quality can be deemed as a strategy which is “increasingly being offered as a key to service providers’ efforts to position themselves more effectively in the marketplace” (Cronin & Taylor, 1992). Hence, it can be stressed that service quality is a driver for value creation. Thereby it is important to keep in mind that service quality is perceived and reflected through the process of interaction with the customer. This interaction between customer and firm is what Grönroos (2011) calls the service encounter. Under the notion that the quality-price trade-off is the basis of customer value, increasing service quality will inevitably lead to higher customer value throughout the process. The interest in the construct of service quality and the question of how to measure it, is thus understandably high. (Cronin & Taylor, 1992).
Page 6
disconfirmation paradigm (Brady & Cronin, 2001). Spreng & Mackoy (1996, p.202) provide a similar definition as they emphasizes the idea that consumers “make a comparison between the performance of a product or a service and some standard”. After the fundamental articles of Parasuraman et al. (1985, 1988), Zeithaml, Parasuraman & Berry (1990) the authors initially ought to create a better understanding of service quality. Therefore, a service-quality model based on this understanding was developed, which was called the “Gaps Model” (see Appendix A) (Zeithaml & Bittner, 2010). In the second phase of their research they started to shift the focus of their research to the customer-side of their service-quality model. Based on the conclusions on their research on the customer-side of service quality, Parasuraman, Zeithaml & Berry (1988, 1990) developed a methodology which they called SERVQUAL. Zeithaml et al. (1990) concluded that the existing service quality literature was not sufficient for a good understanding of how customers evaluate the quality of a service and how assessing service quality can increase value.
Assessing the gap between expectation and perception
One of the main goals of the SERVQUAL model is to measure perceived service quality through the differences between the expectation and the perception of the customer. This is measured through “gap five” of the service quality model (Parasuraman et al. 1985: Zeithaml & Bittner, 2010). The gap between the expectation and perception of the customer is generally measured through a fivefold of dimensions (See appendix B). Based on our research goals, which are to explain the value creation process and find possibilities for improvement in these processes, we, hence, focus on Gap 5 of the SERVQUAL model. This is because we are mainly interested in finding opportunities for improvement based on the differences between expectation and performance along the service encounter. According to Parasuraman, Zeithaml & Berry (1994, p. 201), researchers generally agree that expectations serve as reference points in a customers’ assessment of service performance. Grönroos (2011) also agrees on this view of Zeithaml (1990) and acknowledges that there exists a difference in the value as expected by the customer and the value which is perceived by the customer. Hence, it is stressed that assessing the gap between perception and expectation is important for firms in order to know how to improve value along the value creation process. We argue that the gap five-analysis is definitely the strong characteristic of the SERVQUAL model as it provides a good insight for improving attributes that contribute to service quality or value delivery. Its importance brings us to include this gap five-assessment in our holistic understanding of value creation in a service setting.
Grönroos’ service logic & value (co-)creation in the service setting
Page 7 better-off in some respect (see Grönroos, 2008) or which increases the customer’s wellbeing (see Vargo & Lusch, 2008). Gronroos (2011) therefore defines value for customers as: “Value for customers means that after they have been assisted by a self-service process (cooking a meal or withdrawing cash from an ATM) or full-service process (eating out at a restaurant or withdrawing cash over the counter in a bank) they are or feel better off than before.” (Grönroos, 2011, p.282)
A deeper understanding of the value (co-)creation process
Page 8 does however make a difference in the way the value creation process takes place in a service setting. This difference lies in that when a good is transmitted “as a service”, it is a self-service process (Grönroos, 2011). A self-service process allows only the user of a resource to create the value from the service. Hence, goods which are provided without being embedded in a service process automatically trigger a self-service process. However, when there is interaction with the customer while providing the resources, it allows the firm to provide a user with more than only resources: Based on the encounter, the company is also able to provide additional assistance with the usage of this resource in order to create additional value. Grönroos (2011) as well as Vargo & Lusch (2004) state that, in order for a firm to provide a service (and thus value) for customer, it does also need a service back from the customer in the shape of input of information that is needed for the value creation process. This is what is called
reciprocal value creation. It describes the ongoing process of value creation, in which the supplier and customer are in a constant reciprocal process of obtaining reciprocal input and thereby creating value for both parties (Grönroos, 2011; Prahalad & Ramaswamy, 2004). Hence, Grönroos (2011) states that the goal of service systems (see Edvardsson & Klaus, 2004) is to provide value for both parties involved, and not for service systems on itself. For a service provider, this value often is a monetary value. For the customer it can be argued that this value is to become “better off” in some way, either financial or physical. Grönroos (2011) states, hence, that reciprocal value creation is the basis of all business. Because there exists an interaction process between the supplier and the user in these kinds of cases, a self-service process becomes a full-service process, which brings us to the topic of co-creation of value, and the role of the firm and the customer in doing so.
The firm and customer as co-creators of value through interaction processes.
As stated before, the interaction between supplier and user is what provides a platform for providing additional value and allowing suppliers to engage in value creation beyond merely providing resources. Due to interaction between the firm and its customer, the firm has the opportunity to help with the integration of the provided resources in such a way that it brings the most value to the customer. According to Grönroos (2011), this is also exactly the role of the firm regarding the (co)creation of value: firms facilitate customer’s value creation in order to create value-in-use for the customer. Hence, Grönroos (2011) formulates the basic role of a firm in its customer’s value creation as a “value facilitator”.
Figure 4:
Page 9 In figure 4 one can see that the interaction between the production and the customer is connected through an interaction platform. Resources used and integrated by a user that are provided by a producer. The value creation process does not work in just one direction. The supplier can also assist the customer by supporting him in the creation of value through usage of the resource - reciprocal value creation (Grönroos, 2011). Through the service encounters between supplier and user, both parties can have an influence on each other. The user can influence how the resources are produced (through i.e. co-design and co-creation of products), and the firm can influence how their provided resources are utilized in such a way that it generates as much value as possible for their customer. Value co-creation, hence, works in both ways and can therefore also be typified as “joint value creation” (Grönroos, 2011). Customers can be involved in value co-creation in various ways, such as through assisting in the design and development of the service system of the firm, achieved through feedback from complaints, suggestions, or contributions that are delivered through user interaction platforms (Edvardsson et al, 2014). Co-creation may thereby be compared with the notion of customization. There is however a difference between co-creation and customization on the basis of the degree of involvement of the customer. Generally spoken, customization requires less involvement of the customer than in co creation (Kristensonn, Matthing & Johansson, 2008). Co-creation generally requires a more active collaboration from the customer, starting as early as the beginning of the innovation process (Kristensonn et al., 2008). Subsequently, it is stressed that it is important that the staff of the supplier is trained in acting upon this co-creation process. Regarding increasing the quality of the encounters, Zeithaml et al.’s (1990) service quality model can act as a good basis to do so as Grönroos (2011, p. 290) thereby states that “the quality of the interactions between the parties is fundamental for value co-creation”. Zeithaml et al. (1990) provide this understanding of service quality and subsequently the service encounters in which a firm can engage itself with its customers’ practices.
Lovelock & Gummesson’s critiques on the IHIP framework
Page 10 ‘variability’ or ‘inconsistency’ instead. This is based on the fact that services do not have clear and consistent standards to which they can be evaluated and that, hence, the service delivery differs among employees as well as day by day (see IHIP framework, ch. 3.2). Lovelock & Gummesson (2004) however state that this is less of a problem nowadays. They state that because today’s service processes are highly standardized, many services are actually very consistent and can have clear evaluation standards. For example, when buying an airline ticket: One knows when the aircraft leaves, one knows which seat one gets, at what price and sometimes even from which gate or terminal their flight departs. Regarding the inseparability of services, Lovelock & Gummesson (2004) provide an important insight. Lovelock & Gummeson (2004) state that customer aren’t always desiring this role of ‘partial employee’, as Lovelock & Gummesson (2004) call it. Sometimes this lack of involvement (separability) even is intentional by the customer. IT-system maintenance, for example, is preferably done around office hours of the client, so that the customer doesn’t lose any time in doing its core-business. Based on these arguments it is also stressed that services are not generalizable unique from goods based on separability. Finally, there is the problem with perishability characteristic of services, which is two-fold. The first problem, that services can’t be stocked in an inventory, is refuted by Lovelock & Gummesson (2004). They argue that although one can agree upon that service cannot be stocked, it can also be seen as something positive: No stock also means no costs associated with handling this inventory. Subsequently, it is stated that certain service types can be inventoried, such as the news or music, which can be recorded for later use by transforming it to a physical good, such as a DVD. This is what makes these types of services storable and, hence, non-perishable. In conclusion, Lovelock & Gummeson (2004) state that the IHIP characteristics are not unique characteristics on which services are truly different from goods and are not generalizable to all services. Lovelock & Gummesson (2004, p. 31) claim this based on that there are “sufficient exceptions to discredit the claim of universal generalizability” (see Appendix D).
2.5
Towards a holistic understanding on service delivery and
value (co-) creation: integrating existing understandings.
As Lovelock & Gummesson (2004, p. 22) state, new theory or understandings can develop from new interpretations and “innovative combinations of extant theory”. In this research, we aim to do the latter. Now the separate underlying understandings have been thoroughly discussed in the previous chapters and the processes of value delivery, service quality and value (co-)creation are explained, we will integrate this knowledge into one holistic understanding.
Page 12 understanding by distinguishing them as a platform of interaction between customer and firm that is necessary for what Grönroos (2011) states to be the basis of all business: reciprocal value creation.
When falling back to the usefulness of the Service Quality model in the understanding of this reciprocal value creation, Grönroos (2011) states that the quality of the interactions between the parties - firm and customer – is fundamental for value co-creation. However, he does not thoroughly explain in his article how this quality can be assessed, improved or managed. Grönroos (2011) states that “the opportunities provided by the interaction platform can be taken care of well or less well”. However, he does not go into any more depth in understanding how a firm can work towards taking care of these opportunities in a good manner. It can be argued that this is where the thorough explanation of the Service Quality model of Zeithaml et al. (1990) is complementary to Grönroos’ (2011) understanding, as it provides extra depth in the interaction between firm and customer and value (co-)creation in a very useful way. It can, hence, be stressed that Grönroos’ (2011) understanding can add strength to our holistic understanding.
Next to placing the service encounter in the bigger scheme of value creation, Grönroos (2011) thoroughly explains the different perspectives regarding the value creation process, and more specifically, how the value co-creation process takes place and what the role of the firm vis-à-vis the customer is in this process. He states that, fundamentally, the customer is the one that creates the value and that the firm can only take the role as a value facilitator. Hence, it can be concluded that companies therefore cannot “dictate how value is created” (Prahalad & Ramaswamy, 2002, p. 4). MacDonald (2011) , Vargo & Lusch (2004) and Vandermerwe (1996), stress a similar view by stating that value is created in the customer sphere and that, hence, the customer is always a co-creator. During co-creation, the customer can co-create value-in-use, which is contradicting to the view that value is only embedded in the production or in “tangible goods at the factory gate” (MacDonald, 2011). Subsequently, Grönroos (2011) makes a key statement in saying that firms not always can or have to be a co-creator of value. He bases this on two arguments: (1) that the firm fundamentally is not the creator of value as “value is accumulated throughout the customer’s value creation process” and that value “is always determined by the customer” (Grönroos, 2011, p.294-295) and (2) that it depends on whether the firm is delivering goods ‘as a service’ - which is a self-service process and thus leaves the firm no option to influence the value upon usage of the provided resources – or if it engages in a full service process. Only the latter does give the firm the opportunity to influence the usage of the provided resources and, subsequently, can make a firm a co-creator of value-in-use for the customer. The basis for this co-creation collaboration between customer and firm are the experiences that a customer has gained when using a company’s product or service. (Vargo & Lusch, 2004; Kristensson et al. 2008).
Page 13 scrutinize the IHIP framework. This framework was initially set in place to provide the generalizable characteristics that would explain how all services, and there delivery, are uniquely different from goods. The assessment of Lovelock & Gummesson (2006) regarding the heterogeneity or “variability” characteristic sheds a new light on the usefulness of understanding service quality. Based on the old IHIP framework, the notion exists that services are inconsistent. However, it can be argued that due to the fact that some services are highly automated nowadays, this inconsistency is limited nowadays. It can also be argued that consistency of a service is linked to service quality. It is stressed that higher service quality would imply higher consistency and vice versa. This insight from Lovelock & Gummesson (2006) sheds another perspective on service quality as discussed in Zeithaml et al. (1990) based on the (in)consistent characteristic of services and its relation the quality of the service that is delivered. In turn, Johnston (1995) provides the evidence regarding this relation and states that consistency is indeed a determinant for service quality. Subsequently, consistency can, more or less, be measured through the reliability dimension of Zeithaml et al.’s (1990) SERVQUAL measurement as it measures the reliability and consistency of performance of service providers. When combining this knowledge, it can be argued that the (in)consistency of services, although it can be decreased by standardizing and automating services influences the service quality (Lovelock & Gummesson, 2004; Johnston, 1995). The assessment of this (in)consistency can be done with SERVQUAL and, hence, it enables companies to assess the service consistency and to manage it over time. Secondly, in Lovelock & Gummesons (2004) review of the IHIP schema, the understanding of Grönroos (2011) regarding value co-creation provides another important perspective: Customers don’t always want to be involved in the co-creation process. This is based on Lovelock & Gummesson’s (2004) claim that some services are actually separable. They state that customers sometimes even purposely separate consumption from the production and relate to the phenomenon of outsourcing. In the case of outsourcing the customer does not always want to be involved in the service delivery process by, for instance, deliberately scheduling maintenance at night when hardly anyone is around. Hence, it can be stated that although Grönroos (2011) states that although co-creation can be highly valuable for both firm and customer, firms have to keep in mind that customers do not always want to be involved in the production of the resources and are not always willing to engage in value creation as a co-creator. Subsequently, it can be stressed that the existence of an interaction platform will not inevitably lead to a successful value co-creation process on itself. In addition, it can therefore be argued that customers might also prefer customization above co-creation, as customization generally requires less involvement by the customer (Kristensonn et al. 2008).
Page 14 Based on the presented holistic understanding, resulting out of the three integrated existing understandings on value delivery and value creation, four concluding and summarizing premises can be made regarding the task and role of the firm in this value delivery and value creation process:
(1) Reciprocal value creation (or joint value creation) is the basis of all business (Grönroos, 2011). Thereby, greater value-in-use for the customer should be the desired outcome when improving the value delivery and value creation process. In exchange, the company should receive financial gains by doing so. (2) Firms can improve the creation of value-in-use by influencing and facilitating the customer’s usage of the
provided resources through the value co-creation process. This will enable firms to help customers in creating value beyond merely offering value propositions. However, the customer will always be the fundamental creator of value and the firm will just be a value facilitator (Grönroos, 2011). Thereby, both parties need to be in interaction with each other to be able to create joint value. This leads to the premise that;
(3) Value co-creation is only possible when there is a service encounter, which serves as the interaction platform between firm and customer. Assessing and improving the quality of the service encounter increases the opportunity for firms to generate more value for the customer through the value-co-creation process, thereby enhancing the delivered value. To do so, it is important to utilize the service qualitymodel of Zeithaml et al. (1990) in improving the quality of these service encounters. When this service interaction is not present, or if customers do not want to be involved (see Lovelock & Gummesson, 2004), for any reason whatsoever, companies can only offer value propositions to their customers and cannot engage in value co-creation with the customer.
(4) All firms should keep in mind that the proposed characteristics of the IHIP schema (Intangibility, Heterogeneity, Inseparability, and Perishability) do not inevitably bring implications for the delivery process of these services vis-à-vis goods. Despite that the IHIP scheme is generally accepted throughout the literature, Lovelock & Gummesson (2004) provide the refutation of why this is not the case.
Page 15
3 Methodology
3.1
Research Design
To generate practical relevance out of the presented holistic understanding and to answer our sub-questions, we ought to transform it into a practical instrument for assessing and improving the value creation process of a firm. To do this, we wanted to collaborate with a service provider. Indicata BV agreed to do so and became the focal firm in our study. Indicata BV is an IT Service provider in the Netherlands of which the core business is to deliver cloud-computing solutions to its customers. In order to test our holistic understanding in practice a mixed methods research design was used, consisting of both quantitative and qualitative research. The research design of this study can further be typified as a “quantitative mixed” research design, indicating that qualitative research will be conducted despite quantitative research is dominant this research (Johnson, Onwuegbuzie, & Turner, 2007, Bryman & Bell, 2011). The purpose of ‘sequential’ mixed methods is to use qualitative results to assist in explaining and interpreting the findings of the quantitative study (Creswell, 2003). The choice for this particular research design was based on a couple of strengths of the methods. A first strength of using a mixed-methods approach is that the results of the quantitative research can be combined with the results of the qualitative research. This is what Morgan (1998) calls “complementary results”. Subsequently, the qualitative will provide us the possibility to delve even deeper into the subject. It will enable us to look for a confirmation of the quantitative data. Next to this, it will provide us a deeper insight in why the customer values the different attributes and processes of the value creation as well as the value creation process as a whole. Deeper insights about a subject can be gained more easily gained with qualitative research as this is often richer and more explanatory in nature than quantitative research. (Mack et al, 2005). A mixed-method approach is, hence, ideal when focusing on research questions that call for real-life contextual understandings, such as customer environments (Johnson, Onwuegbuzie, & Turner, 2007). Using multiple data collection methods also enables triangulation as two or more sources of data are combined in order to study the same phenomena, giving it a better and more complete understanding of the phenomena (Denzin, 1970; Johnson & Onwegbuzie, 2004; Bryman & Bell, 2011). Bryman & Bell (2011) state a similar argument for using mixed-methods research as they state that it is the use of a mixed method approach enables a more “rounded and complete picture to be drawn”.
3.2
Operationalization
The quantitative research instrument based on the holistic understanding.
Page 16 As explained in the theoretical framework of this research, the SERVQUAL model from Zeithaml et al. (1990) can serve as one of the founding models of our holistic model. In addition to this, we argue that the existing instrument of SERVQUAL can provide us a good basis for the creation of our holistic quantitative instrument. The format that is used in the SERVQUAL measurement provides us a good basis for the creation of a research instrument that measures the gap between expectation and perception. Along with the presented arguments in our holistic understanding. Subsequently, we follow an earlier proposed an operationalization as suggested by Macdonald et al. (2011, p. 31), stating in their recommendation that “a regular customer satisfaction tracker (such as SERVQUAL) could be extended to include not just satisfaction with the provider’s service but also with the firm’s own usage processes, as well as value-in-use perceptions”. This extension fits to our idea of the creation of an instrument for measuring our holistic understanding. However, instead of the firm’s own usage processes, we will focus on the value co-creation process. However, we do include an assessment of the process of value-in-use creation upon usage of provided resources by the customer into account, as recommended by Macdonald et al. (2011).
Based on our proposed holistic understanding and our concluding premises, we distinguish three main processes on which our operationalization will be based:
(1) The service interaction process: Measures the quality of the service interaction and the service delivery and the value improvements that could be made through this process. These questions are selected out of the existing SERVQUAL instrument. 8 of the original 22 SERVQUAL statements have been removed or combined with other statements, as we argue that there was overlap among these items with the other items in the research tool. Thereby, we tried to keep the survey as short as possible.
(2) The value co-creation process: Concerns how well the firm is engaging in the co-creation of value for customers and how this could be improved in order to increase value. These questions are designed based on the combined insights in our presented holistic understanding and the existing literature, as we didn’t find any existing qualitative questions that did fit well.
(3) The value-in-use facilitation process: Concerns how well the firm facilitates and/or supports customers in creating value-in-use out of the purchased service and how the customers evaluate this value upon usage. These questions are newly developed as well.
Page 17 and/or process. Below, an overview of the operationalization of the quantitative instrument is given. The relating questions that are developed and used for this instrument can be found Appendix E.
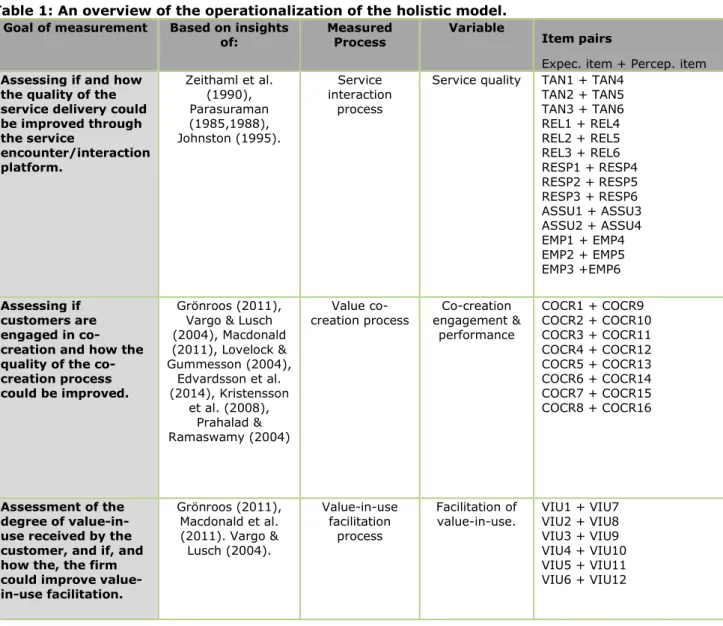
Table 1: An overview of the operationalization of the holistic model.
Goal of measurement Based on insights
of: Measured Process Variable Item pairs
Expec. item + Percep. item Assessing if and how
the quality of the service delivery could be improved through the service
encounter/interaction platform.
Zeithaml et al. (1990), Parasuraman (1985,1988), Johnston (1995). Service interaction process
Service quality TAN1 + TAN4 TAN2 + TAN5 TAN3 + TAN6 REL1 + REL4 REL2 + REL5 REL3 + REL6 RESP1 + RESP4 RESP2 + RESP5 RESP3 + RESP6 ASSU1 + ASSU3 ASSU2 + ASSU4 EMP1 + EMP4 EMP2 + EMP5 EMP3 +EMP6
Assessing if customers are engaged in co-creation and how the quality of the co-creation process could be improved.
Grönroos (2011), Vargo & Lusch (2004), Macdonald (2011), Lovelock & Gummesson (2004),
Edvardsson et al. (2014), Kristensson
et al. (2008), Prahalad & Ramaswamy (2004)
Value
co-creation process engagement & Co-creation performance
COCR1 + COCR9 COCR2 + COCR10 COCR3 + COCR11 COCR4 + COCR12 COCR5 + COCR13 COCR6 + COCR14 COCR7 + COCR15 COCR8 + COCR16
Assessment of the degree of value-in-use received by the customer, and if, and how the, the firm could improve value-in-use facilitation.
Grönroos (2011), Macdonald et al. (2011). Vargo & Lusch (2004).
Value-in-use facilitation
process
Facilitation of
value-in-use. VIU1 + VIU7 VIU2 + VIU8 VIU3 + VIU9 VIU4 + VIU10 VIU5 + VIU11 VIU6 + VIU12
Qualitative Research: Semi-structured interviews
Page 18 provides us the deeper insight that we desire for understanding the processes better. The interview including the set of fitting questions can be found in Appendix F.
3.3
Sampling
Quantitative research sample
The sampling of this research was done through purposive sampling as the sample was preselected through a set of criteria that was relevant to the research question (Mack et al, 2005). The sample of this research included only those employees of customer companies that had direct experience with the services of the focal company and the use of those services in their organization. As we were mainly interested in the current state of service delivery, we made a sample of companies that was representable at the time of the research. Out of the entire population we chose a sample of all the actual client companies of Indicata. Thereby a client company was ‘actual’ when it had been invoiced in the year of 2014. Because we take our sample based on if companies are invoiced or not in the last year, the sample cannot be characterized as a random-sample (Bryman & Bell, 2011). This is as we can only research the companies which are customers of Indicata as they are the only ones to have experience with their services. We were aiming to get around 50 respondents. The total sample was consisting of 300 employees of customer companies. Hence, we need a response rate of around 17% in order to get to the wanted number of respondents.
Central Limit Theorem
Based on the Central Limit Theorem (CLT) it can be stated that when one has a population with mean μ and standard deviation σ and take sufficiently large random samples from the population, then the distribution of the sample means (SDSM) will be approximately normally distributed. The Central Limit Theorem proves that regardless the distribution of the population, a sample will be approximately normally distributed if the sample is large enough. Many researchers accept the rule of thumb that N has to be larger than 30 in order to make sure that the SDSM is normal, enabling to conduct reliable parametric statistical tests (Pett 1997; Sekaran, 2003; Salkind, 2004; Fisher, 2007; Dayarathna, 2009: Crowe & Feinberg, 2014). It can, hence, be stated that means of samples larger than 30 will usually be very close to the mean of much larger samples (Saunders, Lewis & Thornhill, 2007).
Qualitative research sample
Page 19 1) PaaS-Customers/Hosting Customers: Platform-as-a-Service (PaaS) is a cloud computing service
model, enabling companies to run their operating systems on their PC’s straight from the cloud provider’s infrastructure.
2) On-Premise Customers: On-Premise clients purchase a whole IT infrastructure which is placed on location of the client and is managed by the IT Company which delivers the IT Infrastructure. 3) System management Customers: These customers already have an IT infrastructure at location,
but want to outsource the management and maintenance of their IT infrastructure to the IT Company.
4) Customers with hybrid- or different services: Customers that use a mix of the types as stated above or other less-demanded services such as Desktop-as-a-Service (DaaS) or Software-as-a-Service (SaaS).
Among these groups we tried to create a sample in which each of the four customer groups were evenly represented based on the total pool of customers from the focal company. By this way we also ensured that the data was gathered from all types of customers.
3.4
Data collection
The units of analysis of this research were client companies. These were the entities about which we wanted to know something about in our research. As companies aren’t observable, the units of observation should be distinguished as employees of client companies. These are the persons from which the data was collected to get knowledge about our units of analysis. For this research we chose to distribute the quantitative questionnaire through an online survey. Cabanoglu, Ward and Moreo (2001) state that online surveys, in comparison with postal questionnaires, achieve higher response rates and a faster response time (Bryman & Bell, 2011). Bryman & Bell (2011) state additional pros, such as the low(er) costs, more attractive formats, unrestricted compass and better data accuracy. The sales-staff of Indicata BV thereby assisted in creating awareness among their contacts within the sample, asking them if they had already filled in the survey and motivating them to do so if they had not. Afterwards, reminder e-mails were sent to those who didn’t participate yet, asking once again to participate in our research.
Page 20
3.5
Data analysis
Quantitative data analysis methods
The quantitative analysis was mainly done in SPSS. This allowed us to do statistical tests on the sample and our practical model. In addition, we could check the validity of the created research instrument. This was done through calculation of the Cronbach’s Alpha of the scales through which we measure. Secondly, we used statistical tests to look for statistical differences among the perception and the expectation of the customer along the three measured processes. This enabled us to spot differences among the expectation and perception of customers relating the three described processes of value creation. The parametric test that is often used in SERVQUAL-like studies to test such significances of differences between perception and expectation sample means, is the Paired sample t-Test.
Paired sample t-Test
A paired sample t-Test is a parametric statistical test and is used to test whether there is a significant difference between two values that are paired in some way (Elliot & Woodward, 2007). Thereby both measurements are made based on the same unit in a sample. The goal of this kind of test is, hence, to see if the differences between the averages of both measurements are significant. In our case, we measure the difference between the average perception score and the average perception score along the three tested processes. Before using the t-Test, one must first be able to assume that the sample is normally distributed. This is where the earlier Central Limit Theory comes in to play, concluding that samples that are larger than 30 observations generally fulfill the assumption of normality, even when the population from which the sample is taken from is not (Sekaran, 2003; Saunders, 2007; Dayarathna, 2009). However, we will also run additional tests to see if the sample is truly normally distributed.
Methods for testing the reliability of the developed quantitative research
instrument
As far as we knew there were no existing quantitative instruments that tried to measure the same three processes in an holistic overview such as presented in the current study. Therefore we had to develop our own new scales for a quantitative measurement of the value (co-) creation process and the value-in-use facilitation process. These scales can be seen in appendix E, were the quantitative research tool is presented. These scales needed to be used to gather data first, in order to test their validity and reliability.
Cronbach’s Alpha analysis for internal consistency
Page 21 intend to measure and are not largely influence by other factors which don’t. The Cronbach Alpha ( ) is used to measure the internal consistency of the scale and thus can tell us if all the items in the scale are measuring the same concept. As a general interpretation of Cronbach’s Alpha, the internal consistency of a scale is considered to be acceptable when 0.6 < < 0,7; good when 0.7 < < 0.9 and excellent when > 0.9. In order for the newly developed scale to be successful to measure the processes which we ought to measure, we hence need a Cronbach’s Alpha of at least 0.6. However, in this research we aim for a more than ‘good enough’ reliability, to make sure that the scale is reliable before other business will use the instrument in their firm and draw (critical) conclusions out of the results. Hence, we aim for an Cronbach’s Alpha of around 0.8 on all three scales.
Qualitative data analysis methods
Page 22
4 Results
4.1
Quantitative research results
In this chapter, the results regarding the qualitative data collection, which forms the dominant part of our results will be presented. First, the research instrument that was developed will be tested. Cronbach’s Alpha will be used to calculate the internal consistency of the quantitative instrument. Based on these reliability tests one is able to conclude if an instrument valid or not. After the instrument is tested, there will be continued with the results regarding which processes and attributes are seen as most important by the customer base of the focal company. Finally, parametrical tests will be conducted in order to search for the significant gaps between the perception and expectation of customers along the three processes. These results will enable us to get an insight on which attributes should be improved to enhance the process and how this can be done effectively.
The survey that we used to collect data was open for responses during a period of three weeks. Out of the 300 customers that were invited to the survey, 51 did participate. This, hence, resulted into a response rate of 17%. For the purpose of this research this is an acceptable amount. Out of all responses, 4 surveys were not filled in in its entirety. As only complete surveys can be used for statistical analysis, the data of only 47 respondents can be used for the gaps analysis of our service interaction and value (co-)creation processes. An analysis has also been made regarding the adequacy of this sample. In the coming chapter the results regarding the reliability of the newly developed research instrument will also be shown.
Adequacy of the sample
Although the Central Limit Theorem states that samples above n=30 usually are normally distributed (see ch. 4.3.2.), we once more want to test the normality of the data through a descriptive statistics test for normality to make sure that this indeed is the case. Based on the conducted Shapiro-Wilk and Kolmogorov-Smirnov tests for normality, of which the results can be found in appendix H, we can assume that the data is indeed normally distributed as all p-values from both tests are significant. As we now know that the data is normally distributed, it is sure that t-tests can be used to analyze any gaps between the expectation scores and the perception scores of customers. For this results to be reliable, we do not only need a representative and normally distributed sample, but we also need to make sure that the sample that is used is adequate. This is what is also called sample adequacy. To test if a sample is adequate, one can use a Kaiser-Meyer-Olkin test. As stated by Kaiser (1974) a sample is of acceptable adequacy when it has a KMO-score of at least 0.5.
Page 23 conclude that the sample on which we draw our conclusions regarding the reliability of our research instrument and the analyses of the firms performance along the processes, are adequate.
Reliability of the newly-developed research instrument
One of the main goals of this research was to make the earlier presented holistic understanding applicable in practice. We chose to do this through the creation of a research instrument that would enable firms to measure the three underlying processes of the holistic understanding of service delivery & value (co-) creation on their importance and, subsequently, the firm’s performance along these processes. As this is the first time that our quantitative instrument is utilized, we first need to test how well the scales were developed in terms of reliability and internal consistency. The data of the 51 respondents of the quantitative data collection allows us to conduct Cronbach’s Alpha tests, which tells us something about how reliable these developed scales are. As can be seen in the results of the Cronbach’s tests in Appendix G, we did find Cronbach’s alpha’s of .948 and .975 for the expectation and the perception scale respectively. Based on these numbers it can be said that both the expectation as well as the perception questionnaires do have excellent internal consistency according to Cronbach’s theory on internal consistency.
Both the perception and the expectation section of the questionnaire comprise of the same three underlying scales, representing and measuring the three individual processes: A Service interaction scale, which was developed out of the original SERVQUAL scale of Zeithaml et al. (1990) and a Co-creation scale and Value-in-use facilitation scale, which two were newly developed.
Regarding the service interaction scale, we see that our shortened version of the original SERVQUAL questionnaire (14 items instead of the original 22-item scale) performs around the same as the original SERVQUAL questionnaire. The Cronbach’s Alpha ( ) analysis of the service interaction process scale show numbers of .910 and .945 for the expectation and the perception scale of the service interaction process respectively. As shown in the article of Parasuraman, Berry & Zeithaml (1991, p. 423) the original (refined) SERVQUAL scale achieves Cronbach Alpha’s around this 0.9 mark as well, which is comparable to our results. The reduction of the original set of items that were used in the original SERVQUAL questionnaire, hence, did not have a considerable effect on the internal reliability of the scale in a positive way nor a negative way.
Page 24 hence, are appropriate for the purpose and goal of this research. In appendix G, all reliability tests are shown in an overview.
Assessing process and attribute importance
Now both the instrument and the sample have been tested for their internal consistency and adequacy respectively, we can start analyzing the results that the developed instrument has provided us. In this paragraph we are mainly interested in which attributes of the three distinguished processes are seen as most important/valuable by the customers, as well as which process is generally seen as most important in the creation of value. Afterwards we will start with our gaps analysis along the three different processes. This will be done in the next chapter. Analyzing the gaps along the processes will give us a clear insight in how these three processes of the holistic model could be improved. This is very helpful regarding one of the core aims of this research, which is to increase customer value by improving the value processes and to communicate this value in an improved value proposition.
Attribute importance along the service interaction process
Based on our sample of 51 customers we were able to calculate expectation score means along all the expectation attributes of the three processes (See appendix E for all questionnaire items). The expectations were measured through a 1-7 Likert scale. Subsequently, a higher score on an attribute does indicate a higher importance/value of that attribute inside a process. By calculating the sum and the mean of the attribute expectation scores, an overview of the attributes inside each of the processes could be made, as can be seen in the coming pages.
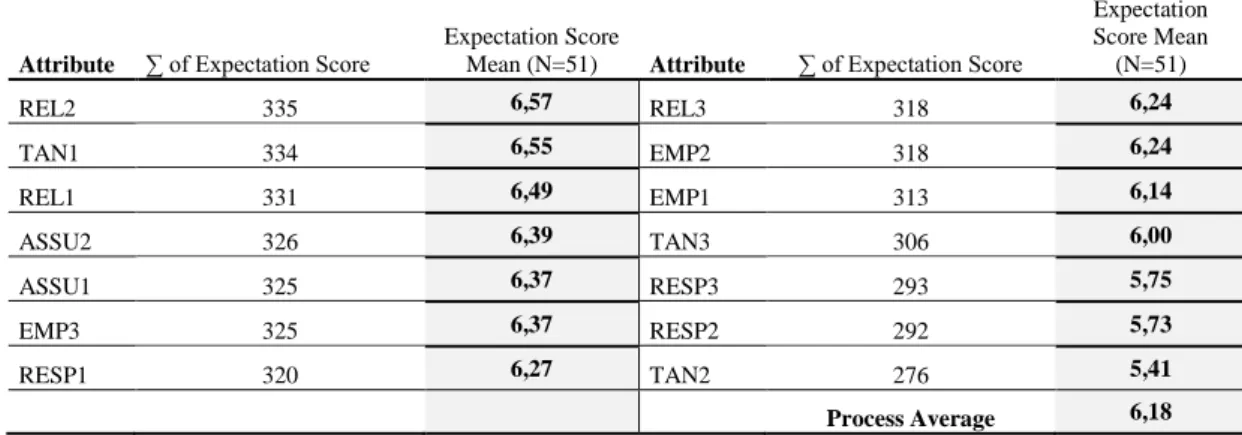
Table 4: Service interaction attribute importance – Average of Expectation Scores
Attribute ∑ of Expectation Score
Expectation Score
Mean (N=51) Attribute ∑ of Expectation Score
Expectation Score Mean (N=51)
REL2 335 6,57 REL3 318 6,24
TAN1 334 6,55 EMP2 318 6,24
REL1 331 6,49 EMP1 313 6,14
ASSU2 326 6,39 TAN3 306 6,00
ASSU1 325 6,37 RESP3 293 5,75
EMP3 325 6,37 RESP2 292 5,73
RESP1 320 6,27 TAN2 276 5,41
Process Average 6,18
Page 25 at table four it can be seen that the attributes concerning the responsiveness and tangibles dimension are largely in the second half of the most important service interaction attributes list. However, we see one exception: TAN1. Based on this result we argue that however the tangibles dimension is seen as less important in general, the respondents indicate it is highly important that the goods that are provided by firms in support of the delivered service , are nonetheless of high quality.
Table 5: Dimension Expectation Means – Service interaction process Att. No REL TAN ASSU EMP RESP
1 6,57 6,55 6,39 6,37 6,27
2 6,49 6,00 6,37 6,24 5,75
3 6,24 5,41 - 6,14 5,73
Average 6,43 5,99 6,38 6,25 5,92
When computing the averages of the attribute expectation means, as is done in table 5, we can see that the softer dimensions (REL, ASSU & EMP) indeed show slightly higher averages regarding their expectation score.
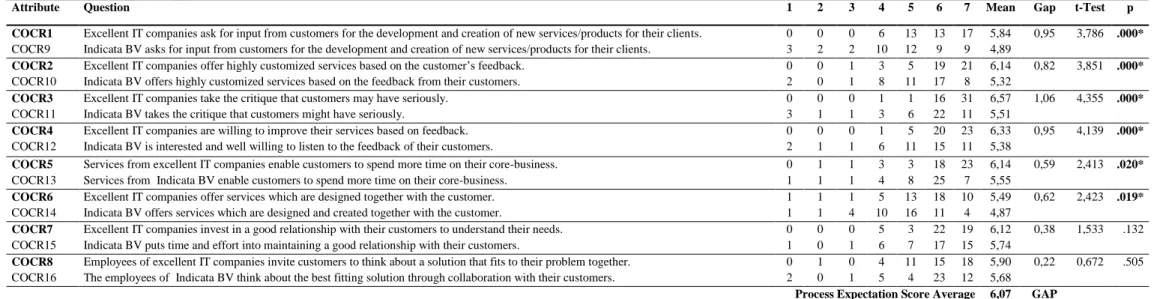
Attribute importance along the co-creation process.
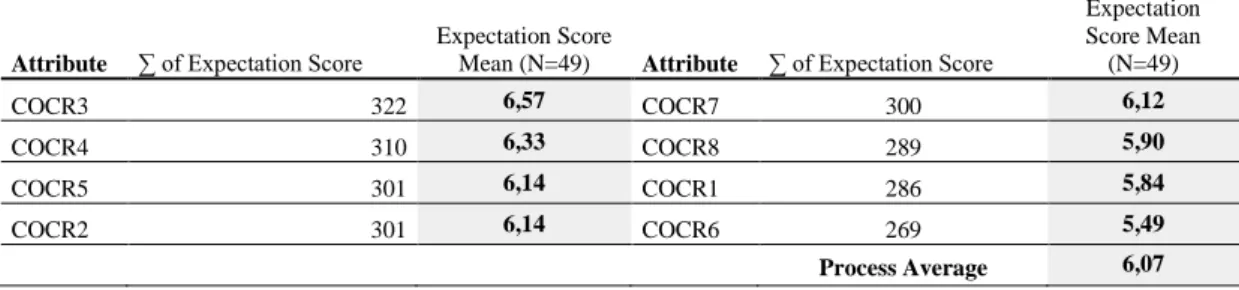
Table 6: Co-creation process attribute importance - Average of Expectation Scores
Attribute ∑ of Expectation Score Expectation Score Mean (N=49) Attribute ∑ of Expectation Score
Expectation Score Mean (N=49)
COCR3 322 6,57 COCR7 300 6,12
COCR4 310 6,33 COCR8 289 5,90
COCR5 301 6,14 COCR1 286 5,84
COCR2 301 6,14 COCR6 269 5,49
Process Average 6,07
Page 26
Attribute importance along the value-in-use process.
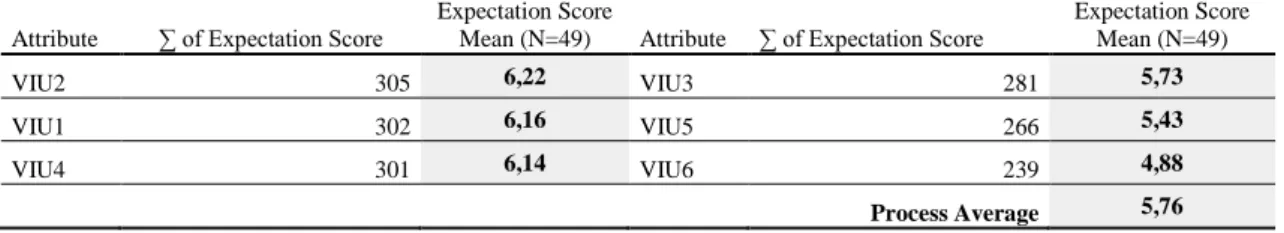
The table below presents the results regarding the value-in-use facilitation process of the focal firm. This process relates to how well a firm is facilitating its customers in the use of the service after their purchase. This does also include if service provider is proactively thinking about opportunities for optimization of the service usage in customers’ businesses.
Table 7: Value-in-use Facilitation Process Importance – Average Expectation Scores
Attribute ∑ of Expectation Score
Expectation Score
Mean (N=49) Attribute ∑ of Expectation Score
Expectation Score Mean (N=49)
VIU2 305 6,22 VIU3 281 5,73
VIU1 302 6,16 VIU5 266 5,43
VIU4 301 6,14 VIU6 239 4,88
Process Average 5,76
Regarding the Value-in-use facilitation process, the results seems indicate that customers find the active support of the service by the service provider (VIU2) and pro-active thinking with the customer (VIU1) and the optimization (VIU4) of the customers’ business after purchase are rather equally important according to the respondents. We can, however, see that the differences between the top three attributes and the other attributes are considerably larger. This indicates a slight difference in importance among the top three and the bottom three attributes. We see that customers, in a lesser degree, the respondents expect from the service provider that they enable them to do certain tasks of which they were not able before. The results, however, seem to indicate that the respondents indicate that it is more important that a service provider should act and behave like a partner of the customers company, instead of just being a supplier. The results show that the respondents seek pro-active support in the use of their services and seem to find the after-sales period to be of great importance. We argue that, regarding the delivery of an integrated solution as Macdonald et al. (2011) and Ng et al. (2012) propose, the advice and pro-active support indeed seem to play an important role in the delivery of the service.
Now we have clarity on which processes and which sorts of attributes are important along and inside the three distinguished processes, it is important to find which attributes are most effective to improve in order to generate as much added value as possible. This can be done by making a benchmark through what the customers expect to get along the three processes, and what the customers perceived to have gotten from the focal company. This can be done through a gap 5 analysis, as we explained earlier in chapter 3.4.1.
4.2
Value (co-)creation performance along the three processes:
Gap analysis
Page 27 customer value in general. However, an absolute difference in numbers is not enough to conclude that a firm actually fails to meet the expectation of the customer. In order to be able to do so, we need to test if the mean differences among the attributes are also statistically significant. To do this, we conduct a paired t-Test, as is explained in the data analysis chapter. The results of these tests can be seen in the tables that are presented in the coming pages.