University of Warwick institutional repository: http://go.warwick.ac.uk/wrap
This paper is made available online in accordance with
publisher policies. Please scroll down to view the document
itself. Please refer to the repository record for this item and our
policy information available from the repository home page for
further information.
To see the final version of this paper please visit the publisher’s website.
Access to the published version may require a subscription.
Author(s): Ritaban Dutta, Evor L Hines, Julian W Gardner and Pascal
Boilot
Article Title: Bacteria classification using Cyranose 320 electronic nose
Year of publication: 2002
Open Access
BioMedical Engineering OnLine2002,
1 x
Research
Bacteria classification using Cyranose 320 electronic nose
Ritaban Dutta*, Evor L Hines, Julian W Gardner and Pascal Boilot
Address: Division of Electrical and Electronic Engineering, School of Engineering, University of Warwick, Coventry, CV4 7AL, United Kingdom
E-mail: Ritaban Dutta* - [email protected]; Evor L Hines - [email protected]; Julian W Gardner - [email protected]; Pascal Boilot - [email protected]
*Corresponding author
Abstract
Background: An electronic nose (e-nose), the Cyrano Sciences' Cyranose 320, comprising an array of thirty-two polymer carbon black composite sensors has been used to identify six species of bacteria responsible for eye infections when present at a range of concentrations in saline solutions. Readings were taken from the headspace of the samples by manually introducing the portable e-nose system into a sterile glass containing a fixed volume of bacteria in suspension. Gathered data were a very complex mixture of different chemical compounds.
Method: Linear Principal Component Analysis (PCA) method was able to classify four classes of bacteria out of six classes though in reality other two classes were not better evident from PCA analysis and we got 74% classification accuracy from PCA. An innovative data clustering approach was investigated for these bacteria data by combining the 3-dimensional scatter plot, Fuzzy C Means (FCM) and Self Organizing Map (SOM) network. Using these three data clustering algorithms simultaneously better 'classification' of six eye bacteria classes were represented. Then three supervised classifiers, namely Multi Layer Perceptron (MLP), Probabilistic Neural network (PNN) and Radial basis function network (RBF), were used to classify the six bacteria classes.
Results: A [6 ´ 1] SOM network gave 96% accuracy for bacteria classification which was best accuracy. A comparative evaluation of the classifiers was conducted for this application. The best results suggest that we are able to predict six classes of bacteria with up to 98% accuracy with the application of the RBF network.
Conclusion: This type of bacteria data analysis and feature extraction is very difficult. But we can conclude that this combined use of three nonlinear methods can solve the feature extraction problem with very complex data and enhance the performance of Cyranose 320.
Background
Despite the robustness of the eye, there is no doubt that it is exposed to a harsh environment where it is continually in contact with infectious airborne organisms. The func-tion of the eyelids and producfunc-tion of tears help to protect the eye. However the warm, moist, enclosed environment,
which exists between the surface of the eye (conjunctiva) and the eyelids, also provides an environment in which contaminating bacteria can establish an infection. The most common bacterial eye infection is conjunctivitis and organisms such as Staphylococcus aureus, Haemophilus influenzae, Streptococcus pneumoniae, Escherichia coli
Published: 16 October 2002
BioMedical Engineering OnLine 2002, 1:4
Received: 1 September 2002 Accepted: 16 October 2002
This article is available from: http://www.biomedical-engineering-online.com/content/1/1/4
BioMedical Engineering OnLine 2002, 1 http://www.biomedical-engineering-online.com/content/1/1/4
have been associated with this condition [1]. The number of organisms responsible for infection of the eye is rela-tively small; nevertheless the consequences are always po-tentially serious as the eye may become irreversibly damaged. Rapid diagnosis is therefore essential but cur-rently relies on time-consuming isolation and culture of the infectious agent, and use of precise analytical instru-ments (e.g. liquid chromatography or optical microsco-py). Since it is very important that the nature of the infection is diagnosed as quickly as possible, it is clear that techniques such as a neural network based e-nose, which can almost instantly detect and classify odorous volatile components, could make a major contribution [2]. The term electronic nose (e-nose) describes an electronic sys-tem that is able to mimic the human sense of smell. These systems have been the subject of much research at the University of Warwick over the past 20 years or so.
E-nose systems use a number of different gas sensors de-pending on the application, e.g. metal oxide chemoresis-tors, conducting polymer chemoresischemoresis-tors, etc. Other aroma-based techniques exist, however while gas chroma-tograph or mass spectrometry techniques can be used to separate, quantify and identify individual volatile chemi-cals, they do not indicate whether the compounds contain an odour or not. Therefore e-noses have been developed to improve on and to complement these techniques, and thus provide a better emulation of the human system for sensory analysis. Researchers are currently developing a new generation of artificial e-nose in order to build small-er and cheapsmall-er systems that thus will find application in the consumer marketplace. Research also focuses on the data processing aspects, exploring possibilities to integrate new techniques such as neural networks, fuzzy logic and genetic algorithms in order to develop the intelligent e-nose. Nearly twenty years of development, e-nose tech-nology has been applied in various fields such as the food, drinks and cosmetic industries. More recently research has been directed towards health and safety issues [3], for ex-ample in the medical arena and medical diagnosis, food quality and control, environmental monitoring. E-nose systems have already been used with success in the medi-cal domain [4], for microbial detection [2], and bioproc-ess monitoring [5]. In this paper we describe the use of Cyrano Sciences' Cyranose 320 to identify six species of bacteria, which are believed to be responsible for eye in-fections, when present at a range of concentrations in sa-line solutions.
Methods
MaterialsThe bacterial samples used in this experiment are among the most common bacterial pathogens responsible for eye infection i.e. Staphylococcus aureus (sar), Haemophilus influ-enzae (hai), Streptococcus pneumoniae (stp), Escherichia coli
(eco), Pseudomonas aeruginosa (psa) and Moraxella catarrh-alis (moc). All bacteria were grown on blood or lysed blood agar in standard petridishes at 37°C in a humidified atmosphere of 5% CO2 in air. After overnight culturing,
the bacteria were suspended in sterile saline solution (0.15 M NaCl) to a concentration of approximately 108
colony forming units (cfu)/ml. A ten-fold dilution series of bacteria in saline was prepared and three dilutions (d1 = 108, d2 = 105 and d3 = 104 cfu/ml) were sniffed using
the e-nose. The numbers of viable bacteria present were confirmed by plating out a small aliquot of the diluted samples and counting the resultant colonies after over-night incubation.
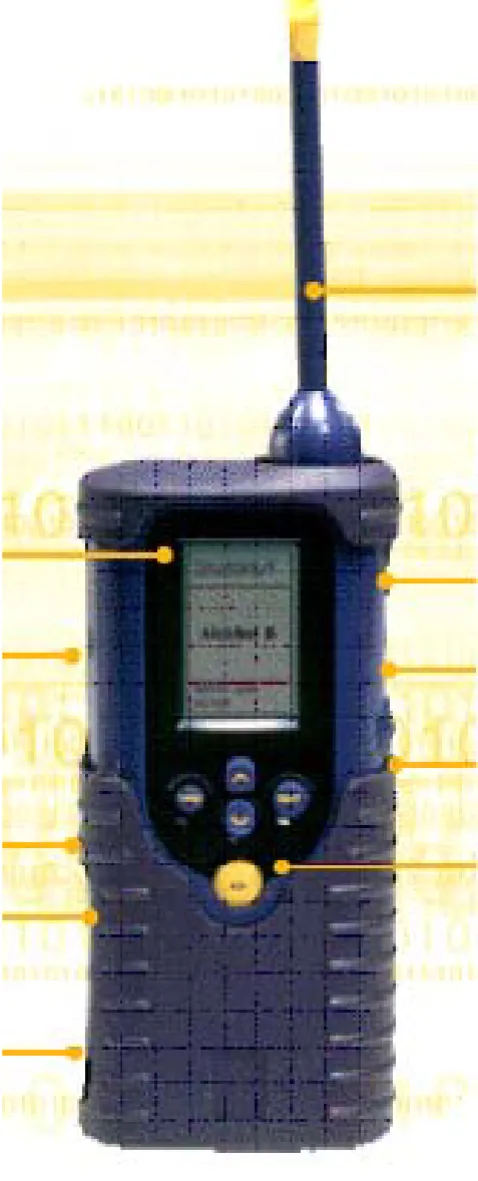
Instrumentation
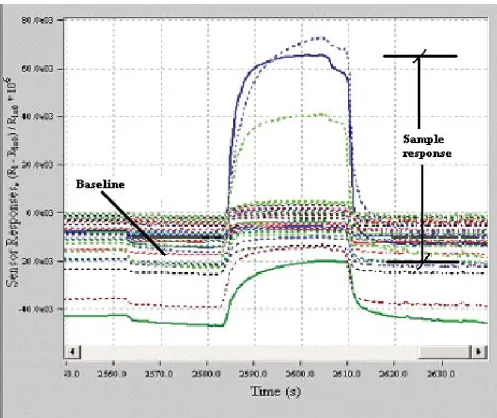
The e-nose used was Cyrano Sciences' Cyranose 320, a portable system (see Figure 1), who's component technol-ogy consists of 32 individual polymer sensors blended with carbon black composite, configured as an array. When the sensors are exposed to vapours or aromatic vol-atile compounds they swell, changing the conductivity of the carbon pathways and causing an increase in the resist-ance value that is monitored as the sensor signal. The re-sistance changes across the array are captured as a digital pattern that is representative of the test smell. The sensor technology yields a distinct response signature for each vapour regardless of its complexity; the overall response to a particular sample produces a 'smell print' specific to a stimulus (Cyr ano Sciences, USA [6]). See Figure 2 for a typical response of the Cyranose 320.
Test procedures
Data were gathered as follows:
• For the eye bacteria tests, the Cyranose 320 was intro-duced manually to a sterile glass vial containing a fixed volume of bacteria in suspension (4 ml). The operation was repeated ten times for each one of the three dilutions of each of the six bacteria species, to give a total of 180 readings. These data was gathered through a whole week.
Signal pre-processing
Conventional exploratory technique for data clustering
The use of Principal Component Analysis (PCA), Fuzzy C Means (FCM) and Self Organizing Map (SOM) to assess clustering within the data set is now discussed [8,9]. These exploratory techniques are used to investigate how the data cluster in the multi-sensor space. Several techniques were applied to verify that the categories established by each were not arbitrary and the groups formed match the six types of bacteria. The objective of this analysis was to establish simple classes for the different bacteria species in order to examine whether or not the data clusters could be separated in preparation for the pattern recognition stage.
Results
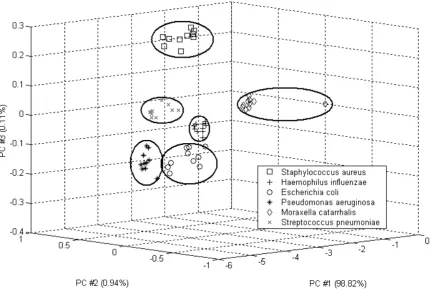
PCA analysisPCA is an effective linear method for discriminating be-tween the e-nose responses to simple and complex odours [8]. The method consists of expressing the response tors in terms of a linear combination of orthogonal vec-tors that account for a certain amount of variance in the data. The results of the PCA are shown in Figure 3. Three principal components were kept, which accounted for 99.87% of the variance (PC 1, PC 2 and PC 3 representing respectively 98.82%, 0.94% and 0.11%). 6 categories or clusters appear to be evident. The six clusters formed match the six types of bacteria so that the bacteria were completely separated in the principal component space but classification accuracy was upto 74%. From PCA anal-ysis four classes of bacteria namely Staphylococcus aureus (sar), Haemophilus influenzae (hai), Streptococcus pneu-moniae (stp) and Moraxella catarrhalis (moc) were prop-erly classified though other two most common classes of eye bacteria like Escherichia coli (eco), Pseudomonas aer-uginosa (psa) were not properly classified (see Figure 3). Most of the variance in the data is explained by consider-ing only the first principal component (PC1), which im-plies that the sensor responses are highly correlated. As PC1 accounts for most of the information in the data, this suggests that the clusters were not made any more evident using PCA. That is linear PCA analysis is not informative for this type of data. The objective of this analysis was to establish simple classes for the different bacteria species in order to examine whether or not the data clusters could be separated, prior to the conventional pattern recognition stage.
Less correlated Sensor selection
[image:4.612.55.294.103.694.2]Previous tests experiences with the Cyranose 320 system suggests that some of the sensors could be omitted for data analysis. This is because sensors are highly correlated in nature. The best representation of the information in the data can be achieved only if we can represent our data by using the least correlated sensors.
Figure 1
BioMedical Engineering OnLine 2002, 1 http://www.biomedical-engineering-online.com/content/1/1/4
Hence we calculated the correlation coefficients of the sensors by evaluating the sensor response matrix using the MATLAB 6.1 function "corrcoef " [7]; where each row is an observation (The gathered response of the sensors), and each column is a variable (sensor). Using the MATLAB 6.1 function "corrcoef" [7] on the whole data set a matrix of correlation coefficient was achieved; then least correlated sensors were selected by doing column wise summation of the correlation coefficient matrix and sorting the mini-mum added values. Load values of the all sensors were also considered for least correlated sensors selection. It was evident that effectively the three least correlated sen-sors are sensor 23, 24 and 26 from correlation coefficient matrix.
Combined SOM, FCM and 3D – Scatter plot analysis: A new approach
[image:5.612.57.554.84.502.2]SOM and FCM were applied to the data set in order to in-vestigate clustering using the responses from the 32 sen-sors. A SOM network is a non-linear Artificial Neural Network (ANN) paradigm, which is able to accumulate statistical information about data with no other supple-mentary information than that provided by the sensors [9]. Various SOM networks were created and trained with the entire data set, subsequently samples were associated with one of the neurones and neurones were grouped to-gether to form categories corresponding to each identified bacteria.
Figure 2
FCM is a fuzzy data clustering and partitioning algorithm in which each data point belongs to a cluster according to its degree of membership [10]. With FCM, an initial esti-mate of the number of clusters is needed so that the data set is split into C fuzzy groups. A cluster centre is found for each group by minimising a dissimilarity function. Fuzzy clustering essentially deals with the task of splitting a set of patterns into a number of more-or-less homogeneous classes (clusters) with respect to a suitable similarity meas-ure such that the patterns belonging to any one of the clus-ters are similar and the patterns of different clusclus-ters are as dissimilar as possible. The similarity measure used has an important effect on the clustering results since it indicates which mathematical properties of the data set should be used in order to identify the clusters. Fuzzy clustering pro-vides partitioning results with additional information supplied by the cluster membership values indicating dif-ferent degrees of belongingness [10].
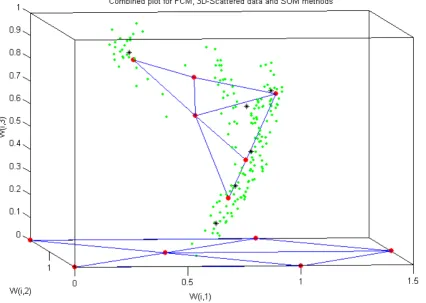
An innovative data clustering approach was investigated for these bacteria data by combining the 3-dimensional scatter plot, FCM and SOM network. This is depicted in the Figure 4. In multisensor space, normalised data sets
[image:6.612.88.521.392.685.2]were represented using 3-D scatter plots. From the FCM approach, a cluster centre is found for each group by min-imising a dissimilarity function [7]. These cluster centres were plotted in multisensor space. So combining the 3D scatters plot and FCM, cluster centres were properly locat-ed in multisensor space and also within the data. Various SOM networks were created and trained with the entire data set; a [6 ´ 1] and a [3 ´ 2] SOM network performed best from all other SOM networks. In the Figure 4 there are six neurones at the bottom which indicate the initial weights of the SOM before training. After 5000 epochs it was clear that the six nodes were approaching to the six cluster centres (estimated using FCM), which is more clearly evident from Figure 4. So using these three data clustering algorithms simultaneously better 'classification' of six eye bacteria classes were represented. A [6 ´ 1] SOM network gave 96% accuracy for bacteria classification which was best accuracy as far as SOM networks are con-cerned along with FCM and 3D-Scatter methods. The ob-jective of this analysis was to establish simple classes for the different bacteria species in order to examine if the data clusters could be separated for the conventional pat-tern recognition stage.
Figure 3
BioMedical Engineering OnLine 2002, 1 http://www.biomedical-engineering-online.com/content/1/1/4
Evaluation of neural network-classification performance
Neural Networks
The six different bacteria dataset were analyzed using three supervised ANN classifiers, namely the Multi Layer Perceptron (MLP), Probabilistic Neural network (PNN) and Radial basis function network (RBF) paradigms. Training of the neural networks was performed with 40% of the whole data set. The remaining 60% of the whole data were used for testing the neural networks. These per-centages were selected arbitrarily and were applied for all data sets. The aim of this comparative study was to identi-fy the most appropriate ANN paradigm, which can be trained with best accuracy, to predict the "type of eye in-fections" or in other words "type of eye bacteria".
Performance of MLP, RBF and PNN
For MLP
A MLP network (with learning rate equal to 0.2 and a mo-mentum term equal to 0.3) with 3–32 inputs and 6 out-put neurons was able to reach a success rate 75% in classification.
For RBF and PNN
Neurons are added to the network until the sum-squared error (SSE) falls beneath an error goal (0.000001) or a maximum number (40) of internal neurons was reached. It is important that the spread parameter be large enough so that the radial basis neurons respond to overlapping re-gions of the input space, but not so large that all the neu-rons respond in essentially the same manner [7]. For both the networks the spread parameter was set to 1.0.
PNN was able to correctly classify 94% of the response vectors where as the RBF network's level of correct classifi-cation was up to 98%.
T-test
[image:7.612.91.518.101.404.2]A t-test was performed to assess if RBF, PNN were per-forming significantly better than the MLP in terms of the total number of patterns correctly classified. The null hy-pothesis H0 demonstrated that there was no significant difference between the mean number of patterns misclas-sified by the RBF and PNN. The hypothesis H0 was reject-ed at the 4% significance level (t = 2.19 for RBF and t = 4.49 for PNN).
Figure 4
Conclusion
This type of bacteria data analysis and feature extraction is very difficult. We can conclude that this combined use of three nonlinear methods (3D-Scatter plot, SOM, FCM) can solve the feature extraction problem with very com-plex data and enhance the performance of Cyranose 320. Later on two supervised ANN classifiers, PNN and RBF, were able to predict the six different bacteria classes with 94% and 98% accuracy respectively; where the training of the supervised ANN classifiers were performed using 40% of the whole data set for the six bacteria. Linear PCA meth-od was able to classify four classes of bacteria out of six classes though in reality other two classes were not better evident from PCA analysis and we got 74% classification accuracy from PCA. An innovative data clustering ap-proach was investigated for these bacteria data by combin-ing the 3-dimensional scatter plot, FCM and SOM network. Using these three data clustering algorithms si-multaneously better 'classification' of six eye bacteria classes were represented. A [6 ´ 1] SOM network gave 96% accuracy for bacteria classification which was best accura-cy. Then three supervised classifiers, namely Multi Layer Perce ptron (MLP), Probabilistic Neural network (PNN) and Radial basis function network (RBF), were used to classify the six bacteria classes. A comparative evaluation of the classifiers was conducted for this application. The best results suggest that we are able to predict six classes of bacteria with up to 98% accuracy with the application of the RBF network. So from these results we can conclude that in future we can create a 'knowledge base of extracted features' by applying three nonlinear methods like 3D-Scatter plot, SOM and FCM for each bacteria class. So in future if we have an input dataset from unknown bacteria, by applying these three methods in a combined manner we can extract some feature for that unknown class of bac-teria; later on we can match with the existing knowledge base of classes of bacteria features to predict the bacteria class. For this matching purpose, supervised ANN classifi-ers like PNN or RBF can be used with very high accuracy. This type of bacteria data analysis and feature extraction is very difficult. But we can conclude that this combined use of three nonlinear methods along with RBF neural net-work can solve the feature extraction problem with very complex data and enhance the performance of Cyranose 320.
References
1. Infections of the eye.Medical Microbiology (Edited by: Mins) Mosby
1993
2. Gardner JW, Craven M, Dow CS, Hines EL: The prediction of bac-teria type and culture growth phase by an electronic nose with a multi-layer perceptron network.Meas Sci Technol 1998,
9:120-7
3. Gardner JW, Bartlett PN: Electronic noses: principles and appli-cations.Oxford University Press 1999
4. Di Natale C, Mantini A, Macagnano A, Antuzzi D, Paolesse R, D'Am-ico A: Electronic nose analys is of urine samples containing blood.Physical Meas 1999
5. Shin HW, Llobet E, Gardner JW, Hines EL, Dow CS: Classification of the strain and growth phase of cyanobacteria in potable water using an electronic nose system.IEE Proc – Sci Meas Tech-nol 2000, 147:158-64
6. [www.cyranosciences.com] 7. [www.mathworks.com]
8. Gardner JW: Detection of vapours and odours from multi-sen-sor array using pattern recognition, part 1: principal compo-nents and cluster analysis.Sensors Actuators 1991, B4:108-16 9. Kohonen T: Self-organising and associative memory Berlin:
Springer-Verlag 1987
10. Jang JSR, Sun CT, Mizutani : Neuro-fuzzy and soft computing: a computational approach to learning and machine intelli-genceUpper Saddle River NJ: Prenctice Hall 1997, 423-33
Publish with BioMed Central and every scientist can read your work free of charge
"BioMedcentral will be the most significant development for disseminating the results of biomedical research in our lifetime."
Paul Nurse, Director-General, Imperial Cancer Research Fund Publish with BMC and your research papers will be:
available free of charge to the entire biomedical community
peer reviewed and published immediately upon acceptance
cited in PubMed and archived on PubMed Central
yours - you keep the copyright
[email protected] Submit your manuscript here:
http://www.biomedcentral.com/manuscript/