University of Warwick institutional repository: http://go.warwick.ac.uk/wrap
This paper is made available online in accordance with
publisher policies. Please scroll down to view the document
itself. Please refer to the repository record for this item and our
policy information available from the repository home page for
further information.
To see the final version of this paper please visit the publisher’s website.
Access to the published version may require a subscription.
Author(s): M. A. P. Torres, D. Steeghs, R. Schwarz, A. Rau, H.-J.
Hagen, T. Muñoz-Darias, P. Rodríguez-Gil, B. T. Gänsicke
Article Title: An evolved donor star in the long-period cataclysmic
variable HS 0218+3229
Year of publication: 2009
Link to published article:
http://dx.doi.org/
10.1051/0004-6361/200811312
Publisher statement: © ESO 2009. M. A. P. Torres et al. (2009). An
evolved donor star in the long-period cataclysmic variable HS
/ / c
ESO 2009
Astrophysics
&
An evolved donor star in the long-period cataclysmic
variable HS 0218+3229
P. Rodríguez-Gil
1,2,3, M. A. P. Torres
4, B. T. Gänsicke
3, T. Muñoz-Darias
2,
D. Steeghs
3,4, R. Schwarz
5, A. Rau
6, and H.-J. Hagen
71 Isaac Newton Group of Telescopes, Apartado de correos 321, 38700, Santa Cruz de La Palma, Spain e-mail:[email protected]
2 Instituto de Astrofísica de Canarias, vía Láctea, s/n, La Laguna, 38205 Santa Cruz de Tenerife, Spain 3 Department of Physics, University of Warwick, Coventry CV4 7AL, UK
4 Harvard-Smithsonian Center for Astrophysics, 60 Garden St, Cambridge, MA 02138, USA 5 Astrophysikalisches Institut Potsdam, An der Sternwarte 16, 14482 Potsdam, Germany
6 Caltech Optical Observatories, Mail Stop 105-24, California Institute of Technology, Pasadena, CA 91125, USA 7 Hamburger Sternwarte, Universität Hamburg, Gojenbergsweg 112, 21029 Hamburg, Germany
Received 7 November 2008/Accepted 20 January 2009
ABSTRACT
Context.We present time-resolved spectroscopy and photometry of HS 0218+3229, a new long-period cataclysmic variable discov-ered within the Hamburg Quasar Survey. It is one of the few systems that allow a dynamical measurement of the masses of the stellar components.
Aims.We combine the analysis of time-resolved optical spectroscopy andR-band photometry with the aim of measuring the mass of the white dwarf and the donor star and the orbital inclination.
Methods.Cross-correlation of the spectra with K-type dwarf templates is used to derive the radial velocity curve of the donor star. An optimal subtraction of the broadened templates is performed to measure the rotational broadening and constrain the spectral type of the donor. Finally, an ellipsoidal model is fitted to theR-band light curve to obtain constraints upon the orbital inclination of the binary system.
Results.The orbital period of HS 0218+3229 is found to be 0.297229661±0.000000001 d (7.13351186±0.00000002 h), and the amplitude of the donor’s radial velocity curve isK2 = 162.4±1.4 km s−1. Modelling the ellipsoidal light curves gives an orbital inclination in the rangei=59◦±3◦. A rotational broadening between 82.4±1.2 km s−1and 89.4±1.3 km s−1is found when assuming zero and continuum limb darkening, respectively. The secondary star has most likely a spectral type K5 and contributes∼80–85% to theR-band light. Our analysis yields a mass ratio of 0.52<q<0.65, a white dwarf mass of 0.44<M1(M)<0.65, and a donor star mass of 0.23<M2(M)<0.44.
Conclusions.We find that the donor star in HS 0218+3229 is significantly undermassive for its spectral type. It is therefore very likely that it has undergone nuclear evolution prior to the onset of mass transfer.
Key words.accretion, accretion discs – stars: binaries: close – stars: novae, cataclysmic variables
1. Introduction
Testing the current evolutionary models of the present-day Galactic population of cataclysmic variables (CVs) is not possi-ble without a significant sample of the actual masses of the white dwarfs (i.e. the accretors) and the late-type companion stars (i.e. the donors) that form this sort of binary system. But accurate measurements of the component masses in CVs are, however, not an easy task. The donor stars are usually veiled by the ex-treme brightness of the accretion structures, especially the ac-cretion disc. Furthermore, the white dwarfs are also very often hidden from view in CVs with orbital periods above the 2–3 h period gap, so optical studies aimed at dynamical mass mea-surements are scarce and usually make dubious assumptions. A
Based in part on observations collected at the Centro Astronómico Hispano Alemán (CAHA) at Calar Alto, operated jointly by the Max-Planck Institut für Astronomie and the Instituto de Astrofísica de Andalucía (CSIC). Observations were also obtained at the FLWO Observatory, a facility of the Smithsonian Institution.
common practice has been to assume that the amplitude of the radial velocity curve of the wings of the disc emission lines can be regarded as a reasonable estimate of the radial velocity ampli-tude of the white dwarf (K1), but this assumption is usually far
from being true (see e.g.Shafter et al. 1995). Therefore, time-resolved studies of CVs in which the donor star and/or the white dwarf are exposed are chiefly important to our understanding of CV evolution.
HS 0218+3229 was discovered during our large-scale search for CVs in the hamburg quasar survey (HQS), based on their spectroscopic properties or, more specifically, the pres-ence of strong emission and/or absorption lines (Gänsicke et al. 2002b). Fifty-three new CVs were found within this project, and the orbital period has been determined for the majority of them. The main result is that most of the HQS CVs have been found to have orbital periods above the period gap. Those include rarely outbursting dwarf novae, such as GY Cnc (HS 0907+1902, Gänsicke et al. 2000) or RX J0944.5+0357 (HS 0941+0411, Mennickent et al. 2002);
806 P. Rodríguez-Gil et al.: An evolved donor star in HS 0218+3229
HS0218+3229
C1
N
[image:3.595.75.275.74.274.2]E
Fig. 1.10×10finding chart of HS 0218 obtained from the Digitized Sky Survey 2. The coordinates of the new CV are α(J2000) = 2h21m33.50s,δ(J2000) = +32◦4323.8. The star “C1” has been used as comparison for theR-band differential photometry.
magnetic CVs with relatively weak X-ray emission such as 1RXS J062518.2+733433 (HS 0618+7336, Araujo-Betancor et al. 2003), RX J1554.2+2721 (HS 1552+2730, Thorstensen & Fenton 2002; Gänsicke et al. 2004), and HS 0943+1404 (Rodríguez-Gil et al. 2005); a number of SW Sextantis stars (Szkody et al. 2001; Rodríguez-Gil et al. 2004,2007); one of the youngest pre–CVs known (HS 1857+5144, Aungwerojwit et al. 2007); long-period CVs (Aungwerojwit et al. 2005); and several dwarf novae (Aungwerojwit et al. 2006).
This paper presents the dynamical determination of the stellar masses in the cataclysmic variable HS 0218+3229. We present the data in Sect.2, and an identification spectrum in Sect.3. The orbital period is measured from the optical photom-etry in Sect.4before analysing the time-resolved spectroscopic data in Sect.5. Modelling of the ellipsoidal modulation is carried out in Sect.6. Finally, the system parameters of HS 0218+3229 and the overall discussion are presented in Sect.7.
2. Observational data
2.1. Photometry
Astrophysikalisches Institut Potsdam. Time series R-band photometry of HS 0218+3229 (hereafter HS 0218) was obtained on 3 nights during the period 2001 January–February using the 0.70 m telescope of the astrophysikalisches institut pots-dam (AIP), Germany. The images were obtained with the cam-era equipped with a SITe 1024× 1024 pixel CCD detector and reduced in a standard way withMIDAS. Point spread func-tion (PSF) photometry was done with a Perl Data Language pipeline based on the DoPhot package (Mateo & Schechter 1989). The differential magnitudes of HS 0218 were derived relative to the comparison star labelled “C1” in Fig. 1, and were converted into apparent R-band magnitudes using the USNO–A2.0 mag of the comparison star,RC1=13.74. The main
source of uncertainty in this conversion is the uncertainty in the USNO magnitudes, which is typically0.2 mag.
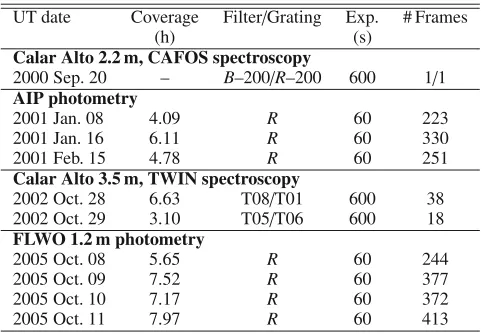
Table 1.Log of observations.
UT date Coverage Filter/Grating Exp. # Frames
(h) (s)
Calar Alto 2.2 m, CAFOS spectroscopy
2000 Sep. 20 – B–200/R–200 600 1/1
AIP photometry
2001 Jan. 08 4.09 R 60 223
2001 Jan. 16 6.11 R 60 330
2001 Feb. 15 4.78 R 60 251
Calar Alto 3.5 m, TWIN spectroscopy
2002 Oct. 28 6.63 T08/T01 600 38 2002 Oct. 29 3.10 T05/T06 600 18
FLWO 1.2 m photometry
2005 Oct. 08 5.65 R 60 244
2005 Oct. 09 7.52 R 60 377
2005 Oct. 10 7.17 R 60 372
2005 Oct. 11 7.97 R 60 413
Fred Lawrence Whipple Observatory. Further time-resolved
R-band photometry of HS 0218 was secured on 2005
October 8–11 using the 1.2 m telescope at the fred lawrence whipple observatory (FLWO) in Arizona. The images were ob-tained with the KEPLERCAM mosaic camera which consists of an array of four 2048×2048 pixel CCD detectors. Only a small window on CCD #4 was read out in order to minimise the dead time between images. Aperture photometry was performed on the reduced images usingIRAF1. An optimal aperture radius of 1.5 times the full-width at half-maximum (FW H M) of the typi-cal seeing profile was used (Naylor 1998). The light curves were computed in the same manner as described for the Potsdam data. A brief summary of the observations is given in Table1.
2.2. Optical spectroscopy
During an identification run of HQS CV candidates at the 2.2 m Calar Alto telescope on 2000 September 20, we obtained a pair of blue/red spectra of HS 0218 with the CAFOS spectro-graph (Table1). We used the B–200 and R–200 gratings in con-junction with a 2 slit, which provided a spectral resolution of 10 Å (FW H M). A standard reduction was performed using the CAFOSMIDASquicklook package. The detection of strong Balmer emission lines and absorption lines of a late-type star confirmed the CV nature of HS 0218 and encouraged us to make the follow-up observations described in what follows.
Time-resolved spectroscopy of HS 0218 was obtained with the double-armed TWIN spectrograph on the 3.5 m telescope in Calar Alto on 2002 October 28–29 (Table1). On the first night, a total of 38 blue and red spectra were acquired using the T08 and T01 gratings, respectively, and a 1.2slit. The wavelength rangesλλ3800–5560 andλλ5800–7390 were sampled at 2.2 and 1.6 Å resolution (FW H M), respectively. The gratings T05 and T06 and the same slit width were selected for the second night. This granted access to the rangesλλ3985–5050 and λλ5910– 6990 at 1.1 and 1.2 Å resolution (FW H M) in the blue and the red, respectively. Spectra of the G191–B2B flux standard were taken to derive the instrument response function. Both the identi-fication spectra and the spectra obtained on the first night showed a red continuum and absorption features originating in the
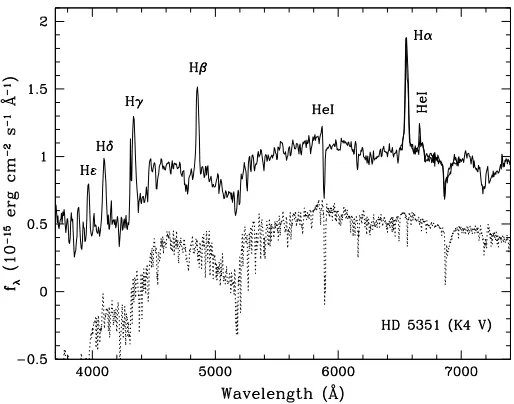
[image:3.595.320.561.97.264.2]Fig. 2.Discovery spectrum of HS 0218 obtained with the 2.2 m tele-scope at Calar Alto in September 2000 (solid line). The spectrum of a K4 V star (HD 5351) is shown as a dotted line, shifted down by 0.5 units for clarity. The template spectrum was extracted from the spectral cata-logue ofJacoby et al.(1984). The absorption-line spectrum of HS 0218 is characteristic of a mid-K star.
photosphere of a mid-K secondary star. Hence, we also took spectra of six K stars of different spectral sub-type during the second night. For wavelength calibration we acquired spectra of a HeAr lamp throughout each night.
Prior to optimal extraction of the individual spectra (Horne 1986), the raw images were bias-subtracted and flat-field cor-rected. Sky emission was removed during the optimal extrac-tion of the spectra. The pixel–wavelength data were well fitted by a fourth-order polynomial, with an rms always smaller than one tenth of the spectral dispersion in all cases. The wavelength scale for each spectrum was derived by interpolating between the two nearest arc spectra. The accuracy of our wavelength cal-ibration was improved by using the night-sky lines to correct for any zero-point offset.
The reduction steps and one-dimensional spectrum extrac-tion were performed withinIRAF, whilst the wavelength cali-bration was performed inMOLLY2.
3. Identification spectroscopy
One of the remarkable features of the identification spectrum of HS 0218 (Fig.2) is its red continuum, which reveals the domi-nance of the companion star. The absence of strong TiO absorp-tion bands suggests a spectral type earlier than M. In fact, the broad absorption observed at ∼5200 Å (produced by MgH at 5180 Å, a TiO band atλλ4954–5200, and a jump in the contin-uum due to the Mg
i
triplet atλλ5168–5185) constitutes a clear signature of a K-type star (McClintock & Remillard 1990, and references therein). In Sect.5.2we present a more accurate de-termination of the secondary star spectral type based on mea-surements of the rotational broadening of its absorption lines.2 Written by T. R. Marsh,
http://www.warwick.ac.uk/go/trmarsh
4. The orbital period of HS 0218
The R-band light curves of HS 0218 (Fig. 3) exhibit a clear quasi-sinusoidal modulation with variable minima. Deeper and shallower minima alternate in a periodic basis every∼3.5 h. This behaviour, together with an optical spectrum dominated by the donor star (Fig.2), make us identify this variation with a classi-cal ellipsoidal modulation resulting from the changing projected area of the Roche lobe with orbital phase. The deeper minima in the ellipsoidal light curve are caused by the stronger grav-ity darkening on the hemisphere facing the white dwarf, so they must occur at orbital phase 0.5. Therefore, the actual orbital pe-riod of HS 0218 must be twice the separation between consecu-tive minima, which is confirmed by the radial velocity curve of the donor star (Sect.5.1).
As the photometry spans much longer than the spectroscopy, the analysis of the light curves provided a more accurate orbital period determination. The analysis-of-variance (AOV,
Schwarzenberg-Czerny 1989) periodogram computed from our light curves is presented in Fig.4. The highest peak is centred at
ν6.73 d−1(3.57 h), whilst the second highest lies exactly at
half that frequency (Ω 3.36 d−1;P
orb 7.13 h), which is the
actual orbital frequency.
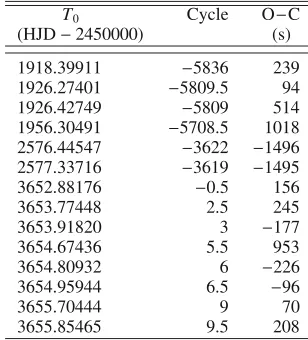
In order to improve the accuracy of the orbital period we calculated a linear ephemeris from the times of all available photometric minima derived from Gaussian fits. Additionally, two measurements of the instant of zero phase (i.e. inferior cojunction of the secondary star, T0) were obtained from sine
fits to the secondary star’s radial velocity curves presented in Sect.5.1, which were also included in the calculations. The mea-surements of the times of phase 0 (and also 0.5 for the ellip-soidal light curves) are presented in Table2. The resulting orbital ephemeris is:
T0(HJD)=2 453 653.028599(3)+0.297229661(1)×E, (1)
where the numbers in parentheses quote the uncertainty in the last digit.
Figure4also shows all theR-band data folded on the orbital period using the ephemeris given in Eq. (1). The ellipsoidal mod-ulation is apparent. The shape of the folded light curves, how-ever, shows significant deviations between the AIP and FLWO data. The 2001 January 8 light curve clearly displays the phase-0.5 minimum and phase-0.75 maximum shifted by∼–0.05 cycle with respect to the FLWO light curve. This cannot be the ef-fect of an inaccurate orbital period determination as the phase-0 minima and phase 0.75–0 branches match very well in both sets of data. In addition, the 2001 January 16 AIP light curve ex-hibits a broader phase-0 minimum, with the phase 0–0.25 rising branch lagging that of the FLWO and almost equal primary and secondary minima. This behaviour indicates that the ellipsoidal modulation is actually contaminated by other sources of varia-tion, likely originating in the accretion disc and/or the donor star itself (e.g. irradiation).
On the other hand, theR-band light curves of HS 0218 also display higher frequency activity (see e.g. the 2005 October 10 light curve in Fig.3). To analyse these variations we first sub-tracted the ellipsoidal modulation (by means of a smoothed, Fourier series-fitted version of the curves) and then computed an AOV periodogram from all the detrended light curves. The combined power spectrum does not show any predominant fre-quency. However, the periodogram computed from the 2005 October 9 data alone (not shown) exhibits a prominent peak at
ν 37.4 d−1, which corresponds to a period ofP 38.9 mn
808 P. Rodríguez-Gil et al.: An evolved donor star in HS 0218+3229
Fig. 3.R-band light curves of HS 0218+3229 obtained at the AIP (left) and the FLWO (right).
Fig. 4.Top main panel: analysis-of-variance (AOV) periodogram com-puted from the R-band photometric data (Fig. 3). The periodogram shownon topwas constructed from a fake sine wave with a frequency of 2Ωsampled at the actual data points. The structure of both peri-odograms are nearly the same.Bottom panel: theR-band photometric data folded according to the ephemeris given in Eq. (1). The solid line is the best ellipsoidal fit to the curve (see Sect.6). No phase binning has been applied. A whole orbit has been duplicated for clarity.
[image:5.595.47.303.357.597.2]periodograms calculated from the other individual light curves (with the exception of 2005 October 8) exhibit their strongest peaks at close but lower frequencies. This might suggest the presence of quasi-periodic oscillations in HS 0218, but a much more longer light curve coverage would be needed to draw any firm conclusions.
Table 2.Timings of phase 0 and 0.5 (light curves only).
T0 Cycle O−C
(HJD−2450000) (s)
1918.39911 −5836 239
1926.27401 −5809.5 94
1926.42749 −5809 514
1956.30491 −5708.5 1018 2576.44547 −3622 −1496 2577.33716 −3619 −1495
3652.88176 −0.5 156
3653.77448 2.5 245
3653.91820 3 −177
3654.67436 5.5 953
3654.80932 6 −226
3654.95944 6.5 −96
3655.70444 9 70
3655.85465 9.5 208
5. Time-resolved spectroscopy
5.1. The radial velocity amplitude of the donor star
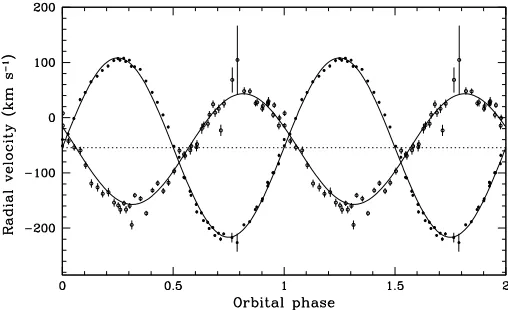
[image:5.595.362.516.375.545.2]Fig. 5.Radial velocity curves of the secondary star (solid dots) and the Hαline wings (open circles) in HS 0218. The radial velocities of the donor star were extracted by cross-correlation with a K5 V template star. Solid curves are the best sine fits to the radial velocities. The horizontal dashed line marksγ2=−54.2 km s−1. The orbital cycle has been plotted twice.
A first look at the velocities indicates a period of 0.3 d, which confirms the ellipsoidal nature of theR-band light curves (Sect.4). We therefore performed least-squares sine fits to the ra-dial velocity data with the period fixed at the photometric orbital period. The resulting fit parameters are summarised in Table3. Although all the values are very similar, we adopt the K5 V pa-rameters of the radial velocity curve since the spectral type of the donor star is shown to be most likely K5 (see Sect.5.2): K2 = 162.4±1.4 km s−1
γ2 = −54.2±2.9 km s−1.
All quoted uncertainties are 1-σ. The phase-folded radial veloc-ity curve is shown in Fig.5.
5.2. Spectral type and rotational broadening
To determine the spectral type of the donor star and the rotational broadening of its absorption lines, we used the technique out-lined inMarsh et al.(1994). It is based on the search for the low-est residual obtained when subtracting a set of templates from the Doppler-corrected, average spectrum of the target.
We proceeded as follows: we used the spectra acquired dur-ing the second night, as both target and template spectra were acquired with the same instrumental setup. This is essential to derive a reliable value for the rotational broadening (vsini), in particular whenvsiniis of the same order as the instrumental resolution. First, the 18 target spectra were Doppler-corrected to the rest frame of the donor star by using the radial veloc-ity parameters derived in Sect.5.1. Next, we produced an av-erage spectrum after assigning different weights to the individ-ual spectra to maximise the signal-to-noise ratio of the sum. The template spectra were broadened from 70 to 110 km s−1in steps of 1.0 km s−1 through convolution with the spherical rotational
profile of Gray (1992) with a linearised limb-darkening coef-ficient of 0.5. Each broadened version of a template spectrum was scaled by a factorf (representing the fractional contribution of light from the secondary star) and subtracted from the target Doppler-corrected average. Then aχ2test on the residuals was
performed in the rangeλλ6090–6520 and the optimal values off andvsiniwere provided by minimisingχ2.
Besides the instrumental broadening, the secondary star’s photospheric lines are also smeared due to the orbital motion of
the donor star during the length of the exposure. With 600-s ex-posures, the orbital smearing is≤texp2PπK2 =24 km s−1. This ef-fect can be corrected producing a spectral template by averaging 18 smeared copies of a template spectrum with the same weights as used to average the spectra of the target. We performed this correction, finding no significant difference in the values calcu-lated for the rotational broadening.
The minimisation of χ2
ν (Table 4) shows that the spectral
type of the secondary star in HS 0218 is later than K1. Also, a K0-1 V donor star is rejected as the templates give f > 1. Similar results for the spectral classification were obtained when repeating the above procedure on the 38 target spectra acquired during the first night. Additional constraints on the spectral type of the donor star are provided by the infrared colours of HS 0218 after correcting for reddening and assuming the same fdisc at each infrared bandpass. Using 2MASS magnitudes we
derive (J−H,H−K, J−K)0 = (0.63,0.09,0.72) based on
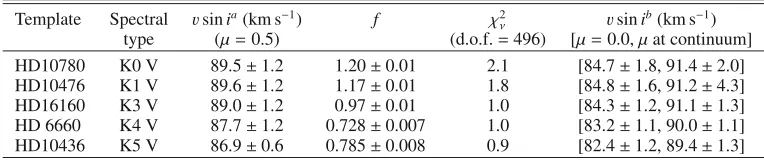
E(B−V)=0.071 mag (Schlegel et al. 1998). The uncertainties in the infrared colours are 0.04 mag. The above colours reject an M-type dwarf (J−K >0.86,H−K > 0.165) and support a K4–K5 dwarf (see e.g.Bessell & Brett 1988). For compari-son, a K5 dwarf has colours of (0.61,0.11,0.72). Further visual inspection of the average spectra and templates supports a K5 spectral type based on the strength of the weak TiO bands in the spectrum and by comparing the relative intensities of the ab-sorption lines in the intervalλλ6400–6530. Hereafter, in accor-dance with the above analysis, we adopt a K5 spectral type for the donor star.
A rotational broadening measurement of 86.9±0.6 km s−1
was obtained from the K5 V template. However, the value of the limb-darkening coefficient for the absorption lines is unknown and this limits our ability in evaluatingvsini. Limb-darkening coefficients for the absoption lines in late-type stars are expected to be smaller than those for the continuum (Collins & Truax 1995). Therefore, we repeated the above analysis for both a null linearised limb-darkening coefficient and for the value ex-pected for the continuum. The latter was selected for each tem-plate fromClaret et al.(1995). We provide the results for each template in Table 3 (Col. 6). As one can see, our uncertainty in the limb-darkening leads to values ofvsiniof 82.4–89.4 km s−1
(K5 V template).
5.3. The radial velocity amplitude of the white dwarf
We measured the radial velocity curve of the Hα line wings by using the double-Gaussian technique ofSchneider & Young
(1980). In an ideal world, with an axisymmetric accretion disc dominating line emission, the line wings would provide a good estimate ofK1. We obtained radial velocity curves of the
Hαwings for a number of Gaussian (FW H M = 200 km s−1)
separations between 600 and 2900 km s−1 in 100 km s−1 steps.
The curve for a 1300 km s−1separation gave the best results and
is shown in Fig.5. The wings are clearly delayed by∼0.1 cy-cle, but theirγ-velocity of−57.6±0.8 km s−1 (derived from a
sine fit) is very similar to that of the donor star (γ2 =−54.2 ±
1.4 km s−1). The sine fit gives an amplitude of the wings radial
velocity curve of 100.3±1.2 km s−1, which provides a mass ra-tio ofq = K1/K2 = 0.618±0.009 if assumed to be the radial
velocity amplitude of the white dwarf. This mass ratio is equal to the measured from the rotational broadening of the donor star absorption lines. Despite the phase shift that the Hαradial veloc-ities show (Fig.5), the measuredK1 value seems to be reliable
810 P. Rodríguez-Gil et al.: An evolved donor star in HS 0218+3229
Table 3.Radial velocity parameters (errors at 1σ).
Template Spectral γ γa
2 K2 T0 χ
2 ν type (km s−1) (km s−1) (km s−1) (HJD−2452576) (d.o.f.=53) HD 10780 K0 V −56.2±1.1 −53.5±1.2 161.6±1.5 0.4457±5×10⁻⁴ 9.1 HR 10476 K1 V −20.9±1.1 −54.7±1.1 161.7±1.5 0.4455±5×10⁻⁴ 9.4 HR 16160 K3 V −76.4±1.0 −50.7±1.2 162.3±1.4 0.4457±4×10⁻⁴ 10.1
HD 6660 K4 V −59.7±1.0 −54.9±1.6 162.2±1.4 0.4456±4×10⁻⁴ 13.5 HD 10436 K5 V −2.8±1.0 −54.2±2.9 162.4±1.4 0.4457±4×10⁻⁴ 11.9
aγ
2: Systemic velocity after adding the radial velocity of the template star as found in Gontcharov (2006).
Table 4.Spectral classification and rotational broadening.
Template Spectral vsinia(km s−1) f χ2
ν vsinib(km s−1) type (μ=0.5) (d.o.f.=496) [μ=0.0,μat continuum] HD10780 K0 V 89.5±1.2 1.20±0.01 2.1 [84.7±1.8, 91.4±2.0] HD10476 K1 V 89.6±1.2 1.17±0.01 1.8 [84.8±1.6, 91.2±4.3] HD16160 K3 V 89.0±1.2 0.97±0.01 1.0 [84.3±1.2, 91.1±1.3] HD 6660 K4 V 87.7±1.2 0.728±0.007 1.0 [83.2±1.1, 90.0±1.1] HD10436 K5 V 86.9±0.6 0.785±0.008 0.9 [82.4±1.2, 89.4±1.3]
aUncertainties are 1-σcorresponding toχ2
min+1 (Lampton et al. 1976);
buncertainties are 1-σand were estimated using the Monte-Carlo method
by simulating a total of 1 000 000 copies of our target spectrum using the bootstrap technique outlined inSteeghs & Jonker(2007).
6. Ellipsoidal light curve modelling
To model the ellipsoidal variation we used a binary code which uses full Roche geometry and a black body model to account for the emission of the distorted companion. In order to carry out the numerical integration the donor star surface is divided in small triangular tiles of equal area which cover completely the Roche-lobe filling star. In this model, the disc contribution to the total light (fdisc = 1− f) is independent of the orbital phase and is
scaled to a certain factor of the mean flux from the companion. The limb darkening coefficients are obtained from Al-Naimiy
(1978) and the β gravity darkening exponent is fixed at 0.08 (Lucy 1967). According toGray(1992) the effective temperature of a K5 V star is 4557 K, which was adopted as the polar tem-perature. The synthetic ellipsoidal modulation should only de-pend on the orbital inclination angle, the mass ratio (q=M2/M1,
whereM2andM1are the masses of the donor star and the
com-pact object, respectively), and the relative disc contribution to the light curve (1−f). In Sect.5.2we obtained 1−f ∼0.22 by measuring the absorption lines in the rangeλλ6090–6520. This spectral region is contained in theRband and we can therefore use this value in our fits. However, we think that the contamina-tion in the shape of the light curve may be due to night-to-night variations of the disc contribution (see Sect.4). Hence, the value obtained during the spectroscopic campaign may not be the cor-rect one for the photometric data.
In order to establish a conservative lower limit to the incli-nation angle (i) of the system we have fitted the light curve by using 1−f =0, obtainingi≥50◦. Since the light curves do not show eclipses we find an upper limit ofi ≤ 62◦ from elemen-tal trigonometry involving the maximum disc radius allowed by tidal interaction with the donor star (Paczy´nski 1977) and the Roche lobe radius of the latter. Thus, we obtain 50◦ ≤i ≤62◦ independently of fdisc. The best fit to the ellipsoidal light curve
was finally found for fdisc = 0.15,q = 0.62, andi = 59±3◦.
We have overplotted this synthetic model to the actual folded ellipsoidal curve in Fig.4.
7. Discussion
7.1. Parameter estimates
Assuming that the companion star is synchronised with the bi-nary motion and fills its Roche lobe, it is possible to calculate the mass ratio through the expressionvsini=0.462K2q1/3(1+q)2/3
(e.g. Wade & Horne 1988). Thus we derive 0.52 < q < 0.65 fromK2 = 162.4±1.4 km s−1 and the 99% confidence range
for the rotational broadening (82.4–2.33σkm s−1 < vsini <
89.4+2.33σkm s−1). This mass-ratio range implies a primary velocity amplitude of 84 km s−1<K
1 =qK2<106 km s−1. The
value of 100.3±1.2 km s−1 measured from the Hαline wings lies almost in the middle of this interval.
The velocity amplitude and orbital period imply a mass func-tion of f(M1)=PK23/2πG=0.132±0.001M=M1sin3i/(1+
q)2. Combining the values forf(M
1) and our extreme limits onq
andi, we constrain the masses of the compact object and the companion star to be in the range: 0.44 < M1 < 0.65 Mand
0.23 < M2 < 0.44 M. Table5 gives the determined system
parameters for the extreme values of the inclination given by the ellipsoidal modelling. The uncertainties in the masses for a given inclination are dominated by the uncertainty in the value of
vsini. For comparison, using the resulting value obtained for a limb-darkening coefficient of 0.5 (vsini = 86.9±0.6 km s−1),
we derive: q = 0.61±0.01, M1 = 0.54±0.03 M, M2 =
0.33±0.02MandK1=99±1 km s−1. To determine the above
1-σuncertainties a Monte Carlo approach was used in which we draw one million random values for the observed quantities. We treatedK2 andvsini as being normally distributed about their
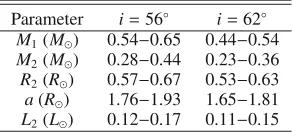
measured values with standard deviations equal to the uncer-tainties on the measurements. For ithe distribution was taken to be uniform. Given the stellar masses and orbital period, we can constrain the semi-major axis (a) of the orbit using Kepler’s Third Law, the radius of the secondary star (R2) using Eggleton’s
[image:7.595.116.498.239.319.2]Table 5.Summary of derived system parameters.
Parameter i=56◦ i=62◦ M1(M) 0.54−0.65 0.44−0.54 M2(M) 0.28−0.44 0.23−0.36 R2(R) 0.57−0.67 0.53−0.63 a(R) 1.76−1.93 1.65−1.81 L2(L) 0.12−0.17 0.11−0.15
Stefan-Boltzmann’s Law and the 4557 K effective temperature inferred from the spectral type (Gray 1992). These quantities are listed in Table5.
To constrain the distance to HS 0218 we have adopted the luminosity of the donor star given in Table 5, which, com-bined with the bolometric correction and the (V −R) colour of a K5 V star, yield an absolute magnitude of MR = 5.96– 5.65. We have calculated a dereddened magnitude of the sec-ondary star ofR=15.65–15.72 using the apparent magnitude of HS 0218 (R =15.6),AR =0.188 and a∼15–20% veiling from the accretion disc (Sect.6). Therefore, the distance modulus re-lation provides a distance to HS 0218 of 0.87–1.0 kpc. Note that this distance estimate must be considered as approximate given the uncertainties in our photometric calibration based on USNO A2.0 mag of field stars.
7.2. An evolved donor star
As we have demonstrated, the companion star in HS 0218 is most likely of spectral type K5. A main-sequence K5 star has a nominal mass of 0.68M(Gray 1992). The disagreement with the mass constraints obtained above is easily explained if the secondary star is undermassive for its spectral type, that is, has undergone nuclear evolutionbeforethe onset of mass transfer. In fact, with a mass of∼0.33 Mits nuclear timescale is much greater than the Hubble time. Previous work on donor stars in long-period CVs (see e.g. Fig. 5 inBeuermann et al. 1998) shows that most of them at long orbital periods are underluminous, and likely evolved. In Fig.6we plot evolutionary sequences for an initial donor star mass of 1.0Mand mass transfer onset at sev-eral central hydrogen abundances (Baraffe & Kolb 2000). Note that this is only for illustrative purposes and the actual initial donor mass in HS 0218 can be different. The mass of the donor star in HS 0218 is much lower than predicted by any of the se-quences considered.
Schenker & King(2002) show the evolution of the donor mean density as a function of its mass (their Fig. 2) for both the ZAMS and evolved cases. With an orbital period of 7.13 h, HS 0218 has a mean density of 2.1 g cm−3, which results in a
donor mass of∼0.3Mfor the case of strong thermal-timescale mass transfer. Moreover, according to Schenker et al. (2002) (their Fig. 6), a donor star of spectral type K5–K7 is expected for a mass of∼0.3M. Both predictions for the case of an evolved donor agree well with our measurements.
The binary system, therefore, formed with a companion star more massive than the white dwarf. In this scenario (q = M2/M1>1), and as a consequence of mass transfer towards the
[image:8.595.82.228.99.166.2]white dwarf, the Roche lobe of the donor star (initially the most massive component) shrinks faster than the thermal equilibrium radius. The secondary star thus tends to expand beyond the Roche lobe to reach the thermal equilibrium radius, which trig-gers an episode of thermal-timescale mass transfer until the mass ratio reverses (see e.g.King et al. 2001;Schenker et al. 2002).
Fig. 6. Spectral type, mass, and radius as a function of orbital pe-riod for four different evolutionary sequences with different initial cen-tral hydrogen abundance (Xc) at the onset of mass transfer. The ini-tial donor mass is M2 = 1.0Mand the mass transfer rate is ˙M = 1.5×10⁻⁹ M
yr−1. Solid line:Xc =0.7 (initially unevolved donor); dotted line: Xc = 0.55; dashed line: Xc = 0.16; long-dashed line: Xc = 0.05. The location of HS 0218 is indicated by the large black dot. Evolutionary sequences adapted fromBaraffe & Kolb(2000).
Beyond this point, normal mass transfer starts due to either an-gular momentum loss (i.e. secondary Roche lobe shrinkage) of nuclear evolution of the donor star (i.e. increase of the thermal equilibrium radius) and the system becomes a normal CV. The fact that the measured white dwarf mass (M1 ∼ 0.54 M) is
lower than the average value for CVs (Smith & Dhillon 1998) indicates that the transferred donor material during the thermal-timescale stage has been blown offthe binary system.
Nuclear evolution of the donor star prior to normal CV life should reflect in the chemical composition of the accreted mate-rial. Because of CNO processing of the material, carbon must be significantly depleted and nitrogen subsequently enriched. Unusually low C
iv
/Nv
ultraviolet line flux ratios have been ob-served in a number of CVs (Gänsicke et al. 2003), suggesting that a significant fraction of the present-day CV population is descendant from systems that have passed through a thermal-timescale mass transfer phase. HS 0218 is therefore a promising target for ultraviolet spectroscopy to check whether N enrich-ment has taken place.Acknowledgements. This work was supported by XMM-Newton Grant NNG05GJ22G. The HQS was supported by the Deutsche Forschungsgemeinschaft through grants Re 353/11 and Re 353/22. The use of the MOLLY package developed and maintained by Tom Marsh is acknowledged. Thanks to the anonymous referee for valuable input.
References
Al-Naimiy, H. M. 1978, Ap&SS, 53, 181
Araujo-Betancor, S., Gänsicke, B. T., Hagen, H.-J., Rodríguez-Gil, P., & Engels, D. 2003, A&A, 406, 213
Aungwerojwit, A., Gänsicke, B. T., Rodríguez-Gil, P., et al. 2005, A&A, 443, 995
Aungwerojwit, A., Gänsicke, B. T., Rodríguez-Gil, P., et al. 2006, A&A, 455, 659
Aungwerojwit, A., Gänsicke, B. T., Rodríguez-Gil, P., et al. 2007, A&A, 469, 297
812 P. Rodríguez-Gil et al.: An evolved donor star in HS 0218+3229
Beuermann, K., Baraffe, I., Kolb, U., & Weichhold, M. 1998, A&A, 339, 518 Claret, A., Diaz-Cordoves, J., & Gimenez, A. 1995, A&AS, 114, 247 Eggleton, P. P. 1983, ApJ, 268, 368
Gänsicke, B. T., Fried, R. E., Hagen, H.-J., et al. 2000, A&A, 356, L79 Gänsicke, B. T., Beuermann, K., & Reinsch, K., ed. 2002a, The Physics of
Cataclysmic Variables and Related Objects, ASP Conf. Ser., 261
Gänsicke, B. T., Hagen, H. J., & Engels, D. 2002b, in The Physics of Cataclysmic Variables and Related Objects, ed. B. T. Gänsicke, K. Beuermann, & K. Reinsch, ASP Conf. Ser., 261, 190
Gänsicke, B. T., Szkody, P., de Martino, D., et al. 2003, ApJ, 594, 443 Gänsicke, B. T., Jordan, S., Beuermann, K., et al. 2004, ApJ, 613, L141 Gray, D. F. 1992, The Observation and Analysis of Stellar Photospheres
(Cambridge University Press) Horne, K. 1986, PASP, 98, 609
Jacoby, G. H., Hunter, D. A., & Christian, C. A. 1984, ApJS, 56, 257 King, A. R., Schenker, K., Kolb, U., & Davies, M. B. 2001, MNRAS, 321, 327 Lucy, L. B. 1967, Zeitschrift fur Astrophysik, 65, 89
Marsh, T. R., Robinson, E. L., & Wood, J. H. 1994, MNRAS, 266, 137 Mateo, M., & Schechter, P. L. 1989, in European Southern Observatory
Astrophysics Symposia, ed. P. J. Grosbøl, F. Murtagh, & R. H. Warmels, 31, 69
McClintock, J. E., & Remillard, R. A. 1990, ApJ, 350, 386
Mennickent, R. E., Tovmassian, G., Zharikov, S. V., et al. 2002, A&A, 383, 933 Naylor, T. 1998, MNRAS, 296, 339
Paczy´nski, B. 1977, ApJ, 216, 822
Rodríguez-Gil, P., Gänsicke, B. T., Barwig, H., Hagen, H.-J., & Engels, D. 2004, A&A, 424, 647
Rodríguez-Gil, P., Gänsicke, B. T., Hagen, H.-J., et al. 2005, A&A, 440, 701 Rodríguez-Gil, P., Gänsicke, B. T., Hagen, H.-J., et al. 2007, MNRAS, 377, 1747 Schenker, K., & King, A. R. 2002, in The Physics of Cataclysmic Variables and Related Objects, ed. B. T. Gänsicke, K. Beuermann, & K. Reinsch, ASP Conf. Ser., 261, 242
Schenker, K., King, A. R., Kolb, U., Wynn, G. A., & Zhang, Z. 2002, MNRAS, 337, 1105
Schlegel, D. J., Finkbeiner, D. P., & Davis, M. 1998, ApJ, 500, 525 Schneider, D. P., & Young, P. 1980, ApJ, 238, 946
Schwarzenberg-Czerny, A. 1989, MNRAS, 241, 153
Shafter, A. W., Veal, J. M., & Robinson, E. L. 1995, ApJ, 440, 853 Smith, D. A., & Dhillon, V. S. 1998, MNRAS, 301, 767
Steeghs, D., & Jonker, P. G. 2007, ApJL, 669, L85
Szkody, P., Gänsicke, B., Fried, R. E., Heber, U., & Erb, D. K. 2001, PASP, 113, 1215