ISSN Print: 2473-1889
DOI: 10.4236/ojogas.2019.41004 Jan. 30, 2019 43 Open Journal of Yangtze Gas and Oil
Study on Parameters Selection of Oil-Based
Mud Formation Imaging Tool (OBIT)
Based on FEM
Yue Liu
Wireline Logging R & D Center, Logging Company Limited, CNPC, Beijing, China
Abstract
In a typical oil-based mud environment, the borehole fluid and mud cake are highly resistive and will not permit any significant current flow from the tool to the formation. In order to overcome the high insulation effect of the me-dium, measurement current must be injected at a relative high frequency since most of the conduction is due to capacitive coupling. In this paper, an OBIT numerical model based on four-terminal method was established to study the tool responses during the measurements. The influences of tool pa-rameters, such as the area and distance of current-injector electrodes, inject frequency, distance of button sensors, standoff and electrical properties of borehole fluid, the tool responses, were investigated and the tool optimization was discussed.
Keywords
Oil Based Mud, Image Logging, Capacitive Coupling, Four-Terminal Method
1. Introduction
High resolution image logging technologies are well-known among geologists and engineers because the sufficiently detailed images can provide useful struc-tural and stratigraphic information in many geological settings [1] [2] [3]. Mi-cro-resistivity imager, part of image logging technologies, has been widely used in water based mud well logging [4] [5] since it was commercialized in 1980s and rapidly developed in 1990s. Oil-based or nonconductive synthetic based muds are widely applied as more and more special and deep-water reservoirs are ex-plored [6] [7] [8]. Compared with conventional water based mud, oil based mud can enhance the stability of borehole, reduce drilling risk, and increase efficiency How to cite this paper: Liu, Y. (2019)
Study on Parameters Selection of Oil-Based Mud Formation Imaging Tool (OBIT) Based on FEM. Open Journal of Yangtze Gas and Oil, 4, 43-58.
https://doi.org/10.4236/ojogas.2019.41004
Received: March 7, 2018 Accepted: January 27, 2019 Published: January 30, 2019
Copyright © 2019 by author and Scientific Research Publishing Inc. This work is licensed under the Creative Commons Attribution International License (CC BY 4.0).
DOI: 10.4236/ojogas.2019.41004 44 Open Journal of Yangtze Gas and Oil
of drilling. However, the nonconductive environment presented by the oil based mud constitutes a major challenge to conventional micro-resistivity imagers based on micro-laterolog principles, such as FMI, XRMI and Star [9], which de-pends on current flow from a source to a return electrode with relatively large spacing. Many oilfield service companies have studied and developed their own tools for oil based mud well logging consecutively since 2000s [10] [11] [12] [13] [14]. Schlumberger and Halliburton designed their tool based on four-terminal method. A relative high frequency alternating current was injected into the for-mation through capacitive coupling between two current-injector electrodes. The potential difference, measured by a pair of sensors set in the middle of injector electrodes, contains formation information. Formation resistivity can be ob-tained by calculation. Baker applied capacitive coupling method. The measure-ment principle is similar to the micro-resistivity imagers. Relatively high alterna-tive displacement currents flow from a source to a return electrode with forma-tion. Schlumberger has developed a new generation Oil based mud imager NGI [15]. The resolution of images obtained by has been significantly improved; however, the measurement depth is relatively shallow, 0.2 in, as the measurement is performed entirely on the tool pad. Baker Hughes also improved their tool based on the first generation imaging tool [16]. No matter what kind of methods they used, the displacement current is generated in the formation through capa-citive coupling; thus the current injects into the formation. With measuring for-mation related parameters, such as potential difference or current, we can obtain formation resistivity. In this paper, the four-terminal method is chosen to design the tool OBIT and a finite-element four-terminal model is established to study influences of parameters on tool responses.
2. Numerical Modeling
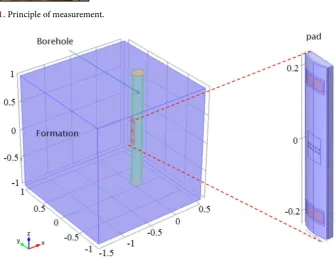
The principle of measurement is based on the four-terminal method. The sche-matic in Figure 1 shows a pad applied against the borehole wall with possibly a small standoff. A relative high frequency alternating current, I, is injected into the formation between two current-injector electrodes A and B located above and below five pairs of small button sensors. The potential difference δV is measured between the button sensors C and D. As we have known I and δV, we can calculate the resistivity of the formation between C and D.
Finite element method has been used in modeling and simulation for many decades due to its capabilities of adapting complicated geometry. Therefore, 3D finite-element models of the OBIT have been developed and used for tool prop-erties analysis.
DOI: 10.4236/ojogas.2019.41004 45 Open Journal of Yangtze Gas and Oil Figure 1. Principle of measurement.
Figure 2. 3D OBIT model.
DOI: 10.4236/ojogas.2019.41004 46 Open Journal of Yangtze Gas and Oil Table 1. Electrical properties of the OBIT model.
Material Resistivity (Ω·m) Relative permittivity/1
Formation 0.1 ~ 10,000 5.0
Oil-based mud 106 5.0
OBIT Pad 1016 3.2
Current pads and voltage electrodes 1.67 × 10⁻⁶ 1.0
[image:4.595.284.466.426.616.2]To obtain the right simulation results by using finite-element method, compu-tation domains have to be specified in which numerical simulations can be im-plemented. Setting correct boundary conditions are essential to get correct re-sults. In the model mentioned above, the following boundary conditions were applied: The exterior surface of the model was set as electric insulation. This boundary condition means that no electric current flows into the boundary. The current electrodes were set as current terminals in the OBIT model. The terminal boundary is assumed to be connected to an external circuit for providing the predefined current. The metal part of the pad body was set as ground. Ground means that there is a zero potential on the boundary.
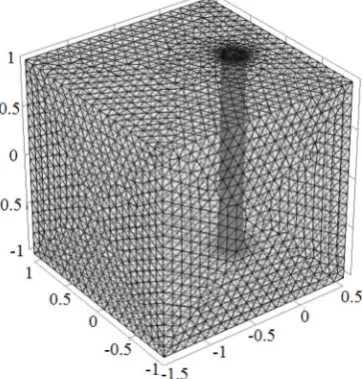
Figure 3 shows the mesh of the model. The mesh consists of 532,880 tetrahe-dral elements, 54,318 triangular elements, 3104 edge elements and 172 vertex elements. In order to increase the accuracy of simulation, the mesh of the OBIT pad and the borehole are much denser than that of the formation.
Figure 3. Mesh of the 3D model.
3. Simulation Results
1) Electric field distribution in the formation and borehole
DOI: 10.4236/ojogas.2019.41004 47 Open Journal of Yangtze Gas and Oil
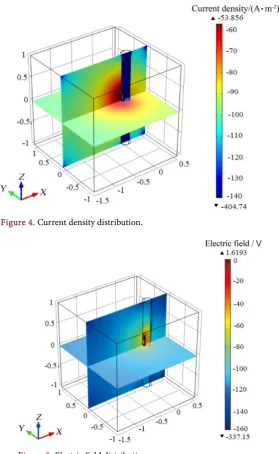
density (in logarithm scale) distribution on an x-y plane (z = 0) and a x-z plane (y = 0). The amplitude of current density has been color coded. Red color represents large current density. It can be seen that the current in the borehole is rather small except the area near the two current pads, which indicates that most of the current is able to penetrate the resistive oil based mud into the formation.
[image:5.595.233.513.211.666.2]Figure 5 shows the electric field distribution. In contrast to the current density, the electric field in the borehole is much larger than that in the formation. That is because of the higher resistivity of the oil-based mud in the borehole.
Figure 4. Current density distribution.
Figure 5. Electric field distribution.
2) Influence of current-inject and measurement button electrodes
DOI: 10.4236/ojogas.2019.41004 48 Open Journal of Yangtze Gas and Oil
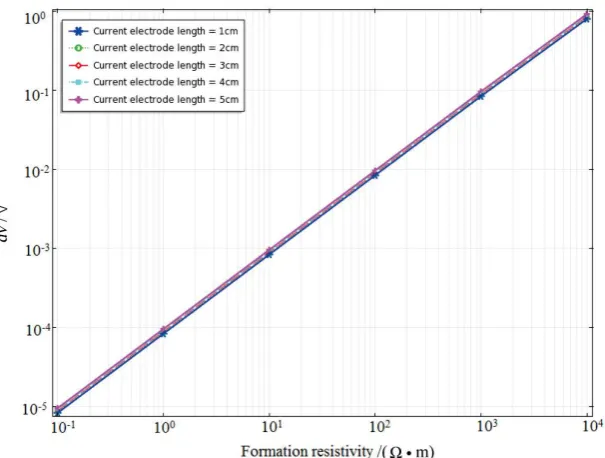
[image:6.595.223.526.214.443.2]between measurement buttons constant. Only the dimension of the current elec-trodes and the measurement button were changed. Figure 6 shows the voltage difference on measurement buttons dv versus formation resistivity for different current electrode lengths. In this model, the injecting current was kept as 1 mA and the frequency as 10 kHz. It can be seen from Figure 6 that the dv slightly decreases with the decrease of the current electrode length. However, the dv is not very sensitive to the current electrode length on the whole as long as a con-stant injecting current is kept on the electrodes. Figure 7 shows the dv versus
Figure 6. OBIT response (dv) versus formation resistivity for different current electrode
lengths.
Figure 7. OBIT response (dv) versus formation resistivity for different current electrode
[image:6.595.222.524.482.713.2]DOI: 10.4236/ojogas.2019.41004 49 Open Journal of Yangtze Gas and Oil
[image:7.595.217.531.212.443.2] [image:7.595.223.523.482.711.2]formation resistivity for different current electrode widths. It can be seen that the dv is not sensitive to the current electrode width as long as the injecting current is kept constant.
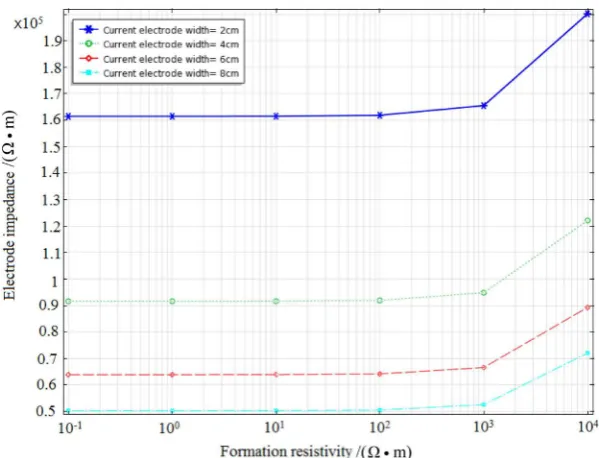
Figure 8 and Figure 9 show how the electrode impedance changes with cur-rent electrode dimension. Figure 8 shows the electrode impedance versus forma-tion resistivity for different electrode length and Figure 9 for different electrode widths. It can be seen that the electrode impedance increases significantly with the decrease of the electrode size. The higher the electrode impedance is, the
Figure 8. Electrode impedance versus formation resistivity for different current electrode lengths.
DOI: 10.4236/ojogas.2019.41004 50 Open Journal of Yangtze Gas and Oil
[image:8.595.211.537.201.444.2]higher the voltage on the current electrode,which is needed in order to keep a constant transmitting current.
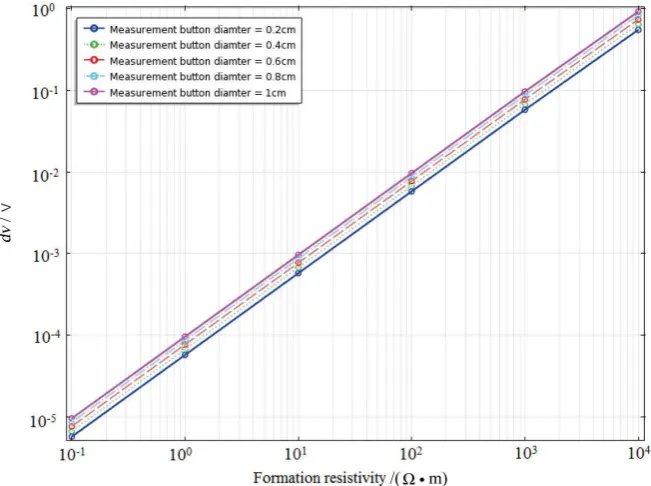
Figure 10 shows the dv versus formation resistivity for different measurement button sizes. It can be seen that the dv increase slightly with the increase of the measurement button diameter. It is because that the bigger the diameter of the measurement button is, the better the coupling between measurement buttons and formation is.
Figure 10. OBIT response dv versus formation resistivity for different measurement
but-ton diameters.
3) Effect of resistivity and dielectric constant of oil based mud
The high resistance oil-based mud prevents the current flow from the current pads to the formation. Therefore, it is important to investigate the effect of resis-tivity and dialectical constant of the oil based mud on the OBIT response. The resistivity of oil based mud was set to be 104, 105, 106 and 107 ohm·m respectively;
The other material properties remain the same values in Table 1. Figure 11 shows the OBIT response versus formation resistivity for different oil based mud resistivities. It can be seen that when the mud resistivity is comparable with for-mation resistivity, the relationship between the OBIT response and the forfor-mation resistivity gets worse (see the blue curve in Figure 11). When the resistivity of mud is much larger than the formation resistivity, the OBIT response is not sen-sitive to the mud resistivity. That is because the impedance of oil based mud is mainly dominated by its capacitive impedance which is related to its dielectric constant instead of resistivity.
DOI: 10.4236/ojogas.2019.41004 51 Open Journal of Yangtze Gas and Oil
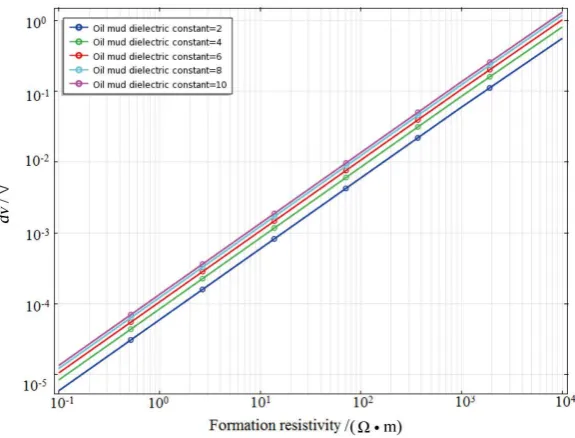
[image:9.595.113.541.167.401.2]remain the same values in Table 1. From Figure 12, it can be seen that the OBIT response increases with the increase of the dielectric constant of the mud. That is because the capacitive impedance between the current electrodes and the forma-tion surface decreases with the increase of the dielectric constant of the oil based mud.
Figure 11. OBIT response versus formation resistivity for different oil based mud resistivity.
Figure 12. OBIT response versus formation resistivity for different oil based mud dielectric constants.
[image:9.595.182.470.432.651.2]DOI: 10.4236/ojogas.2019.41004 52 Open Journal of Yangtze Gas and Oil
[image:10.595.122.539.166.405.2]was set to be 2, 4, 6, 8 and 10 mm respectively. It can be seen that the OBIT re-sponse decreases with the increase of the standoff distance. That is because the capacitive impedance between current electrodes and formation wall increases with the increase of the standoff distance. Accordingly, the current flow through the formation decreases and the current leakage inside the OBIT pad increases.
Figure 13. OBIT response versus formation resistivity for different standoff distance.
[image:10.595.218.531.493.723.2]5) Effect of the borehole diameter
Figure 14 shows the OBIT response varying with formation resistivity for dif-ferent borehole diameters. The borehole diameter was set to be 10, 20, 30, 40, 50
DOI: 10.4236/ojogas.2019.41004 53 Open Journal of Yangtze Gas and Oil
and 60 cm respectively. It can be seen that the OBIT response is not very sensi-tive to the borehole diameter. This is because that the OBIT pad is very close to the borehole wall and most of the transmitting current is injected into the forma-tion facing the OBIT pad.
6) Effect of injecting current frequency
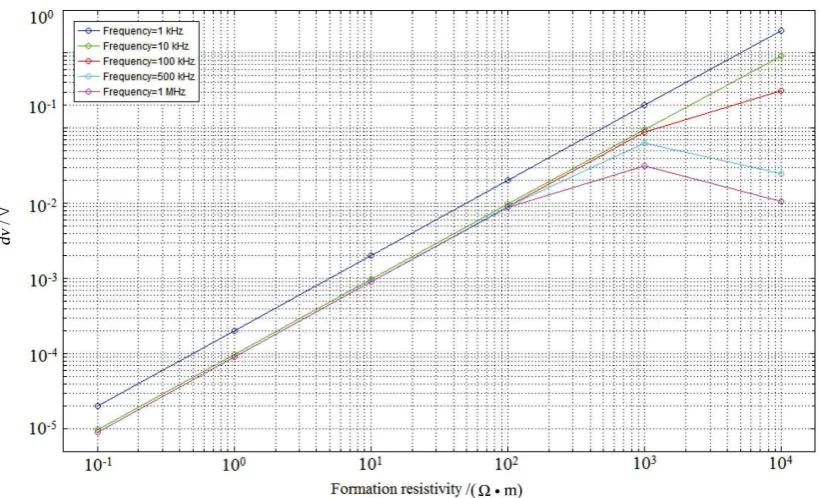
As mentioned previously, an alternating current with certain frequency has to be used in order to penetrate the highly resistive oil based mud. If the frequency is too low, then the impedance between electrodes and formation will be very high, and the received signal on measurement button will be accordingly small. If the frequency is too high, the impedance of the insulating part of the pad body will be significantly reduced and the received signal on the measurement buttons will be no longer linearly changed with the formation resistivity at high resistivity. Therefore, it is important to investigate the frequency effect on the OBIT re-sponse.
[image:11.595.129.540.376.625.2]The model geometry of Figure 2 and material properties in Table 1 are used, while the OBIT response dv versus formation resistivity at different frequencies is shown in Figure 15, assuming an injecting current of 1mA is used. It can be seen that the responses at 1 kHz and 10 kHz have good linearity. Therefore, the proper frequency for the OBIT should be within 1 kHz to 10 kHz.
Figure 15. OBIT response versus formation resistivity at different frequencies.
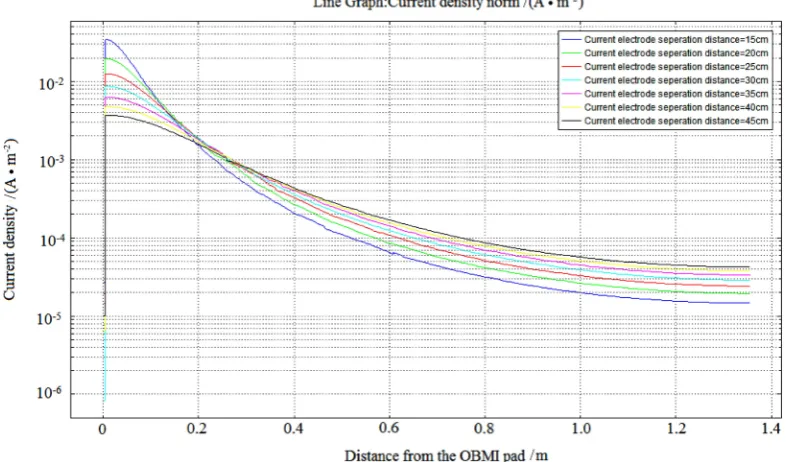
7) Current electrode separation distance vs. penetration depth
DOI: 10.4236/ojogas.2019.41004 54 Open Journal of Yangtze Gas and Oil
[image:12.595.260.487.171.392.2]factor 1/e. This definition is analogue to the definition of skin depth for electro-magnetic radiation. In order to investigate the penetration depth of the OBIT pad, the amplitude of current density along a red line (y = 0, z = 0) in Figure 16 has been studied for different pad geometries. The red line starts from the mid-dle of the OBIT pad and the other end is on the exterior boundary of the model.
Figure 16. Schematic of the relationship between pad geometry and penetration depth.
The relationship between the current electrode separation distance and the penetration depth has been investigated. Figure 17 shows the amplitude of cur-rent density along the red line in Figure 16 for different current electrode
[image:12.595.146.540.482.713.2]DOI: 10.4236/ojogas.2019.41004 55 Open Journal of Yangtze Gas and Oil
separation distances. The injecting current was kept as 1mA for all current elec-trode separation distances. The frequency was 10 kHz. The current elecelec-trode se-paration distances were set to be 15, 20, 25, 30, 35, 40 and 45 cm respectively. The material properties used the values in Table 1. It can be seen from Figure 17 that the current density on the formation wall has the highest value for the smal-lest current electrode separation distance (i.e. 15 cm), but decays the fastest. For the largest current electrode separation distance (i.e. 45 cm), the amplitude of the current density on the formation wall has the smallest value, but decays the slowest.
Based on the definition of the penetration depth above, the penetration depths for all current electrode separation distances are calculated and listed in Table 2. From both Figure 17 and Table 2, we can see that the larger the current elec-trode separation distance is, the larger the penetration depth is.
Table 2. Penetration depth for different current electrode separation distance.
Current electrode separation distance/m Penetration depth/m
0.15 0.0745
0.20 0.0983
0.25 0.1237
0.30 0.1483
0.35 0.1721
0.40 0.1955
0.45 0.2207
8) Formation resistivity versus OBIT detection depth
Figure 18 shows the amplitude of current density along the red line in Figure 16 for different formation resistivities. It can be seen that the current density
DOI: 10.4236/ojogas.2019.41004 56 Open Journal of Yangtze Gas and Oil
distribution in the formation has little relevance to the formation resistivity as long as a constant current source was kept on the current electrodes (e.g. 1 mA in our model). Therefore, the penetration depth is not sensitive to the formation resistivity.
9) Mud electrical properties versus OBIT detection depth
[image:14.595.206.540.354.530.2]Figure 19 shows the amplitude of the current density along the red line in Figure 16 for different dielectric constants (2, 4, 6, 8, 10) of oil based mud. It can be seen that the amplitude of the current density is bigger for larger dielectric constant than for smaller dielectric constant. That is because large dielectric con-stant indicates smaller impedance of the oil based mud, and accordingly the amount of current injected into the formation is bigger. However, the decay rates of all curves are very close even though the current densities on the formation wall are different. Since the penetration depth is defined as the decay rate of the current density, the penetration depths for all dielectric constant of the oil based mud are similar. It is worth pointing out that the conclusion that the penetration depth is not sensitive to the formation resistivity and the borehole electrical property is based on the precondition that the injecting current is kept constant.
Figure 19. Amplitude of the current density along the red line in Figure 16 for different dielectric constants of oil based mud.
4. Conclusions
The four-terminal method was chosen as the measurement principle to design the tool OBIT. A finite-element four-terminal 3-D numerical model was estab-lished to study influences of parameters to tool responses. Based on 3-D model, we had quantitatively and qualitatively studied the electric field distribution in the formation and borehole. The influences of tool parameters, such as the area and distance of current-injector electrodes, inject frequency, distance of button sensors, pad standoff and electrical properties of borehole fluid, the tool res-ponses, were simulated and discussed. The 3-D modeling and simulation results have supplied valuable supports for OBIT design and optimization. In summary:
DOI: 10.4236/ojogas.2019.41004 57 Open Journal of Yangtze Gas and Oil
the dimension of current electrodes (length and width) as long as the transmit-ting current is kept constant. The electrode impedance increases significantly with the decrease of the current electrode size. The higher the electrode imped-ance is, the higher the voltage on the current electrode is, which is needed in or-der to keep a constant injecting current. The bigger the diameter of the mea-surement button is, the better the coupling between meamea-surement buttons and the formation are, the better the tool response is.
2) The OBIT response increases with the increase of the dielectric constant of the mud due to the capacitive impedance between the current electrodes, and the formation surface decreases with the increasing dielectric constant of the oil based mud. The OBIT response decreases with the increase of the mud layer thickness. The OBIT responses at the current frequency from 1 kHz to 10 kHz have good linearity.
3) The larger the current electrode separation distance is, the larger the pene-tration depth is. The penepene-tration depth is not sensitive to the formation resistivi-ty and borehole electrical properresistivi-ty as long as the transmitting current is kept constant.
Conflicts of Interest
The author declares no conflicts of interest regarding the publication of this pa-per.
References
[1] Yang, L., Li, Z., Lu, X.X., et al. (2014) Paleotopographic Characterization and Re-construction of Karst Reservoirs in Yingshan Formation, Tazhong area, Tarim Ba-sin:a Research Based on Borehole Image Log Interpretation. Acta Petrolei Sinica, 35, 265-275.
[2] Liu, X.J., Liu, K.B., Li, X.L., et al. (2011) Application of Acoustic-Electric Imaging Logging to Yanan Formation Reservoir Exploration in Northern Yanwu Area. Well Logging Technology, 35, 144-150.
[3] Zhang, X., Wang, D.L. and Song, C.A. (2014) Analysis and Application of Texture Based Well Logging Image. Journal of Oil and Gas Technology, 36, 73-77.
[4] Ekstrom, M.P., Dahan, C.A., Chen, M.Y., et al. (1986) Formation Imaging with Mi-croelectrical Scanning Arrays. Proceedings of SPWLA 27th Annual Logging Sym-posium, Houston, 9-13 June 1986, SPWLA-1986-BB.
[5] Safinya, K.A., Le Lan, P., Villegas, M., et al. (1991) Improved Formation Imaging with Extended Microelectrical Arrays.SPE Annual Technical Conference and Exhi-bition, Dallas, 6-9 October 1991, SPE 22726. https://doi.org/10.2118/22726-MS [6] Xing, X.J., He, S. and Zhou, D.Z. (2016) Appraise and Application of a New Kind of
Cleaning Fluid for OBM Cake Removing. Speciality Petrochemicals, 33, 21-23. [7] Yu, Z.H. (2014) Investigation on Characteristics of Electrical Imaging Tool for
Oil-Base Mud Based on Capacitive Coupling. Well Logging Technology, 38, 206-210.
DOI: 10.4236/ojogas.2019.41004 58 Open Journal of Yangtze Gas and Oil
Chinese Journal of Engineering Geophysics, 2, 304-310.
[10] Chemung, P., Cook, G., Flournoy, G., et al. (2001) A Clear Picture in Oil Based Mud. Oil Field Review, Winter 2001/2002, 1-27.
[11] Hayman, A.J. and Cheung. P. (2007) Formation Imaging While Drilling in Non-Conductive Fluids. US Patent: 7,242,194 B2.
[12] Cheung, P., Pittman, D., Hayman, A., et al. (2001) Field Test Results of a New Oil-Base Mud Formation Imager Tool. Transactions of the SPWLA 42nd Annual Logging Symposium, Houston, 17-20 June 2001, Paper XX.
[13] San Martin, L., Kainer, G., Paul Elliott, J., et al. (2008) Oil-Based Mud Imaging Tool Generates High Quality Borehole Images in Challenging Formation and Borehole Condition, Including Thin Bed, Low Resistive Formation and Shales. SPWLA 49th Annual Logging Symposium, Austin, 25-28 May 2008,SPWLA-2008-KKKK. [14] Evans, M.T. and Norwich, G.B. (2003) Apparatus and Method for Wellbore
Resisi-tivity Determination and Imaging Using Capacitive Coupling. US Patent: 6,600,321 B2.
[15] Bloemenkamp, R., Zhang, T.H., et al. (2014) Design and Field Testing of a New High-Definition Microresistivity Imaging Tool Engineered for Oil-Based Mud.
SPWLA 55th Annual Logging Symposium, Abu Dhabi, 18-22 May 2014, SPWLA-2014-KK.