A META-STACKED ENSEMBLE PROBABILISTIC CLASSIFIER
Akash kumar
Department of CSE, Birla Institute o
ARTICLE INFO ABSTRACT
The unabated growth in crimes in India causes concern to apply meta predictors of anti
crime in the future through a meta
presented in this paper. Several ensemble classifiers investigate various questions concerning the professional and private live
algorithms apply posterior probability on factors which affects the human crimes the most to predict if the people in the test data will commit a crime, accounting for the psycholog
activities and study of those. Results show improved accuracy of 95.78 % by employing the MSEPA(Meta Stack Ensemble Probabilistic Algorithm) presented in the work.
Copyright © 2018, Akash Kumar et al. This is an open distribution, and reproduction in any medium, provided
INTRODUCTION
Anti-social behavioural surge has made crime prediction a top cause of concern for law enforcement in the recent years. Terrorist attacks, serial murders, thefts, kidnaps, rapes have jeopardized the growth of our nation. Hence, strict vigilance on crimes and soft target to the criminals are inevitably executed by the law enforcement agencies to secure the country. Precautions, preventions and protection against crime can be enforced if computer-aided mining and meta
help in accurate before-hand prediction. We, he
conglomerate approach for criminal’s instigation by the Meta stacked Ensemble Probabilistic Algorithm (MSEPA). The framework proposes application of phase wise base ensemble classifiers (Xgboost, Linear SVM and Neural Network, Logistic regression) and further performs parameter tuning through Stacking with probabilistic distribution while validating further by cross validation of the testing data sample. Crime detection in highly imbalanced datasets is hence a meta-learning task involving appropriate learner with suitable bias, and learning to combine predictions of base classifiers, hence showing improved performance on both high and low diversity datasets. The remainder of this paper is organized as follows:
*
Corresponding author: Smita Pallavi,
Department of CSE, Birla Institute of Technology Mesra Patna Campus, India.
ISSN: 0975-833X
Article History:
Received 06th December, 2017 Received in revised form 24th January, 2018
Accepted 19th February, 2018 Published online 28th March, 2018
Citation: Akash kumar, Shwetabh Shekhar and Smita Pallavi
Research, 10, (03), 66323-66329. Key words:
Meta Stacking, Parameter Tuning, Criminal prediction,
posterior probability, Gradient boost.
RESEARCH ARTICLE
STACKED ENSEMBLE PROBABILISTIC CLASSIFIER
kumar, Shwetabh Shekhar and
*Smita Pallavi
Department of CSE, Birla Institute of Technology Mesra Patna Campus
ABSTRACT
The unabated growth in crimes in India causes concern to apply meta
predictors of anti-social behaviour. The ability to estimate whether someone prompts to commit a crime in the future through a meta-stacked framework which can handle imbalanced Big presented in this paper. Several ensemble classifiers investigate various questions concerning the professional and private lives and evaluate them for parameter tuning on cross validation. The learning algorithms apply posterior probability on factors which affects the human crimes the most to predict if the people in the test data will commit a crime, accounting for the psycholog
activities and study of those. Results show improved accuracy of 95.78 % by employing the MSEPA(Meta Stack Ensemble Probabilistic Algorithm) presented in the work.
access article distributed under the Creative Commons Attribution the original work is properly cited.
surge has made crime prediction a top cause of concern for law enforcement in the recent years. Terrorist attacks, serial murders, thefts, kidnaps, rapes have jeopardized the growth of our nation. Hence, strict vigilance on riminals are inevitably executed by the law enforcement agencies to secure the country. Precautions, preventions and protection against crime can be aided mining and meta-learning methods hand prediction. We, hence propose a conglomerate approach for criminal’s instigation by the Meta-stacked Ensemble Probabilistic Algorithm (MSEPA). The framework proposes application of phase wise base ensemble classifiers (Xgboost, Linear SVM and Neural Network, sion) and further performs parameter tuning through Stacking with probabilistic distribution while validating further by cross validation of the testing data sample. Crime detection in highly imbalanced datasets is hence opriate learner with suitable bias, and learning to combine predictions of base-level classifiers, hence showing improved performance on both high The remainder of this paper is
Technology Mesra Patna
Section 2 mentions about the related literature review and its shortcomings. Section 3 describes about the methods involved in implementing the various meta
discusses the proposed MSEPA pseudocode and the multi dimensional data methods. Section 5 discusses about the MSEPA experimentation and associated results. Finally, we conclude with summary and further research.
Related Literature Review
In recent past, the related work with ability to predict the future crime studying pattern can be listed as follows.
S. Sathyadevan et.al. (2014)
algorithm; Decision tree; NER; Mongo DB; Neo4j; GraphDB. The data was collected from different websites,blogs and classified using Naive Bayes
related to vandalism, murder, robbery, burglary, sex abuse, gang rape etc. analyzing the trends and patterns in crime. The limitation of the system is that it takes into consideration only a limited set of factors for crime detection. Also the system predicts crime prone regions for a particular day and not the time at which the crime is happening.
improvised ANN as classifier with Ant as the optimizer. They applied the ANN
and Crime dataset to predict ’Crime Categories’. The experiment results exhibited 7% increase in accuracy making it 86.48%. Aziz Nasridinov et.a
review of the data mining applications in crime. Crime International Journal of Current Research
Vol. 10, Issue, 03, pp.66323-66329, March, 2018
Akash kumar, Shwetabh Shekhar and Smita Pallavi, 2018. “A meta-stacked ensemble probabilistic classifier
Available online at http://www.journalcra.com
z
STACKED ENSEMBLE PROBABILISTIC CLASSIFIER
Smita Pallavi
f Technology Mesra Patna Campus, India
The unabated growth in crimes in India causes concern to apply meta-analysis and demonstrate the hether someone prompts to commit a stacked framework which can handle imbalanced Big-data is presented in this paper. Several ensemble classifiers investigate various questions concerning the s and evaluate them for parameter tuning on cross validation. The learning algorithms apply posterior probability on factors which affects the human crimes the most to predict if the people in the test data will commit a crime, accounting for the psychological aspects of human activities and study of those. Results show improved accuracy of 95.78 % by employing the MSEPA(Meta Stack Ensemble Probabilistic Algorithm) presented in the work.
ribution License, which permits unrestricted use,
Section 2 mentions about the related literature review and its shortcomings. Section 3 describes about the methods involved in implementing the various meta-classifiers. Section 4 discusses the proposed MSEPA pseudocode and the
multi-ds. Section 5 discusses about the MSEPA experimentation and associated results. Finally, we conclude with summary and further research.
In recent past, the related work with ability to predict the future an be listed as follows.
2014) used Naive Bayes; Apriori Decision tree; NER; Mongo DB; Neo4j; GraphDB. The data was collected from different websites,blogs and model by training crime data related to vandalism, murder, robbery, burglary, sex abuse, gang rape etc. analyzing the trends and patterns in crime. The limitation of the system is that it takes into consideration only crime detection. Also the system predicts crime prone regions for a particular day and not the time at which the crime is happening. S Anuar et.al. (2015) with Ant Bee Colony algorithm as the optimizer. They applied the ANN-ABC to Communities and Crime dataset to predict ’Crime Categories’. The experiment results exhibited 7% increase in accuracy making it
et.a.l (2017) provides a concise
review of the data mining applications in crime. Crime
INTERNATIONAL JOURNAL OF CURRENT RESEARCH
predictions are evaluated in terms of entity extr association rule mining, clustering, decision trees, support vector machines, Naïve Bayes rule, neural networks and social network analysis. R.Berk and J.Bleich (2013)
2017) compared the forecasting performance of three different classifiers namely logistic regression, random forests, and stochastic gradient boosting. The statistical forecasting techniques in criminal justice rest on symmetric loss functions. They forecasted class Membership with
classification trees. The stochastic gradient boosting applies a “weak learner” repeatedly to the data.
MACHINE LEARNING METHODS
Learning Analytics has grown manifold with dedicated software and faster generation of tools with domain
libraries and programming packages as Python, R and Weka. Specifically in this study, the following machine learning algorithms were implemented: Logistic Regression, Extreme gradient boosting, Linear Support Vector Machine and Neural Networks.
Extreme Gradient Boosting Machine
TheXGBOOST is an ensemble of traditional gradient boosting methods which solve the optimisation problem by performing second order gradient descent [20]. This approach results in more efficient model fitting making it more scalable than traditional gradient boosting (GBM). It can handle the highly diverse and complex feature space of descriptors, es
[image:2.595.321.543.145.222.2]where the class distribution is highly imbalanced as is the case of our real dataset.
Fig. 1. Adaptive Tree model implemented in XGBOOST algorithm (optimal linear combination of all decision trees)
The structure of individual tree (T(x)) guides a sample to a leaf and the associated score Wi is assigned as the prediction for that sample for that tree. The diagram and the equation explains the above statements.
( ) = ( ), ∈ , ∶ → {1,2,⋅⋅⋅
On the basis, the prediction model can be written as the aggregation of all the prediction score for each tree for a sample (x). Particularly for the i-th sample,
= ∑ ( ) , ∈ ………
where N is the number of trees, f is the function in the functional space and it is the all possible set of trees having prediction score in each leaf, slightly different from decision tree which only contains decision values.
66324 Akash Kumar et al. A meta
s are evaluated in terms of entity extraction, , clustering, decision trees, support networks and social (2013) (Vural et al.,
ting performance of three different classifiers namely logistic regression, random forests, and stochastic gradient boosting. The statistical forecasting techniques in criminal justice rest on symmetric loss functions. They forecasted class Membership with ensemble of classification trees. The stochastic gradient boosting applies a
Learning Analytics has grown manifold with dedicated software and faster generation of tools with domain-specific libraries and programming packages as Python, R and Weka. Specifically in this study, the following machine learning hms were implemented: Logistic Regression, Extreme gradient boosting, Linear Support Vector Machine and Neural
traditional gradient boosting problem by performing second order gradient descent [20]. This approach results in more efficient model fitting making it more scalable than traditional gradient boosting (GBM). It can handle the highly diverse and complex feature space of descriptors, especially where the class distribution is highly imbalanced as is the case
Adaptive Tree model implemented in XGBOOST bination of all decision trees)
The structure of individual tree (T(x)) guides a sample to a leaf is assigned as the prediction for that sample for that tree. The diagram and the equation
⋅, }
……… (i)
can be written as the aggregation of all the prediction score for each tree for a
……… (ii)
where N is the number of trees, f is the function in the and it is the all possible set of trees having prediction score in each leaf, slightly different from decision
Multilayer Neural Network
The objective of Neural system is to find a progression of weights that will give important values in the yield when determined particular cases of its information. Each node in hidden layer gain input from the input layer, which are multiplexed with proper weights and reduced.
Fig. 2. The mathematical analogy of ANN with synaptic structure of Neural Systems with threshold cut
In neural system, process the basic function and activation function. The basic function for input is access by the condition as given in equation (iii)
= . = + +.
The magnetic offset is the node’s internal threshold Ø. The output of the NN is achieved by the equation (iv)
= ( ) = {∑ −
A multi-layer feed-forward network with l input neurons, h hidden neurons and o output neurons , as in our case two output neurons for a binary classifier is depicted by (l architecture.
Linear Support Vector Machine
Linear Classifiers define the margin ss the width that the boundary could be increased by before hitting a datapoint. Support Vectors are those datapoints that the margin pushes up against linear classifier with the maximum margin. This is called LSVM.
As shown in Figure 3. the linear objective is expressed as
(xi,xj)=xiTxj ………
The corresponding goal of weights and bias is given as
w =Σαiyixi; b= yk- wTxk ………
for any xk such that αk 0 .Here, each non
corresponding xi is a support vector and classifying function
will have the form
ℱ (x) = ΣαiyixiTx + b ...
Fig . 3. Linear Support Vectors as function of weight and bias
Akash Kumar et al. A meta-stacked ensemble probabilistic classifie
The objective of Neural system is to find a progression of weights that will give important values in the yield when determined particular cases of its information. Each node in hidden layer gain input from the input layer, which are
er weights and reduced.
The mathematical analogy of ANN with synaptic structure Systems with threshold cut-off
In neural system, process the basic function and activation function. The basic function for input is access by the condition as given in equation (iii)
. + = ∑ … (iii)
The magnetic offset is the node’s internal threshold Ø. The output of the NN is achieved by the equation (iv)
} ……… (iv)
forward network with l input neurons, h hidden neurons and o output neurons , as in our case two output neurons for a binary classifier is depicted by (l-h-o)
Linear Support Vector Machine
r Classifiers define the margin ss the width that the boundary could be increased by before hitting a datapoint. Support Vectors are those datapoints that the margin pushes up against linear classifier with the maximum margin. This is
the linear objective is expressed as ℱ
……… (v)
The corresponding goal of weights and bias is given as
……… (vi)
[image:2.595.48.281.432.567.2]0 .Here, each non-zero αi indicates that is a support vector and classifying function
... (vii)
Data Processing and Proposed Model
The Crime Dataset contains 13712 anonymised
gathered across 72 feature variables. A few of them have been arrested for various small and large crimes in the past.
used the given data to predict if the people in the test data will commit a crime. Learning Analytics was carried out a follows:- the datasets were pre-processed and cleaned removing the missing or noisy data to get an imbalanced dataset. Next, the attributes used as predictors were extracted by finding the importance attributes, mean, standard deviation and correlation matrix. Then, the comparative predictive models were generated namely Logistic Regression, Xgboost, LSVM and NN. Removal of the underperforming models was done through tournament selection. Next, Stacking was performed on generating the mean probabilities of the binary classifiers hence further performance tuning led to the improved accuracy of the testing dataset as compared to the individual classifiers. count plot of the two binary classes of 0,1 depicting whether sample would not commit a crime in future or would surely commit another crime is shown in Chart -2 above.
The MSEPA Algorithm
The Meta Stacked Ensemble Probabilistic Algorithm hence proposed works as follows.
Chart 1. The sample of dataset under study with 72 featuring variables depicting data high dimensionality
Chart 2. The plot of the dependent variable Criminal count in binary class (0,1) showing the imbalanc
66325 International Journal of Current Research,
The Crime Dataset contains 13712 anonymised datasets gathered across 72 feature variables. A few of them have been arrested for various small and large crimes in the past. We have used the given data to predict if the people in the test data will commit a crime. Learning Analytics was carried out as processed and cleaned removing the missing or noisy data to get an imbalanced dataset. Next, the attributes used as predictors were extracted by finding the importance attributes, mean, standard deviation and correlation atrix. Then, the comparative predictive models were generated namely Logistic Regression, Xgboost, LSVM and NN. Removal of the underperforming models was done through Next, Stacking was performed on f the binary classifiers hence further performance tuning led to the improved accuracy of the testing dataset as compared to the individual classifiers. The count plot of the two binary classes of 0,1 depicting whether ture or would surely
above.
The Meta Stacked Ensemble Probabilistic Algorithm hence
Meta Stacked Ensemble Probabilistic
Input of Imbalanced Criminal Dataset
Data partition into :Train set - 20%;Test set - 20%
Perform Feature selection
Extreme Gradient Boosting
Optimal Feature XGB:= top 50% importance)
Linear SVM
Optimal Feature LSVM (Coefficient Calculation)
Fit train data in algorithms:
4.1Logistic Regression=
4.2 XGBmodel = fittrain [optimal Feature Extreme Gradient Boosting
4.3 LSVMmodel = fittrain [optimal Feature LSVM] Linear SVM
4.4 NNmodel = fittrain
Tournament Selection:
on Cross-Validation set
Gradient Boosting, Neural Network
Calculate P0iand P1i for i in Optimal models on Cross Validation set where P
posterior probabilities
The sample of dataset under study with 72 featuring variables depicting data high dimensionality
The plot of the dependent variable Criminal count in binary class (0,1) showing the imbalance nature of the sample data set
International Journal of Current Research, Vol. 10, Issue, 03, pp.66323-66329, March, 2018
Meta Stacked Ensemble Probabilistic Classifier (Msepa)
Imbalanced Criminal Dataset
into :Train set - 60% ;Cross Validation set
selection for Individual Classifiers Extreme Gradient Boosting
:= top 50% feature ranked (Gini
Optimal Feature LSVM:= top 50% feature ranked (Coefficient Calculation)
train data in algorithms:
Logistic Regression= fittrain in Logistic Regression
train [optimal Feature XGB]in
Extreme Gradient Boosting
train [optimal Feature LSVM]in
trainin Neural Network
: Select top two higher accuracy
Validation set Optimal models := Extreme
Gradient Boosting, Neural Network
for i in Optimal models on Cross Validation set where P0 and P1 are real outcomes or
The sample of dataset under study with 72 featuring variables depicting data high dimensionality
The plot of the dependent variable Criminal count in binary class (0,1) showing
Calculate P0mean and P1mean from values of P
Tune parameter p such that : Accuracy is max in output Result:= bool((P0 - P1 )>= p) as integer mean
Perform Stacking on resultant model with parameter
Calculate accuracy on test set using cross validation
EXPERIMENTAL RESULTS
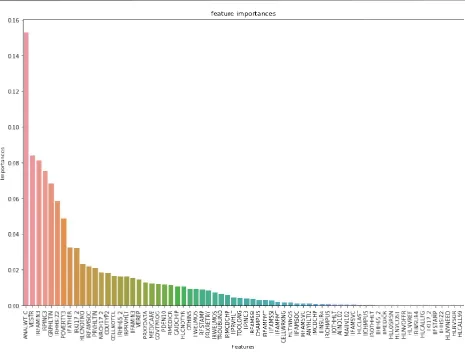
The foremost statistical evaluation done on the training dataset was Feature selection according to Gini index and Correlation Coefficient as depicted in Chart 3 and 4.
[image:4.595.63.529.51.406.2]negative values in the graph show the role of feature in classifying positive and negative values. Therefore we select the extremities of the features for both the classes in case of Linear SVM.
Table 1. The correlation matrix of the top selected features by all testing classifiers
The features are filtered according to the importance derived from the feature importance graph of XGB.
Chart 3. The segregation of 72 predictor variables according to the top features of the importance attribute (XGBOOST Model)
66326 Akash Kumar et al. A meta
from values of P0 and P1 such that : Accuracy is max in output
)>= p) as integer mean
Perform Stacking on resultant model with parameter p Calculate accuracy on test set using cross validation
The foremost statistical evaluation done on the training dataset was Feature selection according to Gini index and Correlation The positive and the role of feature in ssifying positive and negative values. Therefore we select the extremities of the features for both the classes in case of
The correlation matrix of the top selected features by all
according to the importance derived
Table 2. The Description of the top selected 7 out of 72 features by testing Classifiers
S.no Top Sig.
Features
Description
1. IIFAMIN3 Total Family income and imputation indicator
2. IRKI17_2 Imputation revised is when the input data has been
merged with data from the imputation indicator
3 IRMEDICR covered by MEDICARE and imputation revised
4 IRFAMSOC Family receives Social
5 IRPRVHLT Private health insurance and imputation revised
6 IRFAMIN3 Total Family income and imputation revised
7 IFATHER Father is in the household [
In our proposed model, the performance is measured by
TP
TN
FP
TN
TP
Accuracy
Where Ratio of Sum of True Positives and True Negatives are weighted over Sum of All four parameters.
Accuracy of logistic regression classifier on test set: 0.93 10-fold cross validation average accuracy: 0.939
Fig. 4. The Accuracy results shown by Logistic Regression model which was pruned from Classification
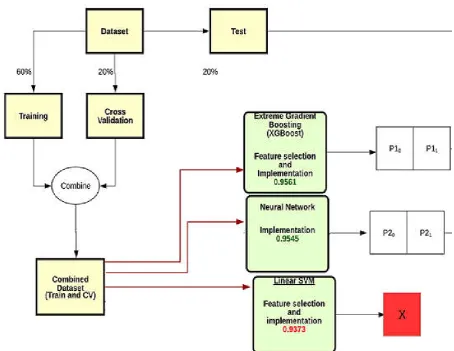
As experimentally observed in Figure 4, 5 and 6 showing the accuracy calculated in the MSEPA model framework, XGBoost showed an Accuracy of 0.9561 and the Neural Network classification algorithm predicted with an accuracy of 0.9545.
The segregation of 72 predictor variables according to the top features of the importance attribute (XGBOOST Model)
Kumar et al. A meta-stacked ensemble probabilistic classifie
Description of the top selected 7 out of 72 features by testing Classifiers
Total Family income and imputation indicator Imputation revised is when the input data has been merged with data from the imputation indicator covered by MEDICARE and imputation revised Family receives Social Security benefits payments Private health insurance and imputation revised Total Family income and imputation revised Father is in the household [-1,0,1]
In our proposed model, the performance is measured by
FN
FP
TN
………. (viii)Where Ratio of Sum of True Positives and True Negatives are weighted over Sum of All four parameters.
Accuracy of logistic regression classifier on test set: 0.93 fold cross validation average accuracy: 0.939
The Accuracy results shown by Logistic Regression model which was pruned from Classification As
experimentally observed in Figure 4, 5 and 6 showing the accuracy calculated in the MSEPA model framework, showed an Accuracy of 0.9561 and the Neural Network classification algorithm predicted with an accuracy of
[image:4.595.307.559.477.577.2]Chart -4: The importance plot of the 72 predictor variables according to the top features of the im
Chart 5. Comparative Mean and the Standard deviation computed for
0 0.5 1 1.5 2 2.5 3 3.5 4 4.5 5
IIFAMIN3 IRKI17_2
Me
an
vs.
StdDev
Feature Statistical Analysis
66327 International Journal of Current Research,
4: The importance plot of the 72 predictor variables according to the top features of the importance attribute (LINEAR SVM)
Comparative Mean and the Standard deviation computed for the relevant feature variables
IRKI17_2 IRMEDICR IRFAMSOC IRPRVHLT IRFAMIN3
Feature Statistical Analysis
International Journal of Current Research, Vol. 10, Issue, 03, pp.66323-66329, March,
portance attribute (LINEAR SVM)
the relevant feature variables
IFATHER
Mean
Logistic Regression with an initial accuracy of 0.93 and Linear SVM with the observed accuracy of 0.9373 were pruned out of the race for parameter tuning. Later ensemble parameter tuning was performed by adopting the mean probability calculation of falling in either of the binary classes which is the novelty of MSEPA algorithm. The dataset was divided into Training (60%), Testing (20%) and cross validation set (20%). The combined dataset of Training and Cross Validation was fed into base classifiers and were fitted for accuracy. The top two performers were further tuned for parameters by average posterior probabilities and meta-stacking was adopted. The accuracy was then observed on the improved model by the testing data.
Conclusion
[image:6.595.75.530.68.419.2]Our parameter tuning and empirical evaluation of classifiers like XGBoost, Linear SVM, Logistic Regression and Neural Network was fed to stacking approach which shows that they perform comparably to the best of the individual classifiers as selected by cross validation. Then combining stacking with probability distributions (PDs) has yielded better accuracy of 0.9578. Thus, we conclude that Meta Learning implies surely combining classifiers with stacking and posterior probabilities. The meta-learning tasks of crime prediction is done with improved Accuracy after applying MSEPA algorithm and hence increases accuracy, reducing dimensionality, improving
Fig. 5. The Model Flowchart with Accuracy indicators showing Linear SVM pruned after Tournament Selection
Fig. 6. The Model Flowchart with Parameter Tuning by computing mean of posterior probabilities
[image:6.595.66.533.456.621.2]performance, removing irrelevant data and is an improved technique in data mining.
REFERENCES
Álvarez, P.M., Luengo, J. and Herrera, F. 2016. A first study on the use of boosting for class noise reparation. In: Martínez-Álvarez, F., Troncoso, A., Quintián, H., Corchado, E. (eds.) HAIS 2016. LNCS, vol. 9648, pp. 549–
559.Springer,Cham., doi: 10.1007/978-3-319-32034-2_46
Anuar, Syahid, Ali Selamat, and Roselina Sallehuddin. 2015."Hybrid artificial neural network with artificial bee colony algorithm for crime classification." Computational Intelligence in Information Systems. Springer, Cham, pp 31-40.
Anuar, Syahid, Ali Selamat, and RoselinaSallehuddin. "Hybrid particle swarm optimization feature selection for crime classification." New Trends in Intelligent Information and Database Systems. Springer, Cham, 2015. pp101-110. Bache, K. and Lichman, M. 2013. “UCI Machine Learning
Repository.” URL http://archive.ics. uci.edu/ml.
Berk, R. and Bleich, J. 2013. ”Statistical Procedures for ForecastingCriminalBehavior:AComparative Assessment”,
Criminology and Public Policy 12 (3), 513-544.
Chen, T., and Gestrin, C. 2016. A scalable tree boosting system. In: Proceedings of the 22nd ACM SIGKDD International Conference on Knowledge Discovery and Data Mining, pp. 785–794. ACM.
De Bruin, J.S., Cocx, T.K., Kosters, W.A., Laros, J.F.J., Kok, J.N.: Data mining approaches to criminal career analysis. In: Proceedings of the Sixth International Conference on Data Mining (ICDM), pp. 171–177 (2006)
Frénay, B. and Verleysen, M. 2014. Classification in the presence of noise: a survey. IEEE Trans. Neural Netw.
Learn. Syst., 25(5), 845–869.
Gashti, and Mehdi Zekriyapanah. 2017. "A novel hybrid support vector machine with decision tree for data
classification." International Journal of Advanced and
Applied Sciences 4.9: pp 138-143.
Gómez-Ríos A., Luengo J. and Herrera F. 2017. A Study on the Noise Label Influence in Boosting Algorithms: AdaBoost, GBM and XGBoost. In: Martínez de Pisón F., Urraca R., Quintián H., Corchado E. (eds) Hybrid Artificial Intelligent Systems. HAIS 2017. Lecture Notes in Computer Science, vol 10334. Springer, Cham https://doi.org/10.1007/978-3-319-59650-1_23.
Hassani, Hossein, et al. 2016. "A review of data mining applications in crime." Statistical Analysis and Data Mining: The ASA Data Science Journal, 9.3:pp 139-154. IsuruJayaweera, ChamathSajeewa, SampathLiyanage,
Tharindu Wijewardan, IndikaPerera and Adeesha Wijayasiri, 2015.”Crime Analytics: Analysis of Crimes through Newspaper Articles”,ISSN: 978-1-4799- 1740-2/15,2015, IEEE,
MugdhaSharma, 2014. ”Z - CRIME: A Data Mining Tool for the Detection of Suspicious Criminal Activities Based on Decision”, ISSN: 978–1–4799–4674–7/14, IEEE.
Nasridinov, Aziz, et al. "Application of Data Mining for Crime Analysis." Advanced Multimedia and Ubiquitous Engineering. Springer, Berlin, Heidelberg, 2016. 503-508. Shamsuddin, NurulHazwaniMohd, Nor Azizah Ali, and
RazanaAlwee. 2017. "An overview on crime prediction methods." Student Project Conference (ICT-ISPC), 2017 6th ICT International. IEEE.
ShijuSathyadevan, Devan, M.S. and Surya Gangadharan, S. 2014. ”Crime Analysis and Prediction Using Data Mining”, ISSN:978- 1-4799-3486-7/14 , IEEE.
UbonThongsatapornwatana, 2016. ”A Survey of Data Mining Techniques for Analyzing Crime Patterns”, ISSN: 978-1-5090-2258- vol 8, issue 16,IEEE.
Vural, Mehmet Sait, and Mustafa Gök. 2017."Criminal prediction using Naive Bayes theory." Neural Computing
and Applications, 28.9: pp 2581-2592.