Journal of Geoscience and Environment Protection, 2018, 6, 21-42 http://www.scirp.org/journal/gep ISSN Online: 2327-4344 ISSN Print: 2327-4336
DOI: 10.4236/gep.2018.612002 Dec. 4, 2018 21 Journal of Geoscience and Environment Protection
The Spatial Distribution Pattern Analysis of
City Infrastructure Cases of Urban Management
Jiwei Hou
1,2, Jianhua Liu
1,2*, Siyu Li
1,2, Shiran Song
1,2, Congcong Li
1,2, Yueming Duan
2,
Baoshan Zeng
21Key Laboratory for Urban Geomatics of National Administration of Surveying, Mapping and Geoinformation, Beijing, China 2School of Geomatics and Urban Spatial Information, Beijing University of Civil Engineering and Architecture, Beijing, China
Abstract
The effective disposal of daily city infrastructure cases is an important issue for urban management. To more effectively utilize a large amount of histori-cal cases data collected and accumulated in the urban grid management sys-tem, and to analyze their spatial distribution pattern information for city managers, this study used the comparative kernel density analysis method in two types of cases (i.e. power facilities and traffic guardrail) in Xicheng Dis-trict, Beijing for the year 2016 and 2017. This research analyzes them at dif-ferent scales (300 m, 600 m, 1,200 m), and the experiment results show that the method of comparative kernel density analysis is able to provide an intui-tively spatial visualization distribution analysis of city infrastructure related cases. The quantitative information of spatial agglomeration degree is helpful for city managers making decision.
Keywords
City Management Cases, Spatial Distribution Analysis, Distribution Scale, Hotspot Distribution
1. Introduction
With the rapid development of urbanization, the amount of city infrastructure related cases in urban management has been increasing exponentially. A large number of urban management cases not only affect the environment of the city, but also cause problems for the residents’ daily life. To solve these problems in an effective way is a key issue for city managers. The government has vigorously promoted the construction of intelligent cities in recent years, and the urban grid management system (Zhao, 2012) can be recognized as a successful in-How to cite this paper: Hou, J. W., Liu, J.
H., Li, S. Y., Song, S. R., Li, C. C., Duan, Y. M., & Zeng, B. S. (2018). The Spatial Dis-tribution Pattern Analysis of City Infra-structure Cases of Urban Management. Journal of Geoscience and Environment Protection, 6, 21-42.
https://doi.org/10.4236/gep.2018.612002
Received: October 29, 2018 Accepted: December 1, 2018 Published: December 4, 2018
Copyright © 2018 by authors and Scientific Research Publishing Inc. This work is licensed under the Creative Commons Attribution International License (CC BY 4.0).
DOI: 10.4236/gep.2018.612002 22 Journal of Geoscience and Environment Protection stance. After years of serving, the urban grid management system has accumu-lated many historical data of city infrastructure reaccumu-lated cases. To take advantage of this digital urban management system, many researchers use spatiotemporal data analysis techniques to dig deep into the temporal and spatial distribution of urban management cases (Hajduk, 2016; Guo et al., 2015). The related re-searches have significantly guided the human resources allocation plan of urban management and related urban management decision. This paper mainly used the comparative kernel density analysis method, and analyzed the kernel density of two main cases (power facilities and traffic guardrail) in the urban grid man-agement system of Xicheng District from January 1st, 2016 to December 31st, 2017.
This paper uses the massive city cases’ management data accumulated in Xi-cheng District of Beijing, through the intensive study and analysis of urban cases (Wang & Du, 2014; Zarabi et al., 2011; Fu et al., 2017), and transferred the tradi-tional “passive discovery and prevention” mode into “active prevention and predic-tion in advance” mode, so that to provide an effective exploratory analysis and vi-sualization method, which can be used as decision references for urban managers.
The structure of this paper is as follows: Section 1 introduces the research area and data types of spatial analysis, and then introduces the ideas and methods of spatial analysis. Section 2 introduces the main ideas of making thermodynamic charts and shows the distribution of important cases. The comparative kernel density analysis and regional variance analysis are used to explore the impact of different spatial scales on the cases distribution. In the end, the conclusion of our study and the outlook of our works are summarized in Section 3.
2. Study Area and Experiment Data
2.1. The Study Area
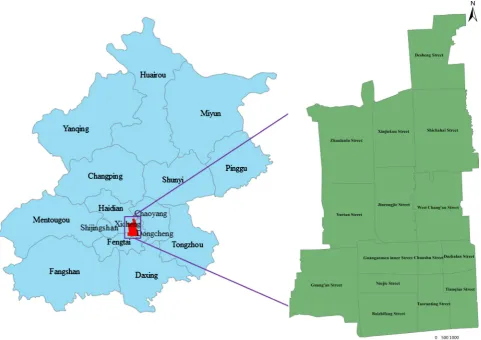
Xicheng District is located in the middle part of Beijing, shown in red color in Figure 1. It covers an area of 50.70 km2, 15 sub district offices and 258 com-munities in the area. As the core area of the capital, Xicheng District is an im-portant urban area with a political center, a commercial area and a tourist desti-nation. The specific distribution is shown in Figure 1.
2.2. Experiment Data
J. W. Hou et al.
DOI: 10.4236/gep.2018.612002 23 Journal of Geoscience and Environment Protection
[image:3.595.60.542.116.456.2]events, spatial coordinates, and other items related information.
[image:3.595.92.507.490.700.2]Figure 2 shows the statistics of 5 categories urban management case data in
Figure 1. The study area, located at longitude 116.372514E, latitude 39.918346N, and center of the Beijing.
DOI: 10.4236/gep.2018.612002 24 Journal of Geoscience and Environment Protection
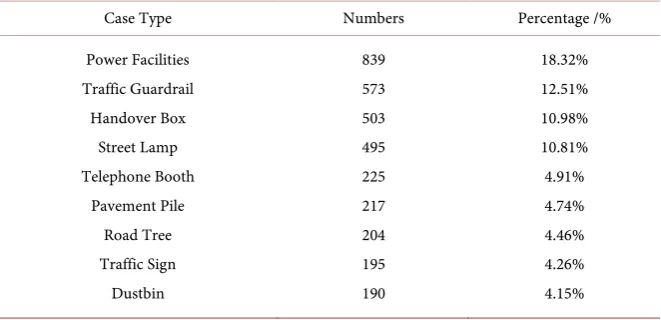
Table 1. Statistics of top ten types of city management cases.
Case Type Numbers Percentage /%
Power Facilities Traffic Guardrail Handover Box Street Lamp Telephone Booth Pavement Pile Road Tree Traffic Sign Dustbin 839 573 503 495 225 217 204 195 190 18.32% 12.51% 10.98% 10.81% 4.91% 4.74% 4.46% 4.26% 4.15%
2016 and 2017. Table 1 shows the basic statistical information of the top 10 types of cases, and power facilities and traffic guardrail are the top two most common cases. Therefore, this paper focuses on these two types.
3. Method
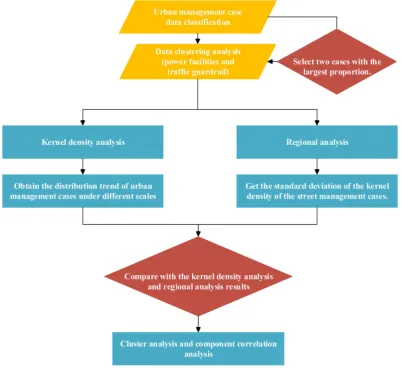
Because the kernel density estimation method does not use the prior knowledge of data distribution and does not attach any assumptions to the data distribu-tion, it is a method to study the characteristics of data distribution from the data sample itself (Gong et al., 2017). So that the kernel density analysis algorithm (Fu, Li, Yang et al., 2015; Shen & Guo, 2014) is used to analyze the urban man-agement cases data. Through the correlation analysis between the clustering re-sults and the urban management cases, this study identified the spatial distribu-tion pattern of events and measured the agglomeradistribu-tion degree of spatial distri-bution. This information will be provided to city managers. Figure 3 shows the flow chart of the procedure.
3.1. The Kernel Density Estimation Method
The Kernel density estimation method is developed from the quadrate counting method (Okabe, Satoh, & Sugihara, 2009), but superior because it considers the relationship between points in the study unit. The original purpose of this me-thod was to obtain a smooth estimation of the probability density from the ob-served data, based on the premise that there is a potential event density at any location in the study area (Dai et al., 2015; Gamez & Ileana, 2012). There are many methods to estimate the event density at any point in the region. The most common one is to take the point as the center of the circle and count the number of events within the radius r of the circle, then divide it by the area of the circle. So the density of s event point can be expressed as follows:
( )
1 21 n is i d s k r r
λ
π
= = ∑
(1)J. W. Hou et al.
[image:5.595.139.542.71.439.2]DOI: 10.4236/gep.2018.612002 25 Journal of Geoscience and Environment Protection
Figure 3. Procedure of cluster of urban management cases.
density function, it is often symmetric density function and can be understood as the weight of point i. dis represents the Euclidean distance from point i to
point s, the radius r determines the smoothness of density surfaces. The com-mon kernel functions are homogeneous kernel, quadratic kernel, triangular ker-nel, Gaussian kerker-nel, cosine kernel etc. (Leszek, 2015; Li & Zhou, 2016; Zhu, 2006). The results show that the relative scale of kernel function has little effect on kernel density estimation (O’Sullivan & Wong, 2007).
distribu-DOI: 10.4236/gep.2018.612002 26 Journal of Geoscience and Environment Protection tion analysis of urban management cases.
3.2. Region Analysis
Region analysis is mainly based on “region” as the object of analysis and opera-tion (Kim et al., 2017), in order to more clearly see the trends and trajectories found in urban management cases at the macro level. The standard deviation of kernel density at different scales of each sub-district office can be clearly seen by regional analysis, so as to judge the occurrence of cases in each sub-district and the change of kernel density in different scales. In each street area, using the fol-lowing formula (2) to calculate the standard deviation of kernel density.
( )
(
)
21
1 N
i i
S x x x
N =
=
∑
− (2)Among the formula, N refers to the number of all raster pixels in the region,
i
x represents the kernel density at raster pixel i, and x represents the average
kernel density of urban management cases in the region.
4. Results and Discussions
For the parameter setting of kernel density estimation method in ArcGIS plat-form, there are three main parameters: Population field, output pixel size and search area. Population field is set for the weight of each urban management case. The output pixel size is set to 20 m, and the search area is set to 300 m, 600 m and 1200 m respectively. Generally, in Xicheng District, 300 m represents the community level, 600 m represents the street level, and 1200 m represents the whole district level (Jing et al., 2017). In order to clearly show the variation trend of urban management cases under different scales, the regional variance statis-tics of kernel density are carried out separately for the calculated results.
4.1. Kernel Density Analysis
Figure 4 and Figure 5 show the spatial distribution trend change of power facil-ities cases and power facilfacil-ities, traffic guardrail cases and traffic guardrail at dif-ferent scales. The power facilities cases and traffic guardrail cases are the damage situation of power facilities and traffic guardrail that reported by supervisors.
J. W. Hou et al.
DOI: 10.4236/gep.2018.612002 27 Journal of Geoscience and Environment Protection
J. W. Hou et al.
DOI: 10.4236/gep.2018.612002 29 Journal of Geoscience and Environment Protection
J. W. Hou et al.
DOI: 10.4236/gep.2018.612002 31 Journal of Geoscience and Environment Protection
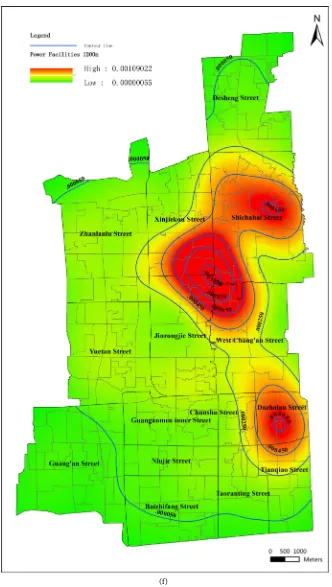
DOI: 10.4236/gep.2018.612002 32 Journal of Geoscience and Environment Protection (f)
Figure 4. Kernel density distribution of “Power Facilities” cases at different scales and
J. W. Hou et al.
DOI: 10.4236/gep.2018.612002 33 Journal of Geoscience and Environment Protection
J. W. Hou et al.
DOI: 10.4236/gep.2018.612002 35 Journal of Geoscience and Environment Protection
J. W. Hou et al.
DOI: 10.4236/gep.2018.612002 37 Journal of Geoscience and Environment Protection
DOI: 10.4236/gep.2018.612002 38 Journal of Geoscience and Environment Protection (f)
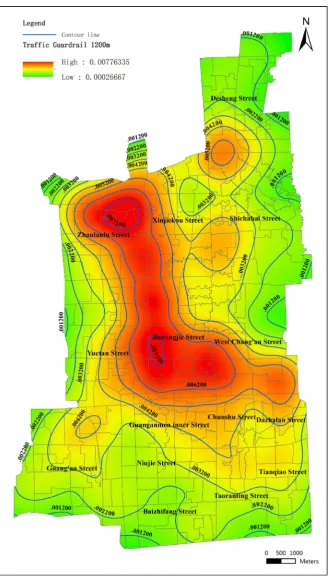
Figure 5. Kernel density distribution of “Traffic Guardrail” cases at different scales and
J. W. Hou et al.
DOI: 10.4236/gep.2018.612002 39 Journal of Geoscience and Environment Protection
the number of power facilities in the area. The more facilities in the area, the higher incidence of cases in the area.
Traffic guardrail cases are similar to power facilities cases. At small scale, the concentrated areas are scattered in Desheng Street, Zhanlanlu Street, Guang’an Street, Dazhalan Street and Tianqiao Street. With the increase of scale, at 1200 m scale, only the Guang’an Street and Dazhalan Street show obvious concentrated areas. However, we can see from (Figure 5(a), Figure 5(c), Figure 5(e)) and (Figure 5(b), Figure 5(d), Figure 5(f)) comparison that the distribution area of traffic guardrail cases is very limited due to the number of traffic guardrail in this area.
Therefore, it can be seen that at small scale, it can be clearly seen that the rela-tively concentrated distribution of cases within each street, the spatial distribu-tion of local details is more significant; At large scale, it highlights the overall distribution of cases throughout the entire study area.
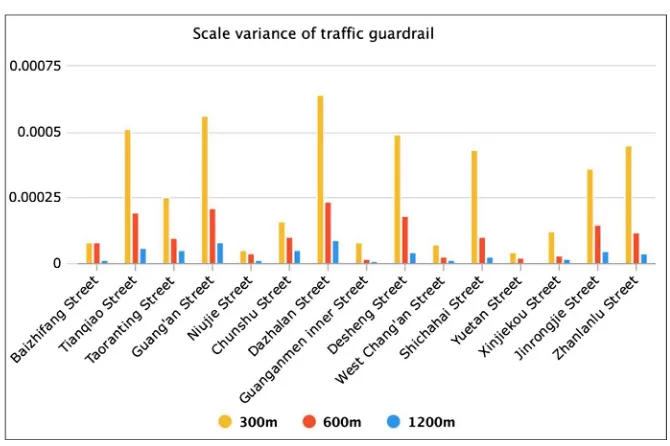
4.2. Variance Comparison
Figure 6 and Figure 7 show the variance distribution of the kernel density of
each street at different scales for power facilities and traffic guardrail cases. It is obvious that the variance of kernel density decreases with the increase of scale. It shows that with the increase of scale, the kernel density value of each street area decreases. From (Figure 4(a), Figure 4(c), Figure 4(e)) and (Figure 5(a), Fig-ure 5(c), Figure 5(e)), we can see that the larger the scale, the smaller the kernel density is, and the larger the concentrated area of the case distribution. Accor-dingly, the smoother the contour line changes, the smaller the variance is.
And it can be clearly seen that in the diagram that the maximum variance of kernel density in power facilities cases is at Shichahai Street, and in traffic gua-rdrail cases it is at Dazhalan Street.
DOI: 10.4236/gep.2018.612002 40 Journal of Geoscience and Environment Protection
Figure 7. Traffic guardrail variance comparison of calculation results for kernel density
of different streets and scales.
5. Conclusion
Urban grid management system has greatly improved the comprehensive effi-ciency of urban management. City infrastructure cases’ management is an im-portant part of urban management. The analysis of urban management cases can present more useful information to improve the efficiency of case handling.
This paper focuses on the analysis of power facilities and traffic guardrail cas-es. It provides the hotspot information to intuitively display the spatial distribu-tion trend of related cases, which can provide the management and resource deployment information for the relevant management departments. In the anal-ysis of urban management cases, the choice of different scales reflects the differ-ent trend of cases distribution. The smaller the scale is, the more details reveals and the more concentrated areas are; The larger the scale is, the fewer concen-trated areas and the larger concenconcen-trated area are, which highlights the overall distribution of cases. The larger the scale is, the smaller the density of urban management cases is; otherwise, the smaller the scale is, the larger the density of urban management cases is.
However, the spatial clustering method used in this paper belongs to the cat-egory of exploratory spatial data analysis in essence. It can assist in exploring the relationships, patterns and trends hidden in spatial data without excessive prior knowledge and assumptions, it can also handle other case types as listed in Table 1. In the future research, we plan to add population and economic variables and other auxiliary data, and use geographic weighted regression and other spatial statistical methods to do further modeling analysis.
Acknowledgements
J. W. Hou et al.
DOI: 10.4236/gep.2018.612002 41 Journal of Geoscience and Environment Protection
(No.41301489), Beijing Natural Science Foundation (No.4142013), BUCEA Post Graduate Innovation Project (No. PG2018061), Outstanding Youth Teacher Program of Beijing Municipal Education Commission (No.21147518308), Out-standing Youth Researcher Program of Beijing University of Civil Engineering and Architecture (No. 21082716012).
Conflicts of Interest
The authors declare no conflicts of interest regarding the publication of this pa-per.
References
Zhao, C. X. (2012). Application of Urban Grid Management System. Science Mosaic. Dai, P., Jing, C., Du, M., & Zhou, W. (2015). A Method Based on Spatial Analyst to
Detect Hot Spot of Urban Component Management Events. IEEE International Con-ference on Spatial Data Mining & Geographical Knowledge Services, Fuzhou, 8-10 July 2015, 55-59. https://doi.org/10.1109/ICSDM.2015.7298025
Fu, J. Y., Jing, C. F., Du, M. Y., Fu, Y. L., & Dai, P. P. (2017). Study on Adaptive Parameter Determination of Cluster Analysis in Urban Management Cases. ISPRS—International Archives of the Photogrammetry, Remote Sensing and Spatial Information Sciences, XLII-2/W7, 1143-1150.https://doi.org/10.5194/isprs-archives-XLII-2-W7-1143-2017
Fu, Q., Li, B., Yang, L. L. et al. (2015). Ecosystem Services Evaluation and Its Spatial Cha-racteristics, in Central Asia’s Arid Regions: A Case Study in Altay Prefecture, China.
Sustainability, 7, 8335-8353.https://doi.org/10.3390/su7078335
Gamez, R., & Ileana, L. (2012). New Perspectives on the Spatial Analysis of Urban Em-ployment Distribution and Commuting Patterns: The Cases of Hermosillo and Ciudad Obregon, Mexico. Dissertations & Theses, Tucson, AZ: The University of Arizona. Gong, X., Cheng, H., Yang, L., Duan, Y., Yao, Y., Feng, Y. et al. (2017). Analysis of
Geo-graphical Distribution of Missing Children Based on the Missing Children Mobile GIS Mutual Assistance System of China. Journal of Geoscience and Environment Protec-tion, 5, 117-134.https://doi.org/10.4236/gep.2017.512009
Hajduk, S. (2016). The Concept of a Smart City in Urban Management. Business Man-agement & Education, 14, 34-49.https://doi.org/10.3846/bme.2016.319
Guo, J. et al. (2015). Urban Spatial Structure Based on Point Pattern Analysis—Taking Beijing Metropolitan Area as a Case. Economic Geography, 35, 68.
Jing, C. et al. (2017). Spatial Pattern Analysis on Global Distribution of Urban Manage-ment Case Based on Nearest Index. Science of Surveying & Mapping, 42, 76.
Kim, H. K., Yi, M. S., & Shin, D. B. (2017). Regional Diffusion of Smart City Service in South Korea Investigated by Spatial Autocorrelation: Focused on Safety and Urban Management. Spatial Information Research, No. 4, 1-12.
https://doi.org/10.1007/s41324-017-0150-2
Leszek, K. (2015). Environmental and Urban Spatial Analysis Based on a 3D City Model. In Computational Science and Its Applications—ICCSA 2015 (pp. 633-645). Berlin: Springer International Publishing.https://doi.org/10.1007/978-3-319-21470-2_46
Li, M., & Zhou, Z. (2016). Positive and Negative Ecosystem Services Evaluation and Its Spatial Pattern Analysis on Urban Landscape: A Case Study of Xi’an City. Acta Geo-graphica Sinica, 71, 1215-1230.https://doi.org/10.3724/SP.J.1006.2016.01215
Transforma-DOI: 10.4236/gep.2018.612002 42 Journal of Geoscience and Environment Protection
tion: Smart Specialization of Urban Capabilities in the Helsinki Region. Technology Innovation Management Review, 5, 42-51.https://doi.org/10.22215/timreview/936
O’Sullivan, D., & Wong, D. W. S. (2007). A Surface-Based Approach to Measuring Spatial Segregation. Geographical Analysis, 39, 147-168.
https://doi.org/10.1111/j.1538-4632.2007.00699.x
Okabe, A., Satoh, T., & Sugihara, K. (2009). A Kernel Density Estimation Method for Networks, Its Computational Method and a GIS-Based Tool. International Journal of Geographical Information Science, 23, 7-32.
https://doi.org/10.1080/13658810802475491
Shen, L., & Guo, X. (2014). Spatial Quantification and Pattern Analysis of Urban Sustai-nability Based on a Subjectively Weighted Indicator Model: A Case Study in the City of Saskatoon, SK, Canada. Applied Geography, 53, 117-127.
https://doi.org/10.1016/j.apgeog.2014.06.001
Wang, P., & Du, J. Q. (2014). Smart Cities and Urban Planning: An Analysis of Current Practices in Multiple Spatial Scales. City Planning Review, 38, 37.
Zarabi, A., Saberi, H., Mohammadi, J., & Varesi, H. R. (2011). Spatial Analysis of Smart Growth Indicators (The Case Study: Regions of Isfahan).
http://en.journals.sid.ir/ViewPaper.aspx?ID=259208