HAND GESTURE CLASSIFICATION USING DIFFERENT CLASSIFIERS WITH WEKA
*,1
Kavitha
1
Department of Computer Science and Applications,
2
Department of Computer Science and Applications,
ARTICLE INFO ABSTRACT
In this paper we
Language hand gestures using different class association rules and classification models. In knowledge
of data mining and widely used in association rule mining
classification and prediction can be solved us simulation on WEKA, we have
result from our training dataset.
Copyright © 2015 Kavitha, S and Hanumanthappa, M.
unrestricted use, distribution, and reproduction in any medium, provided the original work is properly cited.
INTRODUCTION
The hand gesture identification has numerous applications hence it has become an active research theme because of its use in human- computer interface and it has got a focus in the sense that it will help the disabled people or aged people. The gesture recognition is to create a system that recognizes the gestures and use them for controlling the device. The gestures can be from any bodily motion but importantly from face and hand (Han et al., 2011; Joyeeta Singha, 2013
recognition is one of the growing fields of research today. Gestures are some forms of actions which a person expresses in order to express information to others without saying it. In our daily life, we can observe few hand gestures frequently used for communication purpose like thumbs up, thumbs down, victory, directions, traffic hand signals etc.,
open source software. It is a very popular set of software for machine learning, containing a collection of visualization tools and algorithms for data analysis and predictive modeling, together with graphical user interfaces for easy access to this functionality. Weka can be used to do a wide var operations on the data (Hall et al., 2009
important operations which can be carried out using weka suite are shown below:
Classification of data
Regression analysis and prediction
*Corresponding author: Kavitha, S.
Department of Computer Science and Applications, Dayananda Sagar College of Arts, Science and Commerce, Bangalore
ISSN: 0975-833X
Vol.
Article History:
Received 20th February, 2015
Received in revised form 07th March, 2015
Accepted 07th April, 2015
Published online 25th May,2015
Key words:
Association rule,
Hand gesture classification, Data mining, Image processing.
REVIEW ARTICLE
HAND GESTURE CLASSIFICATION USING DIFFERENT CLASSIFIERS WITH WEKA
Kavitha, S and
2Hanumanthappa, M.
and Applications, Dayananda Sagar College of Arts,
Bangalore-78, India
Department of Computer Science and Applications, Bangalore University, Bangalore
ABSTRACT
In this paper we proposed the comparative study of hand gesture classification for the Indian Sign Language hand gestures using different class association rules and classification models. In knowledge discovery process association rule mining and classification aretwo
of data mining and widely used in various fields. This paper tries to explain the basics of class association rule mining and classification through WEKA for hand gestures. How
classification and prediction can be solved using class association rules were discussed. In the simulation on WEKA, we have used selected classification techniques to propose the
result from our training dataset.
. This is an open access article distributed under the Creative Commons Att use, distribution, and reproduction in any medium, provided the original work is properly cited.
The hand gesture identification has numerous applications hence it has become an active research theme because of its use computer interface and it has got a focus in the sense that it will help the disabled people or aged people. The gesture recognition is to create a system that recognizes the gestures and use them for controlling the device. The gestures can be odily motion but importantly from face and hand , 2013). Hand gesture recognition is one of the growing fields of research today. Gestures are some forms of actions which a person expresses in o others without saying it. In our observe few hand gestures frequently used for communication purpose like thumbs up, thumbs down, victory, directions, traffic hand signals etc., Weka is a free set of software for machine learning, containing a collection of visualization tools and algorithms for data analysis and predictive modeling, together with graphical user interfaces for easy access to this Weka can be used to do a wide variety of ., 2009). Some of the important operations which can be carried out using weka suite
Computer Science and Applications, Dayananda Sagar College of Arts, Science and Commerce, Bangalore-78, India.
Clustering of data Associating data
In our paper, we have firstly used Skin filtering where the RGB image is converted to HSV image because this model
sensitive to changes in lighting condition. And then K transform is performed. Some
already been done, for example hand gesture recognition for sign language, hand gestures used f
motion, in video games, etc.
Literature review
Class association rule mining process can be decomposedin three parts (Al-Harbi et al., 2008
First find frequent item sets and frequent classassociation rules.
Second we find the strong class association rules bypruning the weak rules.
Design a classifier
King and Elder (1998) have conducted an evaluation of fourteen data mining tools ranging in price from $75 to $25,000. The evaluation process was performed by three kinds of user groups: (1) four undergraduates; who are inexperienced users in data mining, (2) a relatively expe
student, and (3) a professional data mining consultant. Tests were performed using four data sets. To test tools flexibility and capability, their output types have varied: two binary
International Journal of Current Research Vol. 7, Issue, 05, pp.15632-15637, May, 2015
HAND GESTURE CLASSIFICATION USING DIFFERENT CLASSIFIERS WITH WEKA
Sagar College of Arts, Science and Commerce,
Bangalore University, Bangalore-56, India
proposed the comparative study of hand gesture classification for the Indian Sign Language hand gestures using different class association rules and classification models. In discovery process association rule mining and classification aretwo important techniques various fields. This paper tries to explain the basics of class and classification through WEKA for hand gestures. How problems of class association rules were discussed. In the used selected classification techniques to propose the appropriate
access article distributed under the Creative Commons Attribution License, which permits
In our paper, we have firstly used Skin filtering where the RGB o HSV image because this model is more sensitive to changes in lighting condition. And then K-L applications in this field that has already been done, for example hand gesture recognition for hand gestures used for controlling robot’s
Class association rule mining process can be decomposedin ., 2008).
First find frequent item sets and frequent classassociation
rong class association rules bypruning
classifications (one with missing data), a multi-class set, and a noiseless estimation set. A random two-thirds of the cases in each have served as training data; the remaining one-third was test data. Authors have developed a list of 20 criteria, plus a standardized procedure, for evaluating data mining tools. The tools ran under Microsoft Windows 95, NT, or Macintosh 7.5 operating systems, and have employed Decision Trees, Rule Induction, Neural Networks, or Polynomial Networks to solve two binary classification problems, a multi-class classification problem, and a noiseless estimation problem (Fayyad et al., 1996). Results have provided a technical report that details the evaluation procedure and the scoring of all component criteria. Authors also showed that the choice of a tool depends on a weighted score of several categories such as software budget and user experience. Finally, authors have showed that the tools' price is related to quality Daniel Grossman and Pedro Domingos (2004).
Methodology
WEKA is a data mining system developed at the University of Waikato and has become very popular among the academic community working on data mining (Han et al., 2011). The researcher has chosen to develop this system in WEKA as it realized the usefulness of having such a classifier in the WEKA environment. Weka is an open source machine learning environment with many useful data mining and machine learning algorithms. Many other classification systems have been built based on association rules. In the research paper, there is an implementation of an association rule-based classifier system in the WEKA framework. The researcher has selected the dataset given in the Table IV which depicts the information about different possibilities of the play to occur on the basis of weather (Hornik et al., 2010). Thus in the Table IV outlook, temperature, humidity and windy are antecedent and play is consequence.
Hand gesture classification using different classifiers with WEKA having different steps are given below
Step1: Collecting ISL Database Step2: Preprocess images
Step3: Processing images using different classifiers Step4: Compare values with different types of classifiers Step5: Experiments and results
Collecting ISL Datasets
Hand Gestures provide a rich and intuitive form of interaction for Sign languages. The assembled architecture performed the desired activities based on the commands with a tolerable response time. Hand gesture recognition system has been develop d based on statistical measures like mean, variance, skewness, and kurtosis as a feature set using CART model. It is observed that this classifier is robust with respect to usage of hand and mode of hands like front or back side of hand (Abbot et al., 1998).To evaluate the system the gesture data has been acquired from set of students. The gesture classifier 10 fold validation performed 90% accuracy.
Preprocess images
Hand Gestures provide a rich and intuitive form of interaction for Sign languages. The assembled architecture performed the
desired activities based on the commands with a tolerable response time. Hand gesture recognition system has been develop d based on statistical measures like mean, variance, skewness, and kurtosis as a feature set using CART model. It is observed that this classifier is robust with respect to usage of hand and mode of hands like front or back side of hand (Carey et al., 1999). To evaluate the system the gesture data has been acquired from set of students. The gesture classifier 10 fold validation performed 90% accuracy.
Feature Extraction
The dataset is created for ISL hand gestures are the possible attributes of the gestures of Indian sign language are: RMS, Mean, Standard deviation, VAr, MNF, ZC, SSC etc., (Al-Harbi et al., 2008)
Due to its complex nature the proper selection of features are essential for classification. Many researchers uses time domain, frequency domain, time-frequency domain techniques for classification of signals. The various features extracted by different researchers are mean absolute value (MAV), variance (VAR), standard deviation (SD), zero crossing (ZC), waveform length (WL), Willson amplitude (WA), mean absolute value slope (MAVS), mean frequency (MNF), median frequency (MDF), slope sign change (SSC), cepstrum coefficients (CC), fast Fourier transform (FFT) coefficients, short time Fourier transform (STFT) coefficients, root mean square (RMS), autoregression (AR) coefficients, integrated EMG (IEMG), wavelet transform (WT) coefficients, and wavelet packet transform (WPT) coefficients. In this work the feature extracted are Mean absolute values, Root Mean Square Mean Frequency, Zero crossing, Slope Sign Change, Standard deviation. These features are extracted for every movements and the calculation is given below.
Mean Absolute Value (Mav)
It is the average rectified value (ARV) and can be calculated using the moving average of full-wave rectified EMG. More specifically, it is calculated by taking the average of the absolute value of EMG signal. It represents the simple way to detect muscle contraction levels. It is calculated as
Where N is the length of the signal and xnrepresents the EMG signal in a segment.
Root Mean Square (RMS)
It is represented as amplitude modulated Gaussian random process whose RMS is related to the constant force and non-fatiguing contraction. It can be expressed as
Variance of EMG (Var)
Standard Deviation (SD)
It can be used to find the threshold level of muscle contraction activity. The general equation used to find SD by
Where is the mean value of EMG signal
Mean Frequency (MNF)
The mean frequency is that frequency where the product of the frequency value and the amplitude of the spectrum is equal to the average of all such products throughout the complete spectrum.
Where is the frequency of the spectrum
Zero Crossing (ZC)
It is the number of times the amplitude values crosses the zero y-axis. It provides the approximate estimation of frequency domain properties. It can be calculated as
Slope Sign Change (SSC)
It is similar to ZC and another method to represent the frequency information of EMG signal. The number of changes between positive and negative slope among three consecutive segments are performed with the threshold function for avoiding the interference EMG signal. It can be calculated as
When the data set is loaded into the Weka suite, the window looks like as shown in the fig.1. (Giraud-Carrier et al., 2003). The details of the sample preprocessed data for all the 26 letters in the database is given below.
Processing images using different classifiers
All the attributes are all independent variables,for which we try and build a predictive model.Before doing so, we can use as many visualization on the data as necessary to see the relevent information in each attribute as shown in the Fig.2.
Fig.1. Values calculated for ISL Database
Compare values with different types of classifiers
Zero R
Zero R is the basic classification model and it does not do anything but classify all the instances into one class.We ask weka to run the model using the entire training set without splitting it into test and trainsets.As expected, the model will be inaccurate. The output of the weka file is as shown below diagram fig. 3
Least Med Sq
Implements a least median sqaured linear regression utilising the existing weka LinearRegression class to form predictions. Least squared regression functions are generated from random subsamples of the data. The least squared regression with the lowest meadian squared error is chosen as the final model.
Conjuctive Rule
weighted average of the mean-squared errors of both the data covered and not covered by the rule.
Desicion Table
Most existing scalable classification algorithms are decision tree based. Decision tree based algorithms consist of two phases: tree building and tree pruning. During the treebuilding phase, the training set is split into two or more partitions using an attribute (the splitting attribute). This process is repeated recursively until all (or most of) the examples in each partition belong to one class. Both the selection of the splitting attribute and the splitting points involve operations with high computational cost such as scanning the data, sorting and subset selection. Furthermore, since such operations are required at each internal node, they become the performance bottleneck of scalable classification.
SMDReg
SMOreg implements the support vector machine for regression. The parameters can be learned using various algorithms. The algorithm is selected by setting the RegOptimizer. The most popular algorithm (RegSMOImproved).
RBF
The initial centers for the Gaussian radial basis functions are found using WEKA's Simple K Means. The initial sigma values are set to the maximum distance between any center and its nearest neighbour in the set of centers. There are several parameters. The ridge parameter is used to penalize the size of the weights in the output layer. The number of basis functions can also be specified. Note that large numbers produce long training times. Another option determines whether one global sigma value is used for all units (fastest), whether one value is used per unit (common practice, it seems, and set as the default), or a different value is learned for every unit/attribute combination. It is also possible to learn attribute weights for the distance function. (The square of the value shown in the output is used) Finally, it is possible to use conjugate gradient descent rather than BFGS updates, which can be faster for cases with many parameters, and to use normalized basis functions instead of unnormalized ones. To improve speed, an approximate version of the logistic function is used as the activation function in the output layer. Also, if delta values in the back propagation step are within the user-specified tolerance, the gradient is not updated for that particular instance, which saves some additional time. Paralled calculation of squared error and gradient is possible when multiple CPU cores are present. Data is split into batches and processed in separate threads in this case. Note that this only improves runtime for larger datasets. Nominal attributes are processed using the unsupervised Nominal To Binary filter and missing values are replaced globally using Replace Missing Values.
Different Trees
Desicion Stump
Class for building and using a decision stump.Usually used in conjunction with a boosting algorithm.Does regression (based
on mean-squared error) or classification (based on entropy). Missing is treated as a separate value.
M5P
M5Base. Implements base routines for generating M5 Model trees and rules.
Gaussian Processes
Implements Gaussian processes for regression without hyperparameter-tuning. To make choosing an appropriate noise level easier, this implementation applies normalization/standardization to the target attribute as well (if normalization/ standardizationis turned on). Missing values are replaced by the global mean/mode. Nominal attributes are converted to binary ones
RepTree
Fast decision tree learner. Builds a decision/regression tree using information gain/variance and prunes it using reduced-error pruning (with back fitting). Only sorts values for numeric attributes once. Missing values are dealt with by splitting the corresponding instances into pieces
User Classifiers
Fig.2. Classification output using User Classifiers
predictive model. Before doing so, we can use as many visualization on the data as necessary to see the relevant information in each attribute as shown below in the diagram Fig. 4.
Fig.4. Visualize the data in Weka for ISL dataset
[image:5.595.42.296.125.416.2]The regression model output is near the expected value. To improve this occuracy, we also go for visualization to plot each of the independent variable against the dependent one and can see how the variation occurs. The relationship can be found to be inversely proportional as shown below in the diagram fig.16
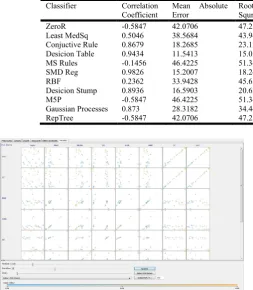
Fig.5. Performance evaluation of classifiers
Conclusion
Use of association rule for classification is novelapproach in data mining. Classification rules are just subsetof association rules. In this paper first association rules andthen class association rules are discovered they are prunedto get qualitative and sufficient classification rules. This approach
very helpful andefficient if there is an application where both kind ofknowledge is required (association among attributes andclassification of objects).
Further, this approach can becompared with other classification approaches like decisiontree, neural network, rule based classifiers etc. in terms ofaccuracy and efficiency.
REFERENCES
Abbot, D. W., Matkovsky, I. P., Elder IV, J. F., 1998. An Evaluation of High-end Data Mining Tools for Fraud Detection, IEEE International Conference on Systems, Man, and Cybernetics, San Diego, CA, October, pp. 12--14,
Al-Harbi, S., Almuhareb, A., Al-Thubaity, A., Khorsheed, S., and Al-Rajeh, A., 2008. “Automatic Arabic Text Classification”, 9th International journal of statistical analysis of textual data, pp. 77-83.
by Maximizing Conditional Likelihood”, 21st International Conference on Machine Learning, Banff, Canada.
Daniel Grossman and Pedro Domingos 2004, “Learning Bayesian Network Classifier
Eldin Henry Shroffe D, P. Manimegalai 2013. “HAND GESTURE RECOGNITION BASE ON EMG SIGNALS USING ANN” International Journal of Computer Application, Issue 3, Volume 2 April
Fayyad, U., Piatetsky-Shapiro, G., and Smyth, R 1996. "The KDD Process for Extracting Useful Knowledge from Volumes of Data," Communications of the ACM, (39:11), pp.27-34
Giraud-Carrier, C., and Povel, O., 2003. Characterising Data Mining software, Intelligent Data Analysis, v.7 n.3, p.181-192,
Carey, B., Marjaniemi, C., Sautter, D., Marjaniemi, C., A Methodology for Evaluating and Selecting Data Mining Software, Proceedings of the Thirty-second Annual Hawaii International Conference on System Sciences-Volume 6, January 05-08, 1999.
Hall, M., Frank, E., Holmes, G., Pfahringer, B., Reutemann P., Witten, I., H., 2009. The WEKA data mining software: an update, ACM SIGKDD Explorations Newsletter, v.11 n.1, June (doi>10.1145/1656274.1656278).
Han, J., Kamber, M., Jian P., 2011. Data Mining Concepts and Techniques. San Francisco, CA: Morgan Kaufmann Publishers.
Table 1. Confusion matrix for comparative study for all the classifiers for ISL dataset
Classifier Correlation
Coefficient
Mean Absolute Error
Root Mean Squred error
Relative Absolute Error
Root relative squred error
Total No of instances
ZeroR -0.5847 42.0706 47.2311 100 100 25
Least MedSq 0.5046 38.5684 43.9437 91.6755 93.033 25
Conjuctive Rule 0.8679 18.2685 23.1273 43.4234 48.9664 25
Desicion Table 0.9434 11.5413 15.0375 27.4332 31.8381 25
MS Rules -0.1456 46.4225 51.3487 110.3442 108.718 25
SMD Reg 0.9826 15.2007 18.2486 36.1314 38.6369 25
RBF 0.2362 33.9428 45.6562 80.6805 96.6656 25
Desicion Stump 0.8936 16.5903 20.6247 39.4346 43.6676 25
M5P -0.5847 46.4225 51.3487 110.3442 108.718 25
Gaussian Processes 0.873 28.3182 34.4482 67.3113 72.9355 25
[image:5.595.42.291.516.643.2]Hornik, K., Buchta, C., Zeileis, A., 2009. Open-Source Machine Learning: R Meets Weka, Journal of Computational Statistics - Proceedings of DSC 2007, Volume 24 Issue 2, May (doi>10.1007/s00180-008-0119-7). Hunyadi, D., Rapid Miner E-Commerce, Proceedings of the 12th WSEAS International Conference on Automatic Control, Modellingand Simulation, 2010.
Joyeeta Singha, Karen Das 2013. “Hand Gesture Recognition Based on Karhunen-Loeve Transform” Mobile and Embedded Technology International Conference.
King, M., A., and Elder, J., F., 1998. Evaluation of Fourteen Desktop Data Mining Tools, in Proceedings of the 1998 IEEE International Conference on Systems, Man and Cybernetics.