http://dx.doi.org/10.4236/ns.2012.45038
The density profiles of dark matter halos in spiral
galaxies
Gianluca Castignani1,2, Noemi Frusciante1,2, Daniele Vernieri1,2*, Paolo Salucci1,2 1SISSA-ISAS, International School for Advanced Studies, Trieste, Italy; *Corresponding Author: [email protected] 2INFN, Istituto Nazionale di Fisica Nucleare, Sezione di Trieste, Trieste, Italy
Received 19 January 2012; revised 18 February 2012; accepted 5 March 2012
ABSTRACT
In spiral galaxies, we explain their non-Keplerian rotation curves (RCs) by means of a non-lumi- nous component embedding their stellar-gase- ous disks. Understanding the detailed properties of this component (labelled Dark Matter, DM) is one of the most pressing issues of Cosmology. We investigate the recent relationship (claimed
by Walker et al. 2010, hereafter W + 10) between r,
the galaxy radial coordinate, and Vh(r), the dark
halo contribution to the circular velocity at r, 1) in
the framework of the Universal Rotation Curve (URC) paradigm and directly 2) by means of the kinematics of a large sample of DM dominated spirals. We find a general agreement between the W + 10 claim, the distribution of DM emerging from the URC and that inferred in the (low lumi-nosity) objects of our sample. We show that such a phenomenology, linking the spiral’s luminosity, radii and circular velocities, implies an evident
inconsistency with (naive) predictions in the Λ
Cold Dark Matter (ΛCDM) scenario.
Keywords:Galaxies; Spiral; Kinematics and
Dynamics; Dark Matter
1. INTRODUCTION
Rotation curves (RCs) of spiral galaxies show no asy- mptotic Keplerian behavior and fail to match the dis- tribution of the luminous matter. The favored explanation is the existence of an unknown unseen component, the Dark Matter (DM): the “luminous” components of gala- xies such as gas and stars are distributed inside a sphe- rical “dark” halo1.
Recently, [2], hereafter W + 10, following the pioneer paper of [3] (M + 07), found that the dark component of the circular velocity (and of mass) profile shows a chara- cteristic and similar behavior both in Spirals (and in Milky Way dSphs) of very different luminosities. More
precisely, they investigated a sample of 60 spirals, whose RCs span radii from 1 kpc to 75 kpc, have maximum amplitudes in the range
and their baryonic masses b
1 1
max
50 km s V 300 km s
M ranging between and . They derived , the halo contributions to the circular velocity (in short the “halo RCs”), by subtracting the contribution of the baryonic matter from the circular velocity:
(see W + 10 for details). They found a correlation between
8 3 10
h V r
2( ) = 2( ) 2( )
h b
V r V r V r
M⊙
11 4 10 M⊙
h
V r and r (see W + 10):
0.15 0.19 1
( )
log = 1.47 0.5log
kpc km s
h
V r r
(1)
independently of galaxy luminosity. Moreover:
2
2 8
1.2 ( )
= 2 10 .
kpc
h
M r r
M
⊙
Noticeably, at r=R1/ 2, be-
ing 1/ 2 the radius encompassing half of the stellar
mass, the relation (1) can be investigated also in dwarf spheroidals, and found to hold also in these systems (see W + 10 for details).
R
These are surprising findings: in fact, when, in objects of very different luminosity we derive their (the
dark halo-contribution to the circular velocities) and plot them as a function of radius, a well defined curve em- erges, instead of a more likely scatter plot. On the other hand, the circular velocities show a very different phenomenology. From the analysis of several thousands of RCs, an Universal Rotation Curve (URC) emerges, i.e. a specific 3-dimensional surface linking 1) the circular velocity at a normalized radius
( )
h V r
( )
V r
D
r R (i.e. measured in units of disk length-scale), 2) the galaxy luminosity and 3), the normalized radius (see [4,5] (PSS), [6-8] (S + 07) for details).
Summarizing, in the intermediate regions of spirals, W + 10 found: W 10 , independently of galaxy
luminosity L and stellar disk length-scale V rh( ) =F ( )r RD. In the URC scenario, instead, we have: V rh( ) =FURC
r R LD,
,i.e. the halo component of the circular velocity is a function of disk luminosity and disk length scale. Let us stress that the existence of the URC implies that the stru- ctural parameters of the Dark and Luminous components are strongly related, but not necessarily, through the very 1A thorough review on this issue can be found in [1] and downloaded at
constraining Eq.1.
In this paper, we investigate whether these two appa- rently different results are compatible. We also use the outcome to derive important information on the DM dis- tribution in spirals. We will study an independent (larger) sample of spirals by means of reliable method of mass modelling. From [9] (PS95) we select 116 spiral galaxies (hereafter Sample A) whose RCs satisfy the following requirements: a) no presence of a prominent bulge:
0.2
< 50 km s 1opt R
V 2, or if the latter is missing:
0.4R
< 70 km s 1V
opt
1
, b) low luminosity objects:
< 120 km s
V r
> 20.2
I
M , with , at any radius, that implies: MI the magnitude in the I band, c) the RCs have a measure either at 0.8 opt or at 1.0 opt.
Let us notice that we limit ourselves to objects of low luminosity, in that they are DM dominated (e.g. [11] (PS90)) and therefore can be derived with great accuracy. Higher luminosity spirals are disk dominated and therefore strongly depends on the details and on the assumptions in the mass modelling. The RCs of Sample A have a radial range matching that of W + 10
R R ( ) h V r ( ) h V r
sample max 1 ,1 kpc 6
3RD r D
R . Following W + 10,
we adopted 1 kpc as the innermost radius in that, inside which, the stellar disk (sometimes with a stellar bulge) dominates the gravitational potential making difficult the estimate of V rh( ).
Let us compare the W + 10 relationship with the URC analogue (PSS, S + 07) and with that we derive for Sample A. From the condition of centrifugal equilibrium we have:
2( ) = 2 ( ) 2( )
lum h
V r V r V r (2) where the subscripts lum and h stand respectively for luminous and halo components. The former is the qua- dratic sum of disk, bulge and gas contributions. Here, we neglect the latter two because 1) the selected low lumi- nosity objects have, for r > 1 kpc, a negligible bulge, 2) the gaseous disk is important only for , i.e. outside the region that we are considering here (see [12]). For the objects of Sample A, each RC has 2 - 4 independent measurements (see Table 2 of PS95) and therefore the same number of halo velocity data. For the URC, there is analytical formula for Vh(r) (see below). Hereafter, we adopt
a flat cosmology with matter density parameter > opt
r R
0.27
M
and Hubble constant s1Mpc1.
0 = 75 km
H
2. THE CONTRIBUTION OF DARK
MATTER HALOS TO THE CIRCULAR
VELOCITY OF SPIRALS
We derive the velocity halo contribution for the objects
of Sample A in the following way; we assume a Freeman profile to describe the stellar disk surface density, then [10]:
2 2 2
0 0 1 1 1.6
( ) = 14.9 ( ) (1.0)
D x
V x x V x I K I K (3)
where x r R opt, In and Kn are the modified Bessel
functions. Let us also notice that: R1/21.67 3.2Ropt
0.52Ropt.
The mass modelling of individual (and co- added) RCs of objects of low luminosity (as those in Sample A) is rather simple. We have: (1) 0.13 and
(0.8) 0.23
(see PS90 and PSS). More precisely, there is a small luminosity dependence of but for the objects in Sample A this is irrelevant. Then, for any ob- ject, we derive by subtracting the (small) disk contribution , given by Eq.3, from the circular
velocity . Finally, we derive by li- nearly interpolating ( ) h V r ) r 2 D V r ( 2
V ( ) V Rh
1/ 2
0.4Ropt
h
The URC leads to an (analytical) Universal form for , i.e. for the halo velocity component (URCH) to
V and Vh
0.6Ropt
.( )
h
V r
URC
V r which was built by coadding the kinematics of thousands of galaxies (PSS, S + 07). We model the URC, that represents the typical RC of an object of magnitude
I
M , (or of virial halo mass Mvir (see S + 07 and re-
ference therein) in its dark and luminous components (e.g. S + 07)3).
The W + 10 halo velocity-radius relationship (black line) with its 1 scatter (black dashed lines) com- pared with the halo velocity calculated at 1/2 as
function of 1/2 for 1) our Sample A whose points are
calculated by interpolating and
R R
0.4 opth R
V
Vh
0.6Ropt
for each galaxy (black points) and 2) URCH profiles (red line).
In detail the URC DM density profile is
3 0 0 2 2 0 0 ( ) URCH r rr r r r
(4)
where r0 is the core radius and 0 is the central halo
density. It follows that:
3
2 0 0
0 0
2
2 0
( ) 6.4 ln 1 arctan
1 ln 1
2
URCH
r r r
V r r r r r r (5)
From [14] we have:
124 3
0 5 10 r0 8.6 kpc g cm
(6)
and
0
11 log 0.66 0.58log
kpc 10 vir r M M ⊙ (7)
3The virial mass Mvircorresponds to the mass enclosed in a sphere with
density 101 ρc, being ρc the critical density of the Universe. Mvirand the
virial radius are related by 259
1012 1/3vir vir
R M M⊙
2Ropt is the radius encircling 83% of the light, for a Freeman exponential
The disk length-scales and masses, RD and MD, are
related to the halo masses through (see [15] and S + 07)
11
2
11 log 0.633 0.379 log
kpc 10
0.069 log 10
D D
D
R M
M
M M
⊙
⊙
(8)
and
3.1 11 10
2.2 11
3 10 = 2.3 10
1 3 10
vir D
vir
M M
M M
M M
⊙ ⊙
⊙
(9)
By means of Eqs.4-9 we can derive, the URCH halo
velocity URC
,
h D
V r R L .
The first step is to investigate the - 1/ 2
relationship, that holds also for objects of different Hu- bble types. In Figure 1 we plot the URCH as a red line
and the relation for Sample A as black points. It is clear that both individual and URC halo velocities do correlate with 1/ 2, well matching the W + 10 (M + 07) relation
(shown as black line).
1/ 2
hV R R
R
The further step is to investigate the full profile V rh( )
at “intermediate radii” max 1 ,1 6 3RD kpc r RD
. Each
of the 116 spirals contributes with 2 - 4 independent kinematical measurements. In Figure 2 we plot
obtained from the RCs of Sample A, once that the lumi- nous component has been removed as explained above.
( )
h V r
The W + 10 halo velocity-radius relationship (black line) with its 1 scatter (black dashed lines) plotted with 1) the halo velocities of our Sample A of 116 spirals (black points) (PSS, PS90), 2) the URCH profiles (red lines), corresponding to objects with mass comparable with those in the W + 10 sample. The error (of 20%) in the individual determination of h is shown as an errorbar.
We also plot, as two red lines, the URCH velocity profiles of spirals with luminosities similar to those of the objects of Sample A4, and to the great majority of the
60 spirals of the W + 10 sample. Notice that, given the Schechter-like form of the luminosity function of spirals, in the W + 10 sample there are only an handful of big galaxies.
V
In the low luminosity range we plot for the individual RCs of Sample A (black points) and for the corresponding URCH profiles, and compare them with the W + 10 relationship. Let us recall that we did not in- vestigate the individual of luminous spirals since their dark-luminous RC decomposition is quite uncertain. However, we have investigated the high luminosity ob- jects by means of the URCH, that we show in Figure 3
alongside with the W + 10 relationship. Summarizing, ( )
h V r
( )
[image:3.595.309.540.83.310.2] [image:3.595.55.286.113.247.2]h V r
Figure 1. The W + 10 halo velocity-radius relationship (black line) with its 1-s scatter (black dashed lines) compared with the halo velocity calculated at R1/2 as function of R1/2 for 1) our Sample A whose points are calculated by interpolating Vh(0.4Ropt)
and Vh(0.6Ropt) for each galaxy (black points) and 2) URCH
profiles (red line).
Figure 2. The W + 10 halo velocity-radius relationship (black line) with its 1-s scatter (black dashed lines) plotted with 1) the halo velocities of our Sample A of 116 spirals (black points) (PSS, PS90), 2) the URCH profiles (red lines), corresponding to objects with mass comparable with those in the W + 10 sam- ple. The error (of 20%) in the individual determination of Vhis
shown as an errorbar.
for spirals in halos with > 1.9 1012
vir
M M⊙, we derive by means of the URCH, for halos of lower mass, ( )
h V r
4The related virial masses are 1.17 1011
vir
M M⊙ , .
11
[image:3.595.310.540.391.619.2]instead, we derive from 1) the URCH (red lines) and 2) the mass modelling of the individual RCs of Sample A (black points). In both cases, the (derived) halo velocities are compared with the W + 10 relationship.
( )
h V r
3. UNIVERSAL HALO VELOCITY
PROFILE AND IMPLICATIONS
We find for Sample A and also from the URC, that: , very similar to the W + 10 relation. This result is not a new one, it arises as effect of the particular dependencies of the dark and luminous structural para- meters on luminosity and disk length scale. We can show this by looking at the Radial Tully Fisher relation ([16]). From their Eq.9 one has , where
0.5 1/ 2 1/ 2h
V R R
2.55 1/ 2I
L V R LI is
the I-band luminosity, considering that for spirals we have: 1/ 2 D , and that from the mass modell- ing of individual objects
0.5
L
R R
R1/ 2
0.2 1/ 2 1/ 2V R V R V
1/ 2
1/ 2kh
V R R k
0.5
h h
(see PS90, [17,18], i.e. smaller galaxies have a larger fraction of DM), one arrives to , with very near to the value of , claimed by W + 10 (see
Figure 1).
However, with the complete data from the URC shown in Figure 4 we realize that in Spirals of
different luminosities, has not an unique profile, neither always it is a power law with exponent 1/2. However, at low luminosities, the halo velocity individual contribu- tions and the URCH profiles are in good agreement with the W + 10 result (see also M + 07).
( )
h
V r
At highest luminosities (see Figure 4) the W + 10
relationship cannot be reproduced by the URCH profiles. However let us stress that in these cases depend significantly (especially in the W + 10 work) on the
( )
h
V r
Figure 3. The W + 10 halo velocity-radius relationship (black line) with its 1 – σ scatter (black dashed lines) plotted with the URCH profiles (red lines).
assumptions adopted in the mass modelling. Moreover, the URCH profiles are obtained from hundreds of RCs, while V rh( ) in W + 10 only from few (see W + 10).
As a result, in a first approximation we can claim that the W + 10 relationship, in the radial range 1 kpc
30
r
kpc, is a projection, on the (r, ) axes of a more complex
( )
h
V r
opt,
URC r R L
V relationship in which the structural quantities VURC(1, )L , L and RD are re-
lated in a specific way. This suggests the existence of a number of scaling laws between disk scalenghts, disk mass, halo structural parameters and galaxy luminosity, which by the way have been also observed through the analysis of accurate mass models in large samples of galaxies (e.g. S + 07).
The W + 10 relation URC-supported, becomes very useful to test whether DM halos in spirals are consistent with NFW density profile. In this case let us remind that (see [19]):
2 ( ) 2 ( )
( )
NFW vir
g c
V r V
xg cx
(10)
where x r R vir is the radial coordinate,
1( ) ln 1 1
g c c c c
, and for the concentration parameter we take c
= 9.2 1012 1 0.09vir vir
M c M
h M
⊙
(11)
(see [1,20]). The halo mass inside a radius r is given by:
( ) ( )
( )
NFW vir
g c
M x M
g cx
(12)
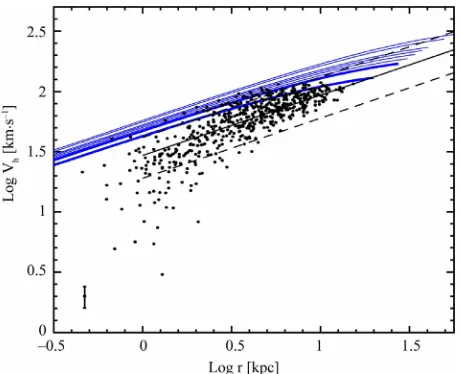
In Figure 4 we plot VNFW
r M, vir
for the radial andhalo mass ranges identical with those investigated above (more specifically we consider 8 masses equally log- spaced in the range: 7.7 1011 1.1 1013
vir
M M
⊙ ).
The W + 10 halo velocity-radius relationship (black line) with its 1 scatter (black dashed lines) plotted with 1) the halo velocities of our Sample A of 116 spirals (black points), 2) the NFW halo velocity profiles (blue lines, with the thick curves corresponding to objects with mass comparable with those of the individual Sample).
The resulting halo velocity curves occupies a very well defined portion in the (r, ) plane (blue lines). However, this region is mostly off that defined by 1) the W + 10 relationship, 2) the similar relationship derived in this paper by a larger number of individual RCs (of low luminosity objects) and 3) a specific pro- jection of the URCH (given in Figure 2). A disagreement
of the NFW halo velocity profiles with the actual kine- matics of spirals is not new (e.g. [21]). However, here, we make a step further by investigating an unprece- dented large number of low luminosity objects. We de-
( )
NFW
V r
( )
[image:4.595.58.288.497.698.2]rive their profiles from disk kinematics by adopt- ing only weak and reasonable assumptions. These pro- files result incompatible with the NFW profiles for any value of their masses and their concentrations.
( )
h V r
4. DISCUSSION
We have compared the W + 10
V Rh
1/ 2
R1/ 2
(
h
V r
re- lationship (see also M + 07), with the URCH and with the kinematics of 116 spirals of low luminosity objects. We find that the W + 10 “unique” velocity profile is essentially in agreement with the URC paradigm of which it is a sort of projection. The W + 10 relation alongside its not negligible scatter of 0.25 dex, can be identified as the projection of the URC on the (r, ) plane. This implies the existence of a number of scaling laws between disk scalenghts, disk mass, halo structural parameters and galaxy luminosity, observed also analyz- ing accurate mass models in large samples of galaxies.
)
We claim that the distribution of dark and luminous matter in galaxies is such that at any chosen radius r,
takes, in different galaxies of different mass, almost the same value. The simplest explanation is that the more massive is the dark halo, the lesser dense and concentrated it turns out to be. The net effect is that the dark mass inside a chosen physical radius is weakly dependent of the total halo mass. The physical expla- nation of this still lags: we realize that the dark and the luminous matter are distributed in a related way, which is not obvious, in view of their very different nature. It is worth to point out that the URCH profiles for virial masses
( )
h
V r
12
10 > 3 vir
M M⊙, are discrepant with the W + 10 relationship, also considering its (quite large) scatter (see Figure 3). Although in the W + 10 sample there is
an obvious shortage of such big objects, it would seem that for the about 5% top luminous objects, the halo velocity profile implied by W + 10 does not agree with the URC mass model and it indicates a larger amount of DM. This issue will be clarified only with a bigger sam- ple of individual RCs. At low masses, low circular velocities and low radii (1 kpc r 30 kpc), we find the existence of an “unique” h profile whose physical meaning has to be understood. This is amazing in that by adopting the radial units, i.e. kpc, we lose any autosimilarity of the velocity/mass profiles, present when the radial coordinate is measured in terms of vir or
<
V (r)
<
R
D
[image:5.595.311.541.82.269.2]R . We can use the W + 10 relationship as a Cosmology Test: in fact, when plotted in radial physical units, the NFW velocity profiles lie in a very small region, almost independently of their halo masses and concentration. Such a region, however, turns out to be clearly outside that indicated by the derived halo velocity profiles in W + 10, in the URCH and in our sample of individual RCs. Especially at low luminosities, where the NFW velocities are 0.2 - 0.4 dex higher, the observed discrepancy is very
Figure 4. The W + 10 halo velocity-radius relationship (black line) with its 1 – σ scatter (black dashed lines) plotted with 1) the halo velocities of our Sample A of 116 spirals (black points), 2) the NFW halo velocity profiles (blue lines, with the thick curves corresponding to objects with mass comparable with those of the individual Sample).
severe in that, being the contribution of the luminous ma- tter quite negligible, is virtually derived in a model independent way, and it almost coincides with the observed . Of course, the inconsistency between RCs and NFW halo + disk mass model is already well known, even if it is proved only in a quite limited num- ber of test cases ([22]). Here we have opened the possi- bility to investigate such a crucial issue in direct way and by means of a large number of objects. It is worth re- calling that also within ΛCDM scenario there are se- veral ways to modify the original NFW halo profiles to be compatible with observations, see [23-25] and refe- rences therein.
( )
h
V r
( )
V r
REFERENCES
[1] Salucci, P., Martins, C.F. and Lapi, A. (2011) DMAW 2010 LEGACY the presentation review: Dark matter in galaxies with its explanatory note. arXiv:1102.1184v1. [2] Walker, M.G., McGaugh, S.S., Mateo, M., Olszewski,
E.W. and Kuzio de Naray, R. (2010) Comparing the dark matter halos of spiral, low surface brightness, and dwarf Spheroidal galaxies. Astrophysical Journal Letters, 717, L87-L91. doi:10.1088/2041-8205/717/2/L87
[3] McGaugh, S.S., De Blok, W.J.G., Schombert, J.M., Kuzio de Naray, R. and Kim, J.H. (2007) The rotation velocity attributable to dark matter at intermediate radii in disk galaxies. Astrophysical Journal, 659, 149-161.
doi:10.1086/511807
[4] Persic, M. and Salucci, P. (1991) The universal galaxy rotation curve. Astrophysical Journal, 368, 60-65.
doi:10.1086/169670
rotation curve of spiral galaxies—I. The dark matter con-nection. Monthly Notices of the Royal Astronomical Soci-ety, 281, 27-47.
[6] Catinella, B., Giovanelli, R. and Haynes, M.P. (2006) Template rotation curves for disk galaxies. Astrophysical Journal, 640, 751-761. doi:10.1086/500171
[7] Rhee, G., Valenzuela, O., Klypin, A., Holtzman, J. and Moorthy, B. (2004) The rotation curves of dwarf galaxies: A problem for cold dark matter? Astrophysical Journal, 617, 1059-1076. doi:10.1086/425565
[8] Salucci, P., Lapi, A., Tonini, C., Gentile, G., Yegorova, I. and Klein, U. (2007) The universal rotation curve of spi-ral galaxies—II. The dark matter distribution out to the virial radius. Monthly Notices of the Royal Astronomical Society, 378, 41-47.
doi:10.1111/j.1365-2966.2007.11696.x
[9] Persic, M. and Salucci, P. (1995) Rotation curves of 967 spiral galaxies. Astrophysical Journal Supplement, 99, 501. doi:10.1086/192195
[10] Freeman, K.C. (1970) On the disks of spiral and so gal-axies. Astrophysical Journal, 160, 811.
doi:10.1086/150474
[11] Persic, M. and Salucci, P. (1990) Mass decomposition of spiral galaxies from kinematics. Monthly Notices of the Royal Astronomical Society, 245, 577.
[12] Evoli, C., Salucci, P., Lapi, A. and Danese, L. (2011) The HI content of local late-type galaxies. Astrophysical Jour- nal, 743, 45. doi:10.1088/0004-637X/743/1/45
[13] Eke, V.R., Cole, S. and Frenk, C.S. (1996) Cluster evolu-tion as a diagnostic for Omega. Monthly Notices of the Royal Astronomical Society, 282, 263-280.
[14] Donato, F., Gentile, G., Salucci, P., Frigerio Martins, C., Wilkinson, M.I., Gilmore, G., Grebel E.K., Koch, A., and Wyse, R. (2009) A constant dark matter halo surface den-sity in galaxies. Monthly Notices of the Royal Astronomi-cal Society, 397, 1169-1176.
doi:10.1111/j.1365-2966.2009.15004.x
[15] Shankar, F., Lapi, A., Salucci, P., De Zotti, G. and Danese, L. (2006) New relationships between galaxy properties and host halo mass, and the role of feedbacks in galaxy formation. Astrophysical Journal, 643, 14-25.
doi:10.1086/502794
[16] Yegorova, I.A. and Salucci, P. (2007) The radial Tully- Fisher relation for spiral galaxies I. Monthly Notices of the Royal Astronomical Society, 377, 507-515.
doi:10.1111/j.1365-2966.2007.11637.x
[17] Persic, M. and Salucci, P. (1990) The disk contribution to rotation curves of spiral galaxies. Monthly Notices of the Royal Astronomical Society, 247, 349.
[18] Salucci, P., Ashman, K. and Persic, M. (1991) The dark matter content of spiral galaxies. Astrophysical Journal, 379, 89-93. doi:10.1086/170485
[19] Navarro, J.F., Frenk, C.S. and White, S.D.M. (1996) The structure of cold dark matter halos. Astrophysical Journal, 462, 563. doi:10.1086/177173
[20] Klypin, A.A., Trujillo-Gomez, S. and Primack, J. (2011) Dark matter halos in the standard cosmological model: Results from the bolshoi simulation. The Astrophysical Journal, 740, 102. doi:10.1088/0004-637X/740/2/102 [21] Gentile, G., Salucci, P., Klein, U., Vergani, D. and
Kal-berla, P. (2004) The cored distribution of dark matter in spiral galaxies. Monthly Notices of the Royal Astronomi-cal Society, 351, 903-922.
doi:10.1111/j.1365-2966.2004.07836.x
[22] Salucci, P. and Frigerio Martins, C. (2009) The mass distribution in Spiral galaxies. EAS Publications Series, 36, 133-140. doi:10.1051/eas/0936018
[23] Maccio, A.V., Stinson, G., Brook, C.B., Wadsley, J., Couchman, H.M.P., Shen, S., Gibson, B.K. and Quinn, T. (2012) Halo expansion in cosmological hydro simulations: towards a baryonic solution of the cusp/core problem in massive spirals. The Astrophysical Journal Letters, 744, L9. doi:10.1088/2041-8205/744/1/L9
[24] Governato, F., Brook, C., Mayer, L., Brooks, A., Rhee, G., Wadsley, J., Jonsson, P., Willman, B., Stinson, G., Quinn, T. and Madau, P. (2010) Bulgeless dwarf galaxies and dark matter cores from supernova-driven outflows. Na-ture, 7278, 203-206. doi:10.1038/nature08640
[25] Tonini, C., Lapi, A. and Salucci, P. (2006) Angular mo-mentum transfer in dark matter halos: Erasing the cusp.
The Astrophysical Journal, 649, 591-598.