A Journal of Software Engineering and Applications, 2012, 5, 101-106
doi:10.4236/jsea.2012.512b020 Published Online December 2012 (http://www.scirp.org/journal/jsea)
A Combination of Feature Selection and Co-occurrence
Matrix Methods for Leukocyte Recognition System
Lina, Arlends Chris, Bagus Mulyawan
1
Faculty of Information Technology, Tarumanagara University, Jakarta, Indonesia; 2Faculty of Medicine, Tarumanagara University, Jakarta, Indonesia.
Email: [email protected]
Received 2012.
ABSTRACT
A leukocyte recognition system, as part of a differential blood counter system, is very important in hematology field. In this paper, the propose system aims to automatically classify the white blood cells (leukocytes) on a given microscopic image. The classifications of leukocytes are performed based on the combination of color and texture features of the blood cell images. The developed system classifies the leukocytes in one of the five categories (neutrophils, eosinophils, basophils, lymphocytes, and monocytes). In the preprocessing stage, the system starts with converting the microscopic images from Red Green Blue (RGB) color space to Hue Saturation Value (HSV) color space. Next, the system splits the Hue and Saturation features from the Value feature. For both Hue and Saturation features, the system processes their color information using the Feature Selection method and the Window Cropping method; while the Value feature is processed by its texture information using the Co-occurrence matrix method. The final recognition stage is performed using the Euclidean distance method. The combination of the Feature Selection and Co-occurrence Matrix methods gives the best overall recognition accuracies for classifying leukocyte images.
Keywords: Leukocyte recognition; White blood cell; Microscopic image; Feature selection;Co-occurrence matrix.
1.
Introduction
One of important issues in hematology is how to accu-rately diagnose the hematopoietic system disorders. While the manual screening and evaluation by a hema-tologist using a microscope is relatively accurate, it is a highly complex and time consuming task.
The blood elements include erythrocytes (red cells), leukocytes (white cells), and platelets. Red blood cells are the most numerous blood cells in the blood and are re-quired for tissue respiration [1]. In contrast to red cells, normal white blood cells are nucleated and include neu-trophils, lymphocytes, monocytes, eosinophils, and ba-sophils [2]. White blood cells serve in immune function. Meanwhile, platelets function in coagulation and hemos-tasis.
The blood cell reports from a medical laboratory can be categorized into two areas: 1) standard count for red blood cells, white blood cells, and platelets, and 2) differential count for white blood cells. The hematologists will also need to detect blood disorder and the leukocyte count is used to determine the presence of an infection in the hu-man body. Since the task is very tedious and really time consuming, an automated system is necessary and helpful.
Several researchers have proposed various methods to
recognize the white blood cells. However, up to now no automatic system exists that could recognize and count the blood cells with the accuracy comparable to the hu-man expert [3]. Some attempts to solve this problem have been proposed, such as the work by Markiewicz using the Support Vector Machine method [2-3], Colunga with EM algorithm [4], and Neural Network-based classifiers [5-6].
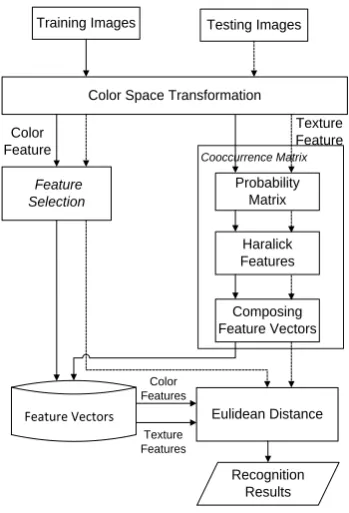
In this paper, the leukocyte recognition system is de-veloped using the combination of the Feature Selection and the Co-occurrence matrix methods. The proposed system works based on the similarity of image color and texture. In the first stage, each pixel of RGB (Red, Green, Blue) images is transformed into HSV (Hue, Saturation, Value) color space. Next, Hue and Saturation are processed as color features, while Value, as a texture part, is processed using the Cooccurrence matrix method. Fi-nally, the Euclidean distance method is applied to the system for recognition.
the Co-occurrence matrix method for processing texture characteristics, and the Euclidean distance method for recognition. Section 3 presents the experimental setup and results. Finally, the conclusion is presented in sec-tion 4.
Training Images
Feature Selection
Haralick Features Color Space Transformation
Probability Matrix
Eulidean Distance Feature Vectors
Recognition Results
Texture Feature Color
Feature
Cooccurrence Matrix
Composing Feature Vectors Testing Images
Color Features
[image:2.595.82.257.162.419.2]Texture Features
Figure 1. The proposed leukocyte recognition system.
2.
The Leukocyte Recognition System
2.1.
RGB to HSV Color Space Transformation
In the developed system, a color space transformation from RGB domain to HSV domain is performed in the pre-processing stage. The HSV (Hue, Saturation, Value) defines a common color space which is popular in graphic applications. The HSV color space is preferred over the RGB (Red, Green, Blue) color space due to its ability to be more perceptually relevant than the RGB cartesian representation. The HSV color range is con-sisted of 3 elements: 1) Hue which corresponds to color intensity, 2) Saturation which corresponds to lightness (white and monochromatics colors), and 3) Value which corresponds to brightness level.
To convert an image from RGB [0,1] color space to HSV (H,S[0,1], V[0-360º]) color space, we essentially follow the steps listed below:
) , , (
Max R G B
V = (1)
V B) G, (R, Min -V
=
S (2)
If Max = R, thenH x60 Min Max
B G
− −
= (3)
If Max = G, then H
(
2)
x60 Min MaxR B
− − +
= (4)
If Max = B, then H
(
4)
x60 Min MaxG R
− − +
= (5)
with H=Hue, S=Saturation, V=Value, R=intensity of red pixel, G=intensity of green pixel, B=intensity of blue pixel.
2.2.
Feature Selection Method
Feature selection aims to reduce the dimension of the input image. With feature selection, the system chooses and will only process the selected features for recogni-tion process. In order to reduce the dimension of the col-or features, we propose two steps of reduction: 1) process only the Hue and the Saturation values, and 2) compose small size windows for each feature.
[image:2.595.315.536.448.583.2]In the first step, several 4x4 pixels windows are created and arranged not to be overlapped with each other in a single image. Next, sum each window values and calcu-late its average for both Hue and Saturation images. These average Hue and Saturation values are then processed for the recognition stage. Figure 2 illustrates the feature selection process of an image.
Figure 2. The feature selection process of an image.
2.3.
Window Cropping Method
A Combination of Feature Selection and Co-occurrence Matrix Methods for Leukocyte Recognition System 103
training images. Then, the image with a larger size will be cropped according to the minimum size between those images.
2.4.
Co-occurrence Matrix Method
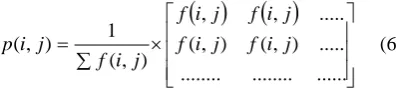
For processing the texture information of the microscop-ic images, the Co-occurrence Matrix method is applied. A co-occurrence matrix is constructed by clustering the gray-scale values of an image. Such matrix is derived from the angular relationship between the neighboring pixels as well as the distances between them. The higher the color intensity of an image, the larger size of co-occurrence matrix can be obtained. First, the proba-bility value p(i,j) of the color frequency f
( )
i,j of index pair i and j is calculated by [7]: [image:3.595.85.284.282.327.2]( )
( )
× ∑ = ... ... ... ... ) , ( ) , ( ... , , ) , ( 1 ) ,( f i j f i j
j i f j i f j i f j i
p (6)
Next, the characteristic values, known as the Haralick features, are obtained by processing the probability val-ues of the co-occurrence matrix. In the proposed system, five characteristic features are processed, i.e. entropy, contrast, homogeneity, energy, and correlation.
Entropy is used to measure the randomness of intensity distributions. The entropy value is calculated by:
( )
( )
∑ ∑ − = = = I i J j j i p j i p Entropy 0 0 , log,
(7)
Another feature is the image contrast which is used to measure the power of intensity differences in an image. The contrast value is calculated by:
(
) ( )
∑ ∑ − = = = I i J j j i p j i Contrast 0 0 2,
(8)
The homogeneity which calculates the uniformity of intensity variations in an image, is the contrary of the image contrast. The equation for calculating the homogeneity is as follows:
( )
∑ ∑ − + = = = I i Jj i j
j i p y
Homogeneit
0 01
,
(9)
Moreover, energy, as the fourth features, is used to measure the texture uniformity. The energy value is cal-culated by:
( )
(
)
∑ ∑ = = = I i J j j i P Energy 0 0 2,
(10)
Finally, the correlation value is used to describe the
re-lations between each pixel value with its neighbors. The correlation value is calculated by:
y x y x j i p ij n Correlatio i i jj
σ
σ
µ
µ
∑ ∑ −
= =0 =0[( ) ( , )]
(11)
2.5.
Euclidean Distance
As the final stage, in the recognition process, the dissi-milarities between the testing images with the training images are calculated using the Euclidean distance mea-surement, as follows [7]:
r = ||x−w || (12)
with r is the Euclidean distance between x as the testing vector and w as the training vector. A small r value indicates a high similarity of two images.
3.
Experimental Setup and Results
We have conducted several experiments to test the rec-ognition ability of the proposed system. We created our own blood cells images and developed the FTI-Untar blood cells database. Figure 3 shows the examples of each leukocyte type image that are used in the experiments.
The FTI-Untar blood cells database consists of two da-tasets: 1) Dataset 1, consists of 500 blood cells images, with 266 neutrophils images, 122 lymphocytes images, 94 monocytes images, 13 eosinophils images, and 5 baso-phils images; and 2) Dataset 2, which contains 135 neu-trophils images, 52 lymphocytes images, 43 monocytes images, 5 eosinophils images, and 5 basophils images.
In the experiments, 80% of images from the database are used as training data, and the remaining data is used for testing. We conducted various experiments with various targets. First, we evaluated the performance of the com-bination of the Feature Selection the Co-occurrence ma-trix methods and the combination of the Window Crop-ping and the Co-occurrence matrix methods with two different window sizes: 1) 47x47 pixels, and 2) 57x57 pixels.
(a) (b) (c) (d) (e)
[image:4.595.89.508.98.274.2]
(f) (g) (h) (i) (j)
Figure 3. The examples of each type of white blood cells: (a) Neutrophils, (b) Lymphocytes, (c) Monocytes, (d) Eosinophils, (e) Basophils, (f) cropped Neutrophils, (g) cropped Lymphocytes, (h) cropped Monocytes, (i)
[image:4.595.72.529.337.715.2]cropped Eosinophils, (j) cropped Basophils.
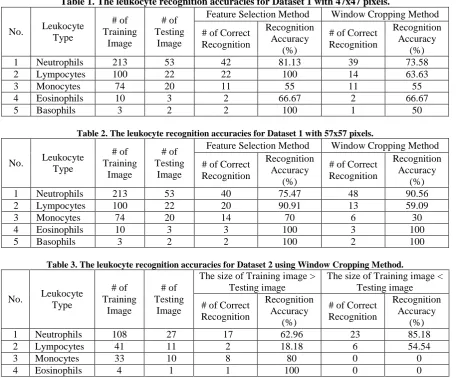
Table 1. The leukocyte recognition accuracies for Dataset 1 with 47x47 pixels.
No. Leukocyte Type
# of Training
Image
# of Testing
Image
Feature Selection Method Window Cropping Method
# of Correct Recognition
Recognition Accuracy
(%)
# of Correct Recognition
Recognition Accuracy
(%)
1 Neutrophils 213 53 42 81.13 39 73.58
2 Lympocytes 100 22 22 100 14 63.63
3 Monocytes 74 20 11 55 11 55
4 Eosinophils 10 3 2 66.67 2 66.67
5 Basophils 3 2 2 100 1 50
Table 2. The leukocyte recognition accuracies for Dataset 1 with 57x57 pixels.
No. Leukocyte Type
# of Training
Image
# of Testing
Image
Feature Selection Method Window Cropping Method
# of Correct Recognition
Recognition Accuracy
(%)
# of Correct Recognition
Recognition Accuracy
(%)
1 Neutrophils 213 53 40 75.47 48 90.56
2 Lympocytes 100 22 20 90.91 13 59.09
3 Monocytes 74 20 14 70 6 30
4 Eosinophils 10 3 3 100 3 100
5 Basophils 3 2 2 100 2 100
Table 3. The leukocyte recognition accuracies for Dataset 2 using Window Cropping Method.
No. Leukocyte Type
# of Training
Image
# of Testing
Image
The size of Training image > Testing image
The size of Training image < Testing image
# of Correct Recognition
Recognition Accuracy
(%)
# of Correct Recognition
Recognition Accuracy
(%)
1 Neutrophils 108 27 17 62.96 23 85.18
2 Lympocytes 41 11 2 18.18 6 54.54
3 Monocytes 33 10 8 80 0 0
A Combination of Feature Selection and Co-occurrence Matrix Methods for Leukocyte Recognition System 105
5 Basophils 4 1 0 0 1 100
0 10 20 30 40 50 60 70 80 90 100
Neutrophils Lympocytes Monocytes Eoshinophils Basophils
[image:5.595.84.520.83.245.2]Feature Selection HSV Window Cropping HSV RGB
Figure 4. The overall recognition accuracies for images with 47x47 pixels.
0 10 20 30 40 50 60 70 80 90 100
Neutrophils Lympocytes Monocytes Eoshinophils Basophils
[image:5.595.98.511.306.442.2]Feature Selection HSV Window Cropping HSV RGB
Figure 5. The overall recognition accuracies for images with 57x57 pixels.
In the next experiments, we evaluated the recognition accuracies of images in Dataset 2 by applying the Win-dow Cropping and the Co-occurrence matrix methods. Table 3 shows that for training images which had larger sizes than the testing images, the overall recognition ac-curacy was 52.23%. Meanwhile, the overall recognition accuracy of the system was 47.94% for training images with smaller dimensions than that of the testing images. These results show that the Window Cropping method is incapable to give high recognition accuracies for both conditions.
Finally, we compared the overall recognition accura-cies for three different recognition methods: 1) the Fea-ture Selection and the Co-occurrence matrix methods, 2) the Window Cropping and the Co-occurrence matrix methods, and 3) the Co-occurrence matrix method in RGB color space. Figure 4 and 5 show the overall recog-nition accuracies for images with 47x47 pixels and 57x57 pixels, respectively.
Based on Figure 4, the highest overall recognition
ac-curacy for images with 47x47 pixels were obtained by the Feature Selection and the Co-occurrence matrix me-thods with 83.64%, followed by the Co-occurrence ma-trix method in RGB color space with 82.79%. The lowest overall recognition accuracy was given by the combina-tion of the Window Cropping and the Co-occurrence matrix methods with 61.78%.
For images with 57x57 pixels, the Feature Selection and the Co-occurrence matrix methods still outperformed the Co-occurrence matrix method in RGB and gave the highest overall recognition accuracy with 87.12%. The overall recognition accuracy for the Co-occurrence ma-trix method in RGB color space was 84.93% and fol-lowed by the combination of the Window Cropping and the Co-occurrence matrix methods with 75.93%.
4.
Conclusion
is consisted of a color space transformation from the Red Green Blue (RGB) color space to the Hue Saturation Value (HSV) color space. Next, the input images are processed based on their: 1) color information from Hue and Saturation images, and 2) texture information from Value images. The color information is processed using the Feature Selection method or the Window Cropping method, while the texture information is processed using the Co-occurrence matrix method. Finally, the Euclidean distance method is used as the classifier of the leukocyte recognition system. The experimental results show that the combination of the Feature Selection and the Co-occurrence matrix methods gave the best recognition accuracies for recognizing leukocyte images.
5.
Acknowledgements
The authors would like to thank our research assistants for their help in preparing the experiments. The research described in this paper is supported by the Indonesian Ministry of Education and Culture - Directorate General for Higher Education (Hibah Penelitian Unggulan Perguruan Tinggi No. 552-SPK-LPPI/Untar/IV/2012).
REFERENCES
[1] M.M. Wintrobe, “Clinical Hematology,” 12th Edition, Lippincott Williams & Wilkins, Philadelphia, 2008. [2] M. Adjouadi, N. Zong, and M. Ayala, “Multidimensional
Pattern Recognition and Classification of White Blood Cells using Support Vector Machines,” Particle & Particle Systems Characterization, Vol. 22, No. 2, 2005, pp. 107-118. doi: 10.1002/ppsc.200400888.
[3] T. Markiewicz and S. Osowski, “Data Mining Techniques for Feature Selection in Blood Cell Recognition,” Pro-ceedings of European Symposium on Artificial Neural Networks, Belgium, 2006, pp. 407-412.
[4] M.C. Colunga, O.S. Siordia, S.J. Maybank, “Leukocyte Recognition using EM-algorithm,” Proceedings of 8th Mexican International Conference on Artificial Intelli-gence, Guanajuato, 2009, pp.545-555.
[5] N. Theera-Umpon and P.D. Gader, “Training Neural Networks to Count White Blood Cells via a Minimum Counting Error Objective Function,” Proceedings of In-ternational Conference on Pattern Recognition, Barcelona, 2000, pp.2299-2302.
[6] M. Beksac, M.S. Beksac, V.B. Tipi, H.A. Duru, M.U. Karakas, and A. Cakar,” An Artificial Intelligent Diag-nostic System on Differential Recognition of Hemato-poietic Cells from Microscopic Images,” Cytometry, Vol.
30, 1997, pp.145-150. doi:
10.1002/(SICI)1097-0320(19970615).