Munich Personal RePEc Archive
The Multi-Entity Structure and Control
in Business Groups
Mazumdar, Surajit
CESP, Jawaharlal Nehru University
December 2018
Online at
https://mpra.ub.uni-muenchen.de/93241/
The Multi-Entity Structure and Control in Business
Groups
Revised Version of paper presented at the conference on “Rethinking the role of business groups in contemporary India: Analyses, Reviews and Reflections”, Institute for Development Studies, Kolkata, 28-29 March 2018
Surajit Mazumdar, CESP/SSS, Jawaharlal Nehru University
Abstract
I. Introduction
The Indian business group is a sub-species of the larger category of entities which share the
common characteristic of being different from the classic stand-alone firm. Such groups,
which are said to be common in ‘emerging market’ contexts, however, have been
distinguished from its supposed opposite along several dimensions rather than one,and
these do not even necessarily imply each other. A multi-company structure, conglomerate
diversification patterns and the role played within them by large family networks are some
of the typical distinctive characteristics of groups referred to in the literature(Leff
1978,Amsden and Hikino 1994,Granovetter1995, Ghemawat and Khanna 1998, Guillen
2000, Khanna and Palepu 2005, Khanna and Yafeh, 2007). Even after this there are
questions about whether the group is a specific form of the firm or is it a structure of
coordination between firms. Contrast for instance “The group is a multicompany firm which
transacts in different markets but which does so under common entrepreneurial and
financial control” (Leff 1978, p 663) with the notion of the group as a “hybrid organizational
form between the firm and the market” (Khanna and Yafeh 2007, p. 333).When looked at
from the standard corporate governance perspective, it is not merely their multi-company
structure but inter-connectedness of legally independent publicly-listed companies and
their concentrated ownership that has been emphasized. Thus, except in a purely negative
sense, there is no one clear definition of what constitutes an emerging market business
group.
The recognition and study of business groups as a feature of the structure of the Indian
private corporate sector, however, first emerged from a very different concern, namely the
‘concentration of economic power’ or the ‘monopoly problem’ (Government of India 1964,
Government of India 1965, Hazari 1966, Namjoshi 1966). The central focus here was on the
control over a large proportion of assets, particularly in the industrial sector, by a relatively
small number of business families. Relevant to assessing the degree of such concentration
was the significance of what several early studies had noted and amassed considerable
evidence on – namely, inter-connections between legally independent companies or the
phenomenon of what was termed ‘industrial combination’(Mehta 1952, Basu 1958, Nigam
1967). Ultimately this led to a specific conceptualization of the group as a single and
cohesive decision-making entity that incorporated within itself several legally separate units.
"A corporate group may be defined as consisting of units which are subject to the
decision-making power of a common authority… The group functions as a single
organisation, nevertheless, though each of the corporate units under its control is a
separate legal entity" (Hazari 1966, p. 5).
The Monopolies Inquiry Commission (Government of India. 1965) and the Industrial
Licensing Policy Inquiry Committee (Government of India, 1969) worked with the same
understanding of the group. The latter described big groups as "Large Industrial Houses",
and in addition drew attention to the presence of “Large Independent Companies”- big
firms that had not assumed the group form. Two important aspects of the Indian business
group so defined were the emphasis on concentrated control over assets rather than in
their legal ownership and that the group could include several units of diverse sizes as well
as forms – and these included not merely publicly listed companies but also partnership and
proprietorship firms, trusts and private companies. The first of these meant that no
presumption was made to the effect that separation of ownership and control of capital was
necessarily absent or limited in the Indian business group. Correspondingly, the pooling of
capital owned by associated individuals linked to each other through large family networks
was also not deemed to be an essential feature of the business group. On the contrary, the
mechanisms by which centralized control was exercised, over assets not only dispersed
across different corporate units but also not necessarily owned by the controlling family,
was itself an object of investigation. This, in fact, was one reason among others why it was
important to acknowledge and examine the significance of the second feature, that the
group structure included entities other than listed public companies.
II. The Business Group as a Dynamic Structure
Corporate units and groups are of course creations of human agents. Implicit in the
conception of a centralized control over several legally separate units is the likelihood that
their creation and their integration into a whole are also the deliberate creation of that
controlling authority. Just as there can be a variety among single companies in terms of size,
levels and kinds of diversification and internal organization, and each one can change over
agent, so too in the case of business groups. This can include variations in the number and
types of different units and the structure integrating them as a whole – in short, the
architecture of the group1. Not only is the guiding hand of the central controlling authority behind the group structure, even the recourse to the group form is deliberate. Indeed,
single units can also evolve into groups – several groups recognized as such later, like
Godrej, can in fact be traced back to the ‘Large Independent Companies’ of the 1960s.
When controlling authorities are families, centralized control can also facilitate
‘restructuring’ of groups to manage generational transitions or to give effect to family
divisions. This mobility in the group structure means that they are not amenable to be
defined in extremely narrow and rigid terms.
The history of the Reliance ‘group’ from its beginnings in 1958 provides an illustration of the
dynamic character of business groups (Mazumdar 2006). Almost instinctively, in any study
Reliance would generally be considered a representative of the category of business groups.
Reliance Industries thus would typically be always treated as a group affiliated company
rather than a stand-alone one. Yet, as its history briefly recounted below will indicate,
Reliance in several phases of its history would not fit one or the other of several standard
conceptions of the ‘emerging market’ business group and almost never all of them.
The Reliance group began its history in trading conducted initially through a partnership
firm, Reliance Commercial Corporation. It was only in 1966 that it also entered
manufacturing along with the incorporation of the first joint-stock company of the group,
Reliance Textiles and Engineers Ltd. In the next decade, five more companies were created
-Reliance Exports in 1969; Vimal Fabrics in 1973; and in 1975 Anil Fabrics, Dipti Textile
Industries and Nina Textile Industries were incorporated to take over the businesses of
existing partnership firms. However, till 1977 none of the 6 companies was listed on any
stock exchange – instead, they were all narrowly held private limited companies.
Nevertheless, through a debt-financed growth, the group had assumed some size and
1
Reliance Textiles had to register itself under the then prevailing Monopolies and Restrictive
Trade Practices Act in 1978. The manufacturing activity of the group during this initial phase,
spread across four companies, was concentrated in the knitting and weaving of synthetic
fabrics and processing of yarn and grey fabrics. Though with some addition of new activities
and the acquisition of another company (Sidhpur Mills), the textiles phase of the group
continued till 1982. After that the growth for a decade came to be increasingly centered on
polyester and other petrochemicals. This growth carried Reliance to the very top of India’s
corporate hierarchy by the end of the decade of the 1980s. While there was a rapid
proliferation in the number of companies alongside this (Table 1), all the manufacturing activity
came to be concentrated in what was for several years the only publicly listed company in the
group and was ultimately rechristened as Reliance Industries Ltd.
Table 1: Increase in the Number of Companies of the Reliance Group, 1978 to 1989
Year-> 1978 1979 1980 1981 1982 1983 1984 1985 1986 1987 1988 1989 Companies
Registered in the Year
6 7 2 10 17 21 31 6 49 5 2 5
Cumulative Total of Group Companies
12 19 21 31 48 69 100 106 155 160 162 167
Note: The above table excludes companies for whom the relevant information was not available. 7 companies that were registered earlier but acquired during this period have also not been included.
Source: Mazumdar (2006)
The first listing of a Reliance group company was preceded by the amalgamation of Reliance
Textiles into another company, Mynlon Ltd., which was doing no business at that time. The
amalgamation was followed by a change in the company’s name, and city of registration, to
those of the acquired entity. This apparently odd rebirth of Reliance Textiles considerably
increased the number of shares held by its controlling family – from which a part was
divested to the public to get the company listed. Subsequently, as the company repeatedly
and successfully tapped the capital market for funds in the 1980s, the share capital and the
number of shareholders multiplied. The family retained its control over the company
through a stake that was increasingly held not by individuals but by other companies, the
many which were added to the stable during this period.
With the advent of liberalization, Reliance expanded its petrochemicals operations and
moved into oil and gas, power, telecom as well as several other new services activities.
Manufacturing operations, however, continued to be concentrated in one public company
companies were acquired, they were eventually merged into Reliance Industries. This
merger process began with Sidhpur Mills in 1982, which was followed by that of Reliance
Petrochemicals in 1992, Reliance Polypropylene and Reliance Polyethylene in 1995, Reliance
Petroleum in 2002, the privatized IPCL in 2007 and then another Reliance Petroleum in
2009. In the meanwhile, in 2005 the two Ambani brothers also split up the group among
themselves which also narrowed the business spread of each. While the two factions have
had 10 odd companies listed on stock exchanges, most of them were part of the Reliance
ADAG (Anil Ambani) that was engaged in mainly power, telecom and other services. The
Reliance Industries group (Mukesh Ambani), in which the oil and gas and manufacturing
operations came to be concentrated, eventually ended up with only two listed companies
even as it diversified into retail and telecom. Reliance Industries, however, continued to be
controlled by the family through the shareholding held by several other companies and one
trust, and LLPs after the Limited Liability Partnership Act, 2008 came into force. It in turn
became the sole ‘promoter’ of the other listed company (holding 45% of its share capital as
on March 2017).
Thus, the simultaneous control of a family over several legally separate units has been a
feature of Reliance’s structure through most of its history, at least for the last four and a half
decades. For some period, this was a feature without there being any publicly listed
company in the group’s stable. It became one of India’s largest groups with a single listed
company. No tendency towards conglomerate diversification characterized its initial journey
to that position - if it exhibited any tendency towards conglomerate diversification that was
later. Like almost all other groups, it also experienced a family division. So, when, if ever, has
Reliance been a business group? The answer will change depending on the specific
definition one adopts. By the original Hazari conception, however, it has been almost
throughout a business group, but its structure has evolved and altered over time – perhaps,
one may say, as a response to its own growth and the changing environment of its
operation.
III. The Business Group: Control and Ownership
The business group serves as an effective a vehicle for centralization of capital precisely
because in addition to the control of large quantities of assets not necessarily owned by
allows business families to enjoy the benefits of concentrated ownership of the equity of
group companies including publicly listed ones. A business group can attain a size far
beyond the limits it would be subject to if it were to be primarily dependent on the funds
owned directly by its controlling family, limits that family divisions make severer, precisely
because of this special combination being its feature. The multi-entity structure enables it
by allowing business groups to take recourse to the device that in Indian literature has been
referred to as inter-corporate investments –units within the group holding the equity of other group companies (Hazari1966, Goyal 1979, Singhania 1980, Rao 1985).
In the colonial period, when financial institutions for providing long-term finance were
virtually absent and share capital was the principal means of financing industrial investment,
companies could be controlled by European and Indian capitalists through managing agency
firms2. After independence, by the time this institution was abolished in 1969, long-term
industrial financing of private sector companies was also well on its way to increasingly
taking the form of lending by public sector financial institutions. However, Indian business
groups by then had also evolved the method of inter-corporate investments to protect
themselves from any serious threat to their control.
Inter-corporate investments can be said to be a means of creating fictitiousshare capital –
claims on assets that are themselves claims on other assets - that make use of the
property-owning rights vested in the units constituting a group. Any funds acquired by any one unit
from any source and in any form is potentially usable for purchase the equity of another
unit rather than any real asset. For instance, a company controlled by a business family
could borrow from a bank to finance its acquisition of shares in another company – thus
using the borrowed funds to acquire voting rights in the second company that would be
controlled by the family but would not ultimately belong to them. Further, the consequent
transfer of funds then places the second unit in exactly the same position – in possession of
funds that could be used to acquire equity of any other company. Continuous repetition of
this process and multiplication of the total share capital of different units can be done
2
without involving any additional funds – and indeed the locking up of any funds in this can
be eventually eliminated by forming a circular chain of such investments. In the ultimate
analysis, all inter-corporate investments within a group would be the liability of some unit
(those issuing the shares) as well as the asset of another (those holding the shares). For the
group as a whole, these are liabilities that ‘finance’ nothing but their own holding as assets
-and consolidation of all the units within the group into a single entity would result in them
getting extinguished.
It is the creation of fictitious share capital in the form of inter-corporate investments that
allows business families to control a much large equity in the group companies than that
directly owned by them and through that control also the realandfinancial assets owned by
these companies. It results in a form of separation of capital as property and capital as
function that makes that separation appear to be of a lesser order than it actually is –the
greater is the proportion of holdings of other corporate bodies in the equity through which
group companies are controlled the greater also will tend to be the relative importance of
the finance provided by other sources.
The use of the device of inter-corporate investments is something possible only if the group
includes several different corporate units and this provides one rationale, alongside others,
for groups to have a multi-entity structure. Since the mechanism of centralizing control over
several corporate units of a business group lies within the structure of the group, it should
be also considered as one determinant of that structure. Indeed, this is one possible
explanation for the presence of several small private companies within business group
which might otherwise not be performing any function in the organization of its business
activities. Again, the pre-1991 history of the Reliance group subsequent to the listing of
Reliance Textiles (Industries) can be used to illustrate this.
As mentioned earlier, Reliance grew rapidly in the 1980s, for financing which it made
extensive use of the capital market. For a relatively younger group making its entry into
what was still a relatively restricted market, the concentration of production activity and
real assets in the one company raising funds was perhaps important because it gave it some
scale and size. However, that very success achieved in mobilizing finance and the
consequent expansion of the share capital posed the problem of how to maintain and
of the direct holding by the family came down drastically. Reliance solved this problem by
recourse to inter-corporate investments but in circumstances when there were no other
large companies in the fold to hold a controlling stake in Reliance Industries. How it did so
[image:10.595.72.515.200.345.2]can perhaps explain why there was also the rapid proliferation of companies noted earlier.
Table 2: Distribution of Shareholding of Reliance Industries (As on date of Annual General Meeting of respective years), Selected Years
YEAR 1977 1982 1987 1988
Total Equity Shares 5951100 16643587 51609318 152146493 Percentage Shares Held By:
Financial Institutions 2.94 17.95 12.22 16.68 Bodies Corporate 2.94 34.85 36.23 20.47 Directors and Relatives 90.29 5.63 2.41 0.81 Other Top 50 Shareholders 3.83 - 1.65 1.00
Non-Resident Indians - - -
-Others - 41.57 47.50 61.04
Total 100 100 100 100
Source: Mazumdar (2006)
The evidence (Mazumdar 2006) indicates that several small investment and trading
companies created by the group used borrowed funds to repeatedly acquire Reliance shares
and that this holding was also periodically transferred from one set of such companies to
others. Divestments by some of these companies were accompanied by acquisitions by
others through concurrent transactions if not transactions among themselves. Since the
acquisitions were also financed by fresh borrowing, this was a way of reconciling servicing of
debt by individual companies with permanent holding of an expanding number of shares by
them as a group – effectively transferring from time to time the group holding of Reliance
shares and the debt which financed it from one set of group investment companies to
another. As a result, the block holding in Reliance through which it could be controlled
shifted away from that held by individuals to that held by investment companies. The
debt-equity ratio of the group as a whole was thus considerably greater than that of Reliance
Industries because the controlling stake in the latter was basically resulting from routing
debt funds through the investment companies. Even the control over these investment
companies came to be ultimately based on cross-holding among themselves – so that their
Table 3: Structure of Ownership of Shares of Sample of Narrowly Held Reliance Group Private Companies, 1985 to 1989
Year 1985 1986 1987 1988 1989
Equity Shares
Number of Companies 56 70 81 64 48 Total Number of Shares 2149238 2743448 6830480 5587990 3751340 Value of Shares (Rs. Lakhs) 220.64 280.25 734.37 563.77 380.10 Distribution of Ownership
(%)
Bodies Corporate 33.61 48.20 93.86 91.16 95.96 Individuals 66.39 51.80 6.14 8.84 4.04
Preference Shares
Number of Companies 24 23 17 16 14 Total Number of Shares 588700 581200 550100 564500 551250 Value of Shares (Rs. Lakhs) 60.27 59.52 56.36 57.85 56.52 Distribution of Ownership
(%)
Bodies Corporate 82.93 82.79 84.70 81.21 83.17 Individuals 17.07 17.28 15.37 18.86 16.91
Source: Mazumdar (2006)
The structure of the Reliance group that thus emerged towards the end of the 1980s was
one where a complex web of inter-connections through inter-corporate investments and
even common directors linked a large number of individually small investment and trading
companies, and at any point of time a subs-set among them together held a significant
portion of the equity of the publicly listed Reliance Industries which in turn had Reliance
Petrochemicals, the only other company that came to be also listed, as one of its three
subsidiaries3.
Clearly, the Reliance structure described above was not a product of some spontaneous
evolution but a deliberate creation to resolve the problem of control confronting the group.
It was aparticular way of using the generalform of inter-corporate investments to enable
the family to mobilize and control greater capital than it could itself accumulate. With each
group adapting that form to its own specific requirements at every point of time, several
different kinds of structures are clearly possible. However, none of them can be explained
without bringing in the question of how control over capital is organized by business
families and the legal and regulatory framework which enables it. Thus, the widespread use
of narrowly held investment companies by Indian groups in the pre-liberalization era was
known to be a way of circumventing the restrictions on inter-corporate investments that
were generally operative at that time. The Reliance case also indicates another important
possibility – namely that apparently stand-alone public companies could very well be part of
an inter-connected multi-entity structure forming the basis for control over it. Indeed, there
is evidence that, more often than not, this is the case (Mazumdar 2012) – which brings into
question the validity of classifications into group affiliated and stand-alone companies that
form the basis for empirical evaluation of propositions pertaining to business groups and
their behaviour4.
IV. Liberalization and Control in Business Groups
The big fillip to liberal economic reforms after 1991 certainly initiated several important
changes in the legal and regulatory framework governing the corporate sector. Curbing the
concentration of economic power came to be abandoned even as a formal objective with
the abolition of the MRTP Act. The Capital Issues Control Act (CICA), 1947 was also abolished
and foreign institutional investors were permitted to invest in the Indian stock market. The
Securities and Exchange Board of India was created in 1992 and vested with the
responsibility of regulating the market and “protecting the interests of investors in
securities” (GOI 2014, p. 4). The SEBI put in place a takeover code governing acquisitions
and changes in control of listed companies. Foreign Direct Investment norms were also
liberalized – allowing foreign multinationals to increase equity holdings in their Indian
affiliates beyond the limits earlier imposed through the Foreign Exchange Regulation Act
(FERA), 1973. Indian companies were also allowed to access international capital markets
and then also to invest abroad more freely than earlier.
Though the stock market increased in prominence in Indian capitalism as a combined effect
of liberalization measures, this development can scarcely be described as one accompanied
by a movement in the direction of creating a ‘market for corporate control’ to serve as a
mechanism of disciplining corporate managements. Yes, the regulatory environment
became more permissive towards acquisitions and opened the possibility of new and
powerful raiders from abroad entering the game. However, this only heightened the need
for business families to establish more secure control over their group companies – and the
regulatory environment also became simultaneously more ‘liberal’ on this count too.
Elements in the takeover regulations themselves as well as other regulatory changes
provided a more permissive and flexible context for achieving that end of secure control
(Varottil 2015). At the same time, foreign firms were also able to exercise greater control
over their affiliates. As a result of these, concentration in the ownership of equity of listed
companies became even more of a pronounced feature of the Indian corporate sector after
liberalization.
The takeover regulations introduced in the 1990s gave rise to a new vocabulary from which
emerged the terms ‘promoter’ and ‘promoter group’ to describe respectively, the
controlling authority of a company and the group of individuals and entities who together
held the controlling stake. The very idea of a promoter indicated that control over a
company was exercised not by the collective of shareholders or even a board of directors or
management elected by them. Even the new Companies Act of 2013 acknowledged this in
spelling out the meaning of promoter:
“69) ―promoter means a person—
(a) who has been named as such in a prospectus or is identified by the company in the annual return referred to in section 92; or
(b) who has control over the affairs of the company, directly or indirectly whether as a shareholder, director or otherwise; or
(c) in accordance with whose advice, directions or instructions the Board of Directors of the company is accustomed to act: “
(GOI 2013, p. 21)
Table A1 (Appendix) shows the proportion and composition of declared promoter holdings
as on 31 March 2018 for the 71 private sector companies (excluding banks and insurance
companies) which are part of the top 100 companies in terms of market capitalization in the
Bombay Stock Exchange. These 71 companies between them accounted for over 45% of the
market capitalization of all companies as on 21 June 2018. A perusal of the last column
would show that in general such promoter holdings are quite high relative to the company’s
equity base – in case of 46 companies, its share is more than 50% and in another 20
companies it is greater than 25%.The exceptions where there is no promoter - ITC and
Larsen & Toubro – are truly exceptions and even here the former does have a large stake
therefore, clearly an unlikely possibility and as such there is no basis for a stock-market
based disciplining mechanism to work.
A look at the composition of promoters’ holdings also makes it clear that the promoter
stake is dominated by holdings by other entities (trusts, Indian companies/LLPs and foreign
companies) rather than individuals. Thus, there are barely twelve companies in which the
individual holdings of Indians within the promoter group even exceed 10% of the total share
capital. On the other hand, in 58 companies, trusts and Indian and foreign companies within
[image:14.595.67.548.278.456.2]the promoter groups hold more than 25% of the share capital.
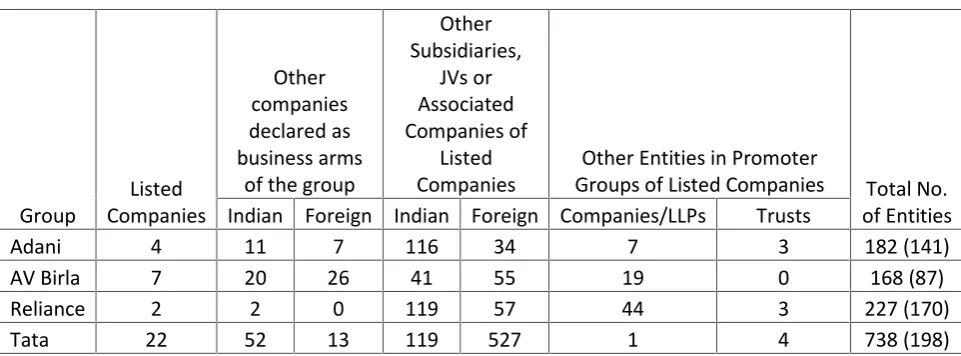
Table 4: Number and Types of Companies/Entities of Four Major Groups (March 2018)
Group Listed Companies Other companies declared as business arms
of the group
Other Subsidiaries, JVs or Associated Companies of Listed Companies
Other Entities in Promoter
Groups of Listed Companies Total No. of Entities Indian Foreign Indian Foreign Companies/LLPs Trusts
Adani 4 11 7 116 34 7 3 182 (141)
AV Birla 7 20 26 41 55 19 0 168 (87)
Reliance 2 2 0 119 57 44 3 227 (170)
Tata 22 52 13 119 527 1 4 738 (198)
Source: Compiles from information available on the BSE Website, Company websites and Annual Reports
The architecture of groups however still varies despite their sharing a common essence.
Consider for instance 4 of the largest Indian groups – Tata, Reliance, AV Birla and Adani.
Table 4 summarizes the recent position of each group about the number of companies,
trusts or LLPs it has and partial indications of their status. The information used to prepare
this table has been taken from the group websites, annual reports of companies where
available and the details of promoter shareholding submitted by the listed companies to the
Bombay Stock Exchange and available on its website. It is clear from the table that each of
the four groups includes within its fold very large number of companies/entities. The
declared list of group companies within whom the business activities of the group are
distributed are a subset of the total – and their number varies significantly even if we
consider only the Indian operations of the groups. From these we get the indication that the
main businesses of Reliance continue to be highly concentrated in a few companies while in
exchanges are even fewer than the number declared as business arms - but even this
number has a wide range across the four groups and does not have any obvious relationship
with the size of the group or the total number of Indian entities.
With regard to the control over companies, each group’s listed companies tend to have
several subsidiaries, associate companies and joint ventures – in which directly or indirectly
it is the listed companies which tend to hold a controlling shareholding. While these include
other listed companies of the group, unlisted entities are in all cases central to the structure
of control over listed companies through their importance in the promoter’s holding in key
listed ones. However, here again there are variations. In the case of the Tata companies, the
unlisted Tata Sons clearly occupies the position of being an apex holding company of the
group. In the Adani group, on the other hand, private family trusts have an important role in
this (different from the Tata group trusts which are public in nature).A large part of the
promoter holding in Reliance Industries is now held by LLPs – but this institutional form
doesn’t have a comparable prominence in any of the other three groups. Apart from
cross-holding among listed companies, unlisted investment companies appear to be the main
ways of building up a controlling promoter’s stake in the AV Birla group.
Even when there is no substantive change in control, the entities making up the promoter
and the distribution of the holding between them are not necessary stable over time. The
extent of this ‘mobility’ varies across groups and even an individual group can exhibit
differences over different time-periods. We have seen earlier, how the Reliance controlling
shareholding kept changing hands in the 1980s – necessitated by the repeated recourse to
capital markets. Such movement in the proper holding has also happened more recently
and independent of any recourse to capital issues. Consider for example the changes in the
promoter holding of Reliance Industries that took place between December 2009 and
September 2010, in the run up to LLPs becoming major holders of the promoter’s stake5.
Between June 2010 and September 2010, there was no change in the size of the promoter
group holding (number of shares held) of Reliance Industries Ltd. Nor was there any change
5
in the composition of the promoter group (the list of individuals/ entities). However,
1059170001 shares changed hands within the promoter group – transferred from 14
companies to 29 LLPs. This number constituted 72.35 % of the total promoter holding and
34.17 of the total share capital of Reliance Industries. Their transfer was declared asinter-se transfersthat took place on 11.08.2010, which is perhaps why the open public offer clause of the Takeover Code was not triggered. Since on 11.08.2010, the low and high prices of
Reliance shares were Rs. 490 and Rs. 497 respectively, the value of the 1059170001 shares
should therefore have been a minimum of Rs. 5189 crores. Of the 1059170001 transferred
on 11.08.2010, 987241125 shares (or 93% of the total) are also recorded as being sold by 4
companies6 throughoff-market transactions, and each of them also bought 100 shares on the same day. There was also something, however, that happened before this. These 4
companies did not have these shares to sell in December 2009 as each held only 200 shares
at that time and acquired the rest mostly on 31 March 2010 through off-marketpurchases.
On the same day another 5 promoter group companies also sold 780331332 through
off-market transactions, which could account for 68.71 % of the shares bought by the other 4.
Thus, even though all the transactions are not being captured in the disclosed information,
it is clear that the holdings eventually held by Reliance group LLPs from September 2010
onward had changed hands previously, in the months preceding their acquisition by the
LLPs. The 4 companies that accounted for the bulk of this shift to LLPs subsequently ceased
to exist, but the available records indicate that these transfers were without any payment
being received. This mobility of the controlling stake did not end with the transfer to LLPs.
Until a bonus issue in September 2017 doubled it, the size of the promoter holding (number
of shares) remained more or less fixed after September 2010 but not necessarily its
composition. In fact, another round of significant inter-se transfers happened in March
2017. While all of this can be ascertained from the disclosures mandated by the prevailing
regulations, these do not by themselves provide any clue about why the Reliance promoter
holding was eventually shifted to LLPs and why did the other moving around of it happen
both before and after this change.
6
V. Conclusion
The business group structure in India constitutes a particular way of organizing capital that
goes beyond the institutional form of the joint-stock company and incorporates within itself
the scope for a mechanism through which the ‘widely held’ public company can also be
subject to near proprietary control by business families. This structure is always what it is
because that is consistent with that objective of ensuring control – a result of the behaviour
of their controlling business families and not simply its determinant. The business group
structure can and does involve the use of companies, firms and trusts with little public
participation. It is a flexible structure characterized by variations as well as a mobility across
time. To what extent and in what ways this flexibility and mobility expresses itself is also
influenced by the prevailing legal and regulatory framework – the combination of
imperatives, constraints and opportunities it gives rise to - and to the changes this
framework experiences from time to time. The period of liberalization has been far from
being an exception – indeed, it has afforded more flexibility than was available earlier. The
study of business groups - their structures, behaviour and consequences- without reference
to this question of control and how it is resolved would therefore be characterized by an
important gap. Wider recognition of the existence of this gap is the precondition for
research that will fill it.
References:
Amsden, A. H., & Hikino, T. (1994), ‘Project Execution Capability, Organizational Know-how
and Conglomerate Corporate Growth in Late Industrialization’, Industrial and Corporate Change, 3, 111-147.
Basu, S.K. (1958), The Managing Agency System: In Prospect and Retrospect, The World Press Pvt. Ltd., Calcutta
Chalapati Rao, K.S. (1985), “Inter-Connections under the MRTP Act in the Context of Asset
Limit Hike”,Economic and Political Weekly20 (27), 1132-1146.
Ghemawat, Pankaj and Tarun Khanna (1998), ‘The Nature of Diversified Business Groups: A
Government of India (1964), Committee on Distribution of Income and Levels of Living (Mahalonobis Committee) Report, New Delhi: Planning Commission, Government of India.
Government of India (1965), Monopolies Inquiry Commission (MIC) Report, New Delhi: Government of India.
Government of India (1969), Industrial Licensing Policy Inquiry Committee (ILPIC) Report, New Delhi: Department of Industrial Development, Ministry of Industrial Development,
Trade and Company Affairs, Government of India.
Government of India (2013), The Companies Act,
2013,(http://www.mca.gov.in/Ministry/pdf/CompaniesAct2013.pdf)
Government of India (2014), Securities and Exchange Board of India Act, 1992[As amended by the Securities Laws (Amendment) Act, 2014], (https://www.sebi.gov.in/sebi_data/attachdocs/1456380272563.pdf)
Goyal, S.K, (1979),Monopoly Capital and Public Policy, New Delhi, Bombay, Calcutta, Madras, Bangalore, Hyderabad: Allied Publishers Private Limited.
Granovetter, Mark (1995), ‘Coase Revisited: Business Groups in the Modern Economy’,
Industrial and Corporate Change, 4(1), 93–129.
Guillén, Mauro F. (2000), ‘Business Groups in Emerging Economies: A Resource-Based View’,
The Academy of Management Journal, 43 (3), 362-380.
Hazari, R.K. (1966),The Structure of the Private Corporate Sector: A Study of Concentration, Ownership and Control, Bombay: Asia Publishing House.
Joshi, L.A. (1965),The Control of Industry in India: A Study in Aspects of Combination and Concentration, Bombay: Vora and Co. Publishers Pvt. Ltd.
Khanna, Tarun and Yishay Yafeh (2007), ‘Business Groups in Emerging Markets: Paragons or
Parasites’,Journal of Economic Literature, 45(2), 331-372
Khanna, Tarun, and Krishna Palepu (2005), ‘The Evolution of Concentrated Ownership in
India: Broad Patterns and a History of the Indian Software Industry’, in R. Morck (ed.), A History of Corporate Governance around the World: Family Business Groups to Professional Managers, Chicago, University of Chicago Press.
Leff, Nathaniel H. (1978), ‘Industrial Organization and Entrepreneurship in the Developing
Countries: The Economic Groups’,Economic Development and Cultural Change, 26 (4), 661-675
Mazumdar, Surajit (2006), ‘Business Groups and Concentration in the Private Corporate
Sector in India’, unpublished thesis, Jawaharlal Nehru University, New Delhi.
Mazumdar, Surajit (2011), ‘The State, Industrialization and Competition: A Reassessment of
India's Leading Business Enterprises under Dirigisme’, Economic History of the Developing Regions.26 (2), 33-54.
Mazumdar, Surajit (2012), ‘The Indian Corporate Structure and the ‘Theory’ of Emerging
Market Business Groups’,History and Sociology of South Asia,6 (2), 87-109.
Mazumdar, Surajit (2017), ‘From ‘Outsider’ to Insider: The Case of Reliance’, Samaj (South Asia Multy-Disciplinary Academic Journal), 15/2017
Mehta, M.M. (1952),Combination Movement in Indian Industry (A Study of Concentration of Ownership, Control and Management in Indian Industries), Allahabad: Friends’ Book Depot.
Mohnot, S.R. (1962), Concentration of Economic Power in India: A Statistical Study of Concentration and Diffusion of Economic Power in India, Allahabad: Chaitanya Publishing House.
Namjoshi, M.A. (1966),Monopolies in India: Policy Proposals for a Mixed Economy, Lalvani Publishing House, Bombay-Calcutta-Madras-New Delhi
Nigam, Raj K. (1959), Managing Agencies in India (First Round: Basic Facts), Department of
Company Law Administration, Ministry of Commerce and Industry, New Delhi
Nigam, Raj K. and N.C. Chaudhuri (1960), The Corporate Sector in India, A Factual
Presentation of Long and Short-Term Trends, Research and Statistics Division, Department
of Company Law Administration, Ministry of Commerce and Industry, Government of India,
New Delhi
Nigam, Raj K. and N.D. Joshi (1963), The Pattern of Company Directorships in India, Second
Edition, Research and Statistics Division, Department of Company Law Administration,
Singhania, Vinod K. (1980), Economic Concentration through Inter-Corporate Investments, Himalaya Publishing House, Bombay.
Varottil, Umakanth (2015), ‘The Nature of the Market for Corporate Control in India’, NUS
Appendix
Table A 1: Promoter Holdings in Major Listed Non-Financial Private Sector Companies (as on March 2018)
S.
No. Company
Promoter Holding (Percentage Share in Total Equity)
Individuals/HUF
Foreign
Individuals Trusts
Indian Companies/LLPs
Foreign
Companies Total 1 ADANI PORTS AND SPECIAL ECONOMIC ZONE LTD. 42.96 6.78 16.52 66.26
2 Aditya Birla Capital Ltd 0.06 71.17 1.53 72.76
3 AMBUJA CEMENTS LTD. 63.55 63.55
4 ASHOK LEYLAND LTD. 51.27 51.27
5 ASIAN PAINTS LTD. 10.66 0.03 42.11 52.8
6 AUROBINDO PHARMA LTD. 12.32 3.07 36.48 51.87
7 Avenue Supermarts Ltd 53.56 28.64 82.2
8 BAJAJ AUTO LTD. 4.06 0.25 44.98 49.29
9 Bajaj Finance Limited 0.15 54.99 55.14
10 BAJAJ FINSERV LTD. 4.72 0.45 53.18 58.35
11 BAJAJ HOLDINGS & INVESTMENT LTD. 0.49 16.31 27.52 44.32
12 BHARAT FORGE LTD. 0.35 45.4 45.75
13 BHARTI AIRTEL LTD. 50.1 17.04 67.14
14 BHARTI INFRATEL LTD. 53.51 53.51
15 BIOCON LTD. 39.77 1.13 19.77 60.67
16 BOSCH LTD. 1.49 69 70.49
17 BRITANNIA INDUSTRIES LTD. 50.7 50.7
18 CADILA HEALTHCARE LTD. 0.01 74.78 74.79
19 CIPLA LTD. 14.08 22.37 0.76 37.21
20 COLGATE-PALMOLIVE (INDIA) LTD. 51 51
22 DLF LTD. 2.75 77.83 80.58
23 DR.REDDY'S LABORATORIES LTD. 2 24.76 26.76
24 EICHER MOTORS LTD. 2.28 2.24 45.92 0.06 50.5
25 GODREJ CONSUMER PRODUCTS LTD. 2.64 0.28 0.47 59.86 63.25
26 GRASIM INDUSTRIES LTD. 0.13 36.31 3.65 40.09
27 HAVELLS INDIA LTD. 15.2 3.02 41.36 59.58
28 HCL TECHNOLOGIES LTD. 43.38 16.8 60.18
29 HERO MOTOCORP LTD.* 14.19 20.44 34.63
30 HINDALCO INDUSTRIES LTD. 0.11 33.92 0.65 34.68
31 HINDUSTAN UNILEVER LTD. 67.19 67.19
32 HINDUSTAN ZINC LTD. 64.92 64.92
33 Indiabulls Housing Finance Ltd 0.11 22.68 22.79
34 INFOSYS LTD. 12.9 12.9
35 InterGlobe Aviation Ltd 0.35 23.08 13.6 37.9 74.93
36 ITC LTD.** 0
37 JSW STEEL LTD. 0.6 38.7 2.07 41.37
38 L&T FINANCE HOLDINGS LTD. 64.01 64.01
39 Larsen & Toubro Infotech Ltd 82.96 82.96
40 LARSEN & TOUBRO LTD. 0
41 LUPIN LTD. 1.25 45.48 0.28 47.01
42 MAHINDRA & MAHINDRA FINANCIAL SERVICES LTD. 51.19 51.19
43 MAHINDRA & MAHINDRA LTD. 0.63 0.09 8.85 12.15 21.72
44 MARICO LTD. 12.15 0.14 46 1.42 59.71
45 MARUTI SUZUKI INDIA LTD. 56.21 56.21
46 MOTHERSON SUMI SYSTEMS LTD. 0.53 2.32 33.43 4.97 41.25
47 MRF LTD. 11.46 0.62 1.25 14.21 27.54
48 NESTLE INDIA LTD. 62.76 62.76
49 ORACLE FINANCIAL SERVICES SOFTWARE LTD. 73.82 73.82
51 PIDILITE INDUSTRIES LTD. 50.42 2.18 17.17 69.77
52 PIRAMAL ENTERPRISES LTD. 0.38 45.99 5.01 51.38
53 PROCTER & GAMBLE HYGIENE & HEALTH CARE LTD. 1.91 68.73 70.64
54 RELIANCE INDUSTRIES LTD. 0.69 3.91 42.85 47.45
55 SHREE CEMENT LTD. 3.08 61.7 64.78
56 SHRIRAM TRANSPORT FINANCE CO.LTD. 26.08 26.08
57 SIEMENS LTD. 75 75
58 SUN PHARMACEUTICAL INDUSTRIES LTD. 12.22 0.05 42.11 54.38
59 SUN TV NETWORK LTD. 75 75
60 TATA CONSULTANCY SERVICES LTD. 71.92 71.92
61 TATA MOTORS LTD. 36.37 36.37
62 TATA STEEL LTD. 0.07 33.14 33.21
63 TECH MAHINDRA LTD. 9.8 26.17 0.02 35.99
64 Titan Company Limited 52.91 52.91
65 ULTRATECH CEMENT LTD. 0.03 60.95 60.98
66 UNITED BREWERIES LTD.-$ 8.08 21.39 43.88 73.35
67 UNITED SPIRITS LTD. 0.01 3.69 54.78 58.48
68 UPL Limited 0.57 1.95 25.2 27.72
69 Vedanta Limited 50.13 50.13
70 WIPRO LTD.*** 4.22 13.67 56.43 74.32
71 ZEE ENTERTAINMENT ENTERPRISES LTD. 25.21 16.41 41.62