ORIGINAL RESEARCH
Fluorodeoxyglucose–Positron-Emission
Tomography, Single-Photon Emission Tomography,
and Structural MR Imaging for Prediction of
Rapid Conversion to Alzheimer Disease in
Patients with Mild Cognitive Impairment: A
Meta-Analysis
Y. Yuan Z.-X. Gu W.-S. Wei
BACKGROUND AND PURPOSE: Patients with mild cognitive impairment (MCI) are at risk for developing Alzheimer disease (AD). To diagnose AD at an early stage, one must develop highly specific and sensitive tools to identify it among at-risk subjects. The purpose of this study was to evaluate and compare the ability of fluorodeoxyglucose–positron-emission tomography (FDG-PET), single-photon emission tomography (SPECT), and structural MR imaging to predict conversion to AD in patients with MCI.
MATERIALS AND METHODS: Relevant studies were identified with MEDLINE from January 1990 to April 2008. Meta-analysis and meta-regression were done on the diagnostic performance data for each technique from eligible studies. We estimated and compared the weighted summary sensitivities, specificities, likelihood ratios (LRs), and summary receiver operating characteristic curves of each imaging technique.
RESULTS: Twenty-four eligible studies were included, with a total of 1112 patients. FDG-PET per-formed statistically better in LR⫹and odds ratio (OR), whereas no statistical difference was found in pooled sensitivity, specificity, and LR⫺for each technique. No statistical difference was confirmed between SPECT and MR imaging. TheQ* index estimates for FDG-PET, SPECT, and structural MR imaging were respectively 0.86, 0.75, and 0.76. In meta-regression, statistical significance was found only between technique and log OR, with a regression coefficient of⫺0.575.
CONCLUSIONS: This meta-analysis showed that FDG-PET performs slightly better than SPECT and structural MR imaging in the prediction of conversion to AD in patients with MCI; parallel performance was found between SPECT and MR imaging.
T
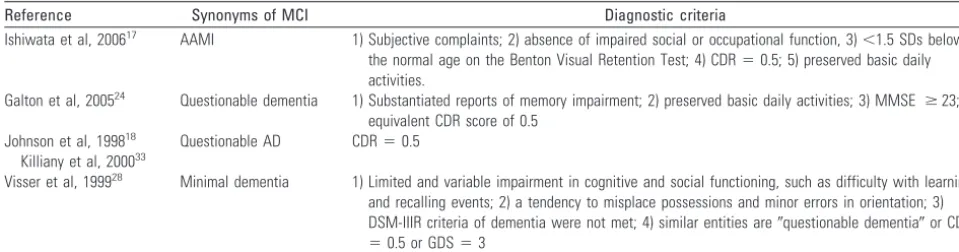
he prevalence of Alzheimer disease (AD) doubles steadily every 5–10 years for individuals older than 60 years of age.1 Before symptoms are manifest for clinical diagnosis of proba-ble AD, histologic changes of AD may present in asymptom-atic individuals, which are followed by mild cognitive impair-ment (MCI). MCI is a heterogeneous entity characterized by differences in cognitive profile and clinical progression, possi-bly due to the interplay of genetic, physiologic, and environ-mental factors.2The outcome of MCI is uncertain: Many sub-jects remain stable or even revert to a normal state, whereas others present progressive neurodegeneration and eventually develop AD or other dementias.3Many patients have been classified as having MCI (or related synonyms) (Table 1), all referring to individuals “whose cognitive impairment, partic-ularly memory impairment, is beyond that expected in peopleof their age and educational level, but is not severe enough to reach criteria for dementia, delirium, or organic amnesia syn-drome.”3,4To diagnose AD at an early stage, one must develop highly specific and sensitive tools to identify it among at-risk subjects, such as patients with MCI. One approach to evaluate predictive ability would be to collect longitudinal data on a sample of subjects and retrospectively analyze the initial char-acteristics of those who eventually convert.
To assess progression and identify patients with progres-sive MCI, several noninvaprogres-sive imaging methods are available; however, there is no consensus on the ideal one. Although the ability of imaging techniques to predict progression of MCI has been investigated, the results are based on studies that differ in terms of population characteristics, methodology, follow-up interval, and reference standards, some of which are ineffective to evaluate the predictive value due to small sample sizes. A meta-analysis thus needed to be performed. By com-bining relevant evidence, for example a series of effect sizes such as odds ratio (OR) and risk ratio, from similar studies, statistical power is increased and more precise estimates can be obtained. Effects of confounding factors would be lessened by pooling results from all studies, making the results more ap-plicable to the wider population. Most important, meta-anal-ysis provides a framework for the assessment of between-study heterogeneity—that is, the methodologic, epidemiologic, clinical, and biologic dissimilarity across the various studies.5
Received August 6, 2008; accepted after revision September 10.
From the Departments of Nuclear Medicine (Y.Y., Z.-X.G.) and Neurology (W.-S.W.), Huadong Hospital, Fudan University, Shanghai, China.
This research was funded by a grant from the Science and Technology Commission of Shanghai Municipality Funds (No. 07DJ14005).
Please address correspondence to Zhao-Xiang Gu, PhD, Department of Nuclear Medicine, Huadong Hospital, Fudan University, 221 W Yan’an Rd, Shanghai, China; e-mail: [email protected]
Furthermore, studies comparing fluorodeoxyglucose– positron-emission tomography (FDG-PET), single-photon emission CT (SPECT), and structural MR imaging within the same patient population are unlikely to be performed because of increased cost and longer work-up time.
The aim of our meta-analysis was to evaluate and compare the ability of noninvasive imaging methods (FDG-PET, SPECT, and structural MR imaging) to predict conversion to AD in patients with MCI from studies reported in the peer-reviewed literature.
Materials and Methods
Identification and Eligibility of Relevant Studies
MEDLINE through OVID was used to identify studies. The search strategy was based on a combination of terms: 1) positron-emission tomography or tomography, emission-computed, single-photon OR MR imaging; 2) mild cognitive impairment AND Alzheimer Disease AND predict*. Searches were limited to human subjects. Abstracts were read by 2 reviewers (Y.Y., Z.-X.G.) for all articles retrieved. For relevant abstracts, full articles were obtained and examined. Refer-ences of retrieved articles were screened for additional studies. Fur-ther articles citing these articles were also examined by using the So-cial Sciences Citation Index (1998 to present) through the Web of Science.
The following inclusion criteria were adopted to conform vari-ables that may introduce bias or explain heterogeneity of the results on the basis of the Quality Assessment of Diagnostic Accuracy Assess-ment (QUADAS) tool6: 1) published between January 1990 and April
2008; 2) peer-reviewed; 3) original studies; 4) reported in English; 5) including at least 10 subjects; 6) patients at baseline who could not be classified as healthy or demented but were cognitively impaired; 7) longitudinal studies that retrospectively analyzed the initial charac-teristics of those who were progressive and those who remained sta-ble; 8) not visually rated; 8) either clinical diagnosis (AD based on the National Institute of Neurologic and Communicative Disorders and Stroke-Alzheimer disease and Related Disorders Association criteria,7
dementia based on the Diagnostic and Statistical Manual criteria [DSM-IV],8) or histopathologic diagnosis used as the reference
stan-dard; 9) sufficient data provided either directly or indirectly through a 2⫻2 table to enable calculation of point estimates and 95% confi-dence intervals (CIs) for the operating characteristics; 10) the largest or the most recent articles for reports including overlapped pa-tients; 11) for PET studies, only those using [18F] fluorodeoxyglucose
(18F-FDG) as tracer, and for MR imaging, only structural MR
imag-ing; and 12) only articles in which the answer yes for the 14 questions in the QUADAS quality assessment tool6was given more than 9 times.
The studies with results of different diagnostic methods that were presented in combination and could not be separated were excluded.
Data Extraction
In each report, 2 investigators (Y.Y., Z.-X.G.) extracted and recorded data on author names, year of publication, number of patients ana-lyzed, age, male-female distribution, years of education, score of the Mini-Mental State Examination (MMSE) at baseline, inclusion and exclusion criteria, reference standard, follow-up interval, image and data analytic methods, the regions of cerebral analysis, and a 2⫻2 contingency table. We also extracted the following imaging features: for FDG-PET and SPECT, the tracer used (FDG-PET tests exclusively selected18F-FDG as tracer) and amount of tracer; for MR imaging,
magnetic field strength. To resolve disagreement between reviewers, a third reviewer (W.-S.W.) assessed all discrepant items, and the ma-jority opinion was used for analysis.
Data Synthesis and Statistical Analysis
Stata, Version 8.2 (Stata, College Station, Tex) and Meta-DiSc (Javier Zamora, Boston, Mass)9were used for statistical analysis. For each study,
we constructed a 2⫻2 contingency table in which all participants were classified as having positive or negative imaging results at baseline and as being cognitively progressive or stable during the follow-up interval. To calculate the log OR (log odds of true positive rate and log odds of false positive rate), we added 0.5 to each cell in any 2⫻2 table with zero. For each technique, we estimated the weighted summary sensitivity, specific-ity, positive and negative likelihood ratios (LR⫹, LR⫺), and OR and described a set of operating characteristics across eligible studies by con-structing a summary receiver operating characteristic (ROC) curve. We defined the maximum joint sensitivity and specificity as point Q* on a symmetric ROC curve, which is a global measure of test accuracy, similar to the area under the ROC curve (AUC). To determine whether these values were significantly affected by heterogeneity between individual studies, we performed meta-regression analysis. We considered variates to be explanatory if their regression coefficients were statistically signifi-cant (P⬍.05). Publication bias was examined by using funnel plots with the log OR plotted against the standard error of the log OR in each study.
Results
Eligible Studies
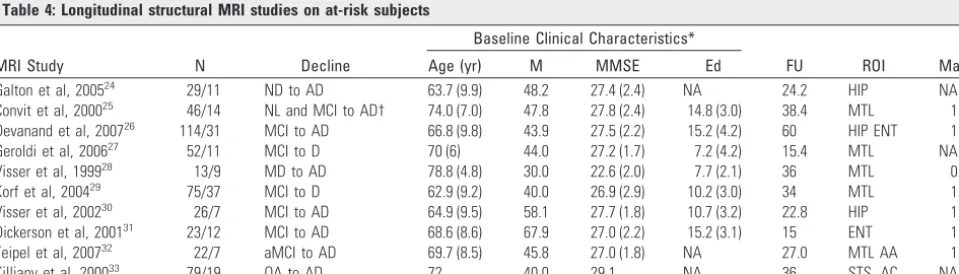
Tables 2– 4 summarize the included studies, classified accord-ing to technique.10-33Our search strategy identified 326 arti-Table 1: Diagnostic criteria of synonyms of MCI in eligible studies
Reference Synonyms of MCI Diagnostic criteria
Ishiwata et al, 200617 AAMI 1) Subjective complaints; 2) absence of impaired social or occupational function, 3)⬍1.5 SDs below
the normal age on the Benton Visual Retention Test; 4) CDR⫽0.5; 5) preserved basic daily activities.
Galton et al, 200524 Questionable dementia 1) Substantiated reports of memory impairment; 2) preserved basic daily activities; 3) MMSE ⱖ23; 4)
equivalent CDR score of 0.5 Johnson et al, 199818
Killiany et al, 200033
Questionable AD CDR⫽0.5
Visser et al, 199928 Minimal dementia 1) Limited and variable impairment in cognitive and social functioning, such as difficulty with learning
and recalling events; 2) a tendency to misplace possessions and minor errors in orientation; 3) DSM-IIIR criteria of dementia were not met; 4) similar entities are⬙questionable dementia⬙or CDR
⫽0.5 or GDS⫽3
Note:—AAMI indicates age-associated memory impairment; CDR, clinical dementia rating; GDS, geriatric depression scale; MCI, mild cognitive impairment; AD, Alzheimer disease; MMSE, Mini-Mental State Examination.
FUNCTIONAL
ORIGINAL
[image:2.594.52.532.58.184.2]cles. After we ruled out the obviously irrelevant abstracts, 66 studies were left, and their full texts were obtained, 19 of which satisfied all inclusion criteria.11,13,14,16-21,23-28,30-33Forty-seven articles were excluded for the following reasons: 1) enrolling exclusively demented (n⫽16) or healthy subjects (n⫽3); 2) cross-sectional studies (n⫽4) or longitudinal studies not following clinical diagnosis or histopathologic diagnosis as a reference standard (n⫽1); 3) presented results from a com-bination of other diagnostic modalities such as neuropsycho-logical tests that could not be differentiated (n⫽3); 4) not presenting sufficient data to create a 2⫻2 contingency table (n⫽16); 5) review or symposium (n⫽3); and 6) clinical trials of medicine (n⫽1).
Although the imaging analytic method was not available in the study by Silverman et al,15it was stated that to avoid bias, at the time the scan findings were reported, readers were blinded to clinical follow-up data of scanned patients; therefore, the study was also included. Our manual search of the reference
lists of retrieved articles and several reviews and articles citing these articles identified 5 articles that met all inclusion crite-ria.10,12,15,22,29Although the article of Huang et al, published in 2003,22overlapped another eligible study published in 2002,23 the end point of patients in the latter was diagnosis of AD, which was more relevant to the aim of our meta-analysis than the former with the end point of dementia; thus, analyses were also done including the article in 2002. Therefore, 24 eligible studies10-33(6 FDG-PET, 8 SPECT, and 10 MR imaging) were finally included in the meta-analysis.
Some enrolled patients were diagnosed with synonyms of MCI as mentioned before. Because these criteria were similar to those of MCI, we accepted these patients as having MCI (Table 1). Four studies narrowed their included patients to those having amnestic MCI,11,13,21,32the most common form of MCI with a higher risk of progressing to AD (10%–30% per year).5Although other forms of MCI were not so tightly asso-ciated with memory disturbance and might progress to disor-Table 2: Longitudinal FDG-PET studies on at-risk subjects
Study N Decline
Baseline Clinical Characteristics*
FU Method
Age (yr) M MMSE Ed
Chételat et al, 200310 17/7 MCI to AD 69.9 (6.7) 47.1 27.2 (1.3) NA 18 SPM
Anchisi et al, 200511 48/14 aMCI to AD 67.7 (8.3) 50.7 27.7 (1.7) 11.0 (4.7) 12 SPM
Arnaiz et al, 200112 20/11 MCI to AD 62.7 (8.5) 60.0 26.9 (2.3) 11.6 (2.1) 36.8 rCMRGlu
Mosconi et al, 200413 37/8 aMCI to AD 67.1 (7.7) 45.9 28.0 (1.5) 9.6 (4.7) 12.0 SPM
Drzezga et al, 200514 30/12 MCI to AD 70.4 (7.8) 46.7 26.9 (1.9) 11.6 (3.4) 15 NEUROSTAT
Silverman et al, 200315 128/82 MCI to D 66 49.1 24 (6.4) NA 34.8 NA
Note:—aMCI indicates amnestic MCI; N, number of patients analyzed/number of conversions; M, % of male subjects; Ed, years of education; FU, mean follow-up time in months; D, dementia; SPM, statistical parametric mapping; rCMRGlu, regional cerebral glucose metabolic rates; NEUROSTAT, neurological statistical image analysis software; NA, not available; FDG-PET, fluorodeoxyglucose–positron-emission tomography.
[image:3.594.55.532.63.147.2]* Each cell was listed as mean value (SD).
Table 3: Longitudinal SPECT studies on at-risk subjects
Study N Decline
Baseline Clinical Characteristics*
FU Tracer
Age (yr) M MMSE Ed
Borroni et al, 200616 27/18 MCI to AD 69.4 (7.1) 22.2 27.5 (1.9) NA 24 ECD 1110 MBq
Ishiwata et al, 200617 12/7 AAMI to D 74 33.3 NA NA 36 IMP 222 MBq
Johnson et al, 199818 45/18 QA to AD 72.5 NA NA 14.8 ⱖ24 HMPAO 20 mCi
Encinas et al, 200319 42/21 MCI to AD 76.5 (4.2) 35.7 NA NA 12–36 ECD 750 MBq
O’Mahony et al, 199420 15/11 MCI to AD 72.6 33.3 23.3 NA 6 HMPAO 740 MBq
Hirao et al, 200521 76/52 aMCI to AD 69.0 (8.6) 48.7 26.5 (1.6) 12.2 (2.9) 36 ECD 600 MBq
Huang et al, 200322 82/28 MCI to D 60.9 (9.2) 45.1 NA NA 26.4 HMPAO 1000 MBq
Huang et al, 200223 54/17 MCI to AD 61.3 (8.2) 38.9 26.7 (2.2) NA 28.9 HMPAO 1000 MBq
Note:—ECD indicates ethyl cysteinate dimer; IMP, iodoamphetamine; HMPAO, hexamethyl propyleneamine oxime; QA, questionable AD; SPECT, single-photon emission tomography. * Each cell was listed as mean value (SD).
Table 4: Longitudinal structural MRI studies on at-risk subjects
MRI Study N Decline
Baseline Clinical Characteristics*
FU ROI Mag
Age (yr) M MMSE Ed
Galton et al, 200524 29/11 ND to AD 63.7 (9.9) 48.2 27.4 (2.4) NA 24.2 HIP NA
Convit et al, 200025 46/14 NL and MCI to AD† 74.0 (7.0) 47.8 27.8 (2.4) 14.8 (3.0) 38.4 MTL 1.5
Devanand et al, 200726 114/31 MCI to AD 66.8 (9.8) 43.9 27.5 (2.2) 15.2 (4.2) 60 HIP ENT 1.5
Geroldi et al, 200627 52/11 MCI to D 70 (6) 44.0 27.2 (1.7) 7.2 (4.2) 15.4 MTL NA
Visser et al, 199928 13/9 MD to AD 78.8 (4.8) 30.0 22.6 (2.0) 7.7 (2.1) 36 MTL 0.6
Korf et al, 200429 75/37 MCI to D 62.9 (9.2) 40.0 26.9 (2.9) 10.2 (3.0) 34 MTL 1.5
Visser et al, 200230 26/7 MCI to AD 64.9 (9.5) 58.1 27.7 (1.8) 10.7 (3.2) 22.8 HIP 1.5
Dickerson et al, 200131 23/12 MCI to AD 68.6 (8.6) 67.9 27.0 (2.2) 15.2 (3.1) 15 ENT 1.5
Teipel et al, 200732 22/7 aMCI to AD 69.7 (8.5) 45.8 27.0 (1.8) NA 27.0 MTL AA 1.5
Killiany et al, 200033 79/19 QA to AD 72 40.0 29.1 NA 36 STS, AC NA
Note:—MRI indicates MR imaging; AA, neocortical association areas; AC, anterior cingulate; ENT, entorhinal cortex; HIP, hippocampus; Mag, magnet strength in Teslas; MD, minimal dementia; MTL, medial temporal lobe; ND, non-demented; NL, normal controls; STS, superior temporal sulcus.
[image:3.594.54.539.200.312.2] [image:3.594.57.537.348.485.2]ders other than AD, we still treated these studies as eligible, taking into account the limited number of included studies. To evaluate and explain the heterogeneity, we performed sub-group analyses between studies enrolling patients of different diagnoses. Although most articles adopted the diagnosis of AD as an end point, progression was evaluated according to pa-tients’ changes in MMSE scores in the study of Silverman et al.15In the 4 other studies, patients progressed to AD as well as to other types of dementia.17,22,27,29Taking into account the relatively small portion of dementia other than AD (non-AD-dementia/all subjects, 16.9%), we still enrolled these studies. Subgroup analyses were executed afterward to evaluate the contribution of the 4 studies to the heterogeneity. Allowing both between- and within-study variation, we selected a ran-dom-effects model whose results were more conservative than those with a fixed-effects model.
Data Synthesis
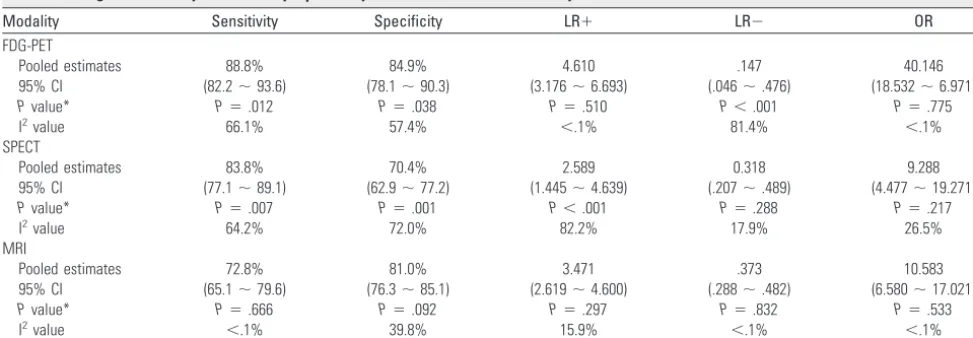
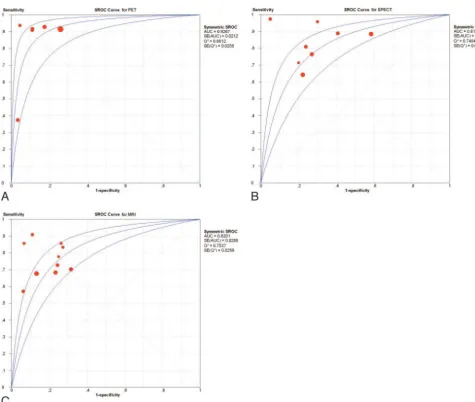
For each technique, the weighted summary of sensitivity, spec-ificity, LR, OR, and their 95% CIs,Pvalue for heterogeneity, and I2value are summarized in Table 5. No 95% CI of OR and LR included 1, confirming the diagnostic value of all modali-ties. Although no statistically significant difference was found (P⬎.05) for each technique in pooled sensitivity, sensitivity, and LR⫺, FDG-PET had the highest pooled OR and LR⫹ (P⬍.05). No statistical difference was confirmed between SPECT and MR imaging. The summary ROC curves, Q* in-dex, and AUC for FDG-PET, SPECT, and MR imaging are shown in Fig 1. The Q* index estimates for FDG-PET, SPECT, and MR imaging were 0.86, 0.75, and 0.76, respectively. No significant difference was found in analyses, including the ar-ticle of Huang et al in 2002.23
I2is an index for heterogeneity:I2⫽(Q⫺[k⫺1]) /Q⫻ 100%, whereQis the2value of heterogeneity andkis the number of studies included. Along withP⬍.05 for heteroge-neity,I2⬎50% further indicates heterogeneity between stud-ies. The heterogeneity in the LR⫺test of FDG-PET and the LR⫹test of SPECT was highly statistically significant (P⬍
.001 andI2⬎80%), confirming that there was strong evidence of between-study heterogeneity (Table 5). To assess possible explanations for the heterogeneity, we applied single-factor
meta-regression analysis by adding the publication year, age, male-female distribution, follow-up interval, years of educa-tion, and mean score of the MMSE at baseline separately as variates. No apparent relationships were found between these variables and log OR (P⬎.05). Statistical significance (P⫽
.027) was found only between technique and log OR, with a regression coefficient of⫺0.575. Subgroup analyses for diag-noses at baseline (MCI versus synonyms of MCI) and patients’ end points (exclusively AD versus dementia including AD) were also executed regardless of technique, due to the limited amount of studies. The OR of studies evaluating patients con-verting to AD was higher than that evaluating patients with dementia (P⫽.03), whereas the sensitivity, specificity, LR⫹, and LR⫺showed no statistical difference (P⬎.05). No signif-icant difference was found between studies differing in inclu-sive diagnoses. Fig 2 demonstrates the funnel plots of all mo-dalities. Marked asymmetry, with studies missing from the bottom left quadrant, suggests a publication bias; additional studies with an OR of approximately 1 might have been con-ducted but not published because of unfavorable results.34
Discussion
This study aimed to estimate and compare the ability of FDG-PET, SPECT, and structural MR imaging to predict conver-sion to AD in patients with MCI across a number of published studies. Our meta-analysis, including data from 1112 patients, showed that FDG-PET had moderately better concordance with follow-up results for the prediction of conversion. Ap-proximately 88.9% of the patients with progressive MCI were scanned as positive by FDG-PET, whereas 84.9% of stable pa-tients had negative FDG-PET at baseline. In addition, this study aimed to formally assess the heterogeneity in these stud-ies. The heterogeneity in the LR⫺test of FDG-PET and the LR⫹test of SPECT was highly statistically significant for the between-study random effect (P⬍.001 and I2⬎80%); how-ever, formal meta-regression analyses showed no significant associations between the mean score of the MMSE at baseline, age, years of education, male-female distribution, follow-up interval, and log OR; statistical significance was found only between technique and log OR. We performed subgroup anal-yses, respectively, between studies enrolling MCI and syn-Table 5: Weighted summary of sensitivity, specificity, LR, and OR for each modality
Modality Sensitivity Specificity LR⫹ LR⫺ OR
FDG-PET
Pooled estimates 88.8% 84.9% 4.610 .147 40.146
95% CI (82.2⬃93.6) (78.1⬃90.3) (3.176⬃6.693) (.046⬃.476) (18.532⬃6.971)
Pvalue* P⫽.012 P⫽.038 P⫽.510 P⬍.001 P⫽.775
I2value 66.1% 57.4% ⬍.1% 81.4% ⬍.1%
SPECT
Pooled estimates 83.8% 70.4% 2.589 0.318 9.288
95% CI (77.1⬃89.1) (62.9⬃77.2) (1.445⬃4.639) (.207⬃.489) (4.477⬃19.271)
Pvalue* P⫽.007 P⫽.001 P⬍.001 P⫽.288 P⫽.217
I2value 64.2% 72.0% 82.2% 17.9% 26.5%
MRI
Pooled estimates 72.8% 81.0% 3.471 .373 10.583
95% CI (65.1⬃79.6) (76.3⬃85.1) (2.619⬃4.600) (.288⬃.482) (6.580⬃17.021)
Pvalue* P⫽.666 P⫽.092 P⫽.297 P⫽.832 P⫽.533
I2value ⬍.1% 39.8% 15.9% ⬍.1% ⬍.1%
[image:4.594.53.540.55.224.2]onyms of MCI and between studies adopting different end points (exclusively AD and dementia including AD); still, a statistical difference was found only in OR in the latter com-parison. However, it was recognized that estimates of such effects may be imprecise if only a small number of studies were
available. It might be that these relationships did exist; meta-regression could detect such associations only if there was suf-ficient variability in the explanatory variable between studies. On the other hand, the only significant difference found in subgroup analyses might be just by chance due to the small ratio of studies adopting non-AD patients and the small ratio of non-AD patients in these studies.
The analyses we performed to detect heterogeneity were far from sufficient; this feature might explain the mostly negative results in the heterogeneity tests. Although meta-regression analyses were performed, some results were difficult to assess definitively because certain variables were only available in half of the eligible articles, such as years of education. Other possible factors, such as administered medications, genetic status,35,36drop-out rate, and interval between clinical diag-nosis and imaging, were not discussed because few eligible studies reported them. Another example of difference lay in the reliability of the image-analysis technique. Although we required the eligible studies to have adopted semiquantitative analytic techniques such as region-of-interest, statistical para-metric mapping, and 3D stereotactic surface projection to avoid prepossession of clinical diagnosis, the parameters dif-Fig 1.A⫺C, Summary ROC curves for PET, SPECT, and MR imaging. The middle black line is the summary ROC (SROC) curve, and the 2 lines beside it are 95% CIs. SE(AUC) indicates standard error of area under the ROC curve; SE(Q*), standard area of Q*; MRI, MR imaging.
[image:5.594.53.528.37.439.2] [image:5.594.54.286.473.639.2]fered among studies. Similar results occurred for scanning methodology and acquisition protocol, especially in MR im-aging. Although variables differed among studies, such as TR, TE, FOV, flip angle, section thickness, and matrix size, there were too many variables in methodology and acquisition pro-tocol of MR imaging to include. Subgroup analyses were also impossible due to the limited number of studies in each subgroup.
This study has several limitations. A notable one was the small number of studies included, which obviously restricted the statistical analysis we performed and thus impaired the explanatory power of heterogeneity in our meta-analysis. We attempted to include as many studies as possible; however, achieving an adequately homogenous sample of studies re-quired the exclusion of many studies. It was possible that pub-lication bias in this field restricted the pubpub-lication of studies with less-promising results, because the funnel plots suggested a lack of studies with an OR value of approximately 1. Another might be that we only included studies published in English, which might invoke the so-called Tower of Babel bias.37 Al-though certain less-qualified studies would be neglected by limiting publication language to English, the Tower of Babel bias, which refers to the fact that investigators working in a language other than English could be sending only studies with positive results to international journals, would make it possible that studies with negative results could have been left out.
The limited number of studies included led to another lim-itation: It prohibited subgroup analyses and gave a low explan-atory power to heterogeneity tests. Therefore, our use of tests to guide us toward the relevant subset was not entirely satis-factory, and further analyses of variables within each tech-nique group, such as tracer, region of interest, and magnetic field strength, were impossible.
In the contrast, compromises were required to ensure a sufficient sample of studies. For example, the variability in follow-up interval was considerable between included studies and was deemed a further limitation. The reported conversion rate of MCI to AD was 12.0% per year.38It is conceivable that a relatively higher percent of patients with baseline MCI would progress to dementia after a longer follow-up interval and thus impact the prediction value of the imaging technique. Al-though no significant contribution to heterogeneity of fol-low-up interval was demonstrated by using meta-regression analysis, we could not exclude the possibility that heterogene-ity did exist, accounting for the misidentification that might arise from the small sample size in meta-regression.
Finally, a significant limitation was related to the fact that there were no gold standards for the progression or the inter-pretation of PET, SPECT, or MR imaging, though high rates of interobserver concordance were assured in the latter. In some respects, a region-of-interest approach may enhance reliabil-ity, though the selection of region of interest may influence the results. A recent study39found that atrophy of the left lateral temporal lobe and left parietal cortex independently predicted conversion to dementia; however, in our meta-analysis, we did not compare further the diagnostic value of each region of interest and the influence it posed to heterogeneity due to the very limited eligible subgroup studies. Automated deforma-tion-based analysis has been used to detect a specific pattern of
brain atrophy in AD, but it lacked an established model to derive the individual risk of AD in patients with MCI.32
Conclusions
This meta-analysis assessed and compared the diagnostic abil-ity of the noninvasive imaging methods that are currently used for prediction of conversion to AD in patients with MCI, which demonstrated that FDG-PET is a useful supplement to current surveillance techniques, with a predictive accuracy better than that of SPECT or MR imaging.
Acknowledgments
We thank Professor Jian-Chao Bian of the School of Public Health, Fudan University, for his statistical analysis advice and reviewers for their insightful comments, which certainly helped us to improve this work.
References
1. Small GW, Rabins PV, Barry PP, et al.Diagnosis and treatment of Alzheimer disease and related disorders: Consensus statement of the American Associa-tion for Geriatric Psychiatry, the Alzheimer’s AssociaAssocia-tion, and the American Geriatrics Society.JAMA1997;278:1363–71
2. DeCarli C.Mild cognitive impairment: prevalence, prognosis, aetiology, and treatment.Lancet Neurol2003;2:15–21
3. Petersen RC, Stevens JC, Ganguli M, et al.Practice parameter: early detection of dementia—mild cognitive impairment (an evidence-based review). Report of the Quality Standards Subcommittee of the American Academy of Neurol-ogy.Neurology2001;56:1133– 42
4. Petersen RC, Doody R, Kurz A, et al.Current concepts in mild cognitive im-pairment.Arch Neurol2001;58:1985–92
5. Trikalinos TA, Salanti G, Zintzaras E, et al.Meta-analysis methods.Adv Genet
2008;60:311–34
6. Whiting P, Rutjes AWS, Reitsma JB, et al.The development of QUADAS: a tool for the quality assessment of studies of diagnostic accuracy included in sys-tematic reviews.BMC Med Res Methodol2003;3:25
7. McKhann G, Drachman D, Folstein M, et al.Clinical diagnosis of Alzheimer’s disease: report of the NINCDS-ADRDA Work Group under the auspices of Department of Health and Human Services Task Force on Alzheimer’s Dis-ease.Neurology1984;34:939 – 44
8. American Psychiatric Association.American Psychiatric Association Committee on Nomenclature and Statistics: Diagnostic and Statistical Manual Of Mental Dis-orders.4th ed. Washington, DC: American Psychiatric Press; 1994
9. Zamora J, Abraira V, Muriel A, et al.Meta-DiSc: a software for meta-analysis of test accuracy data.BMC Med Res Methodol2006;6:31
10. Che´telat G, Desgranges B, de la Sayette V, et al.Mild cognitive impairment: can FDG-PET predict who is to rapidly convert to Alzheimer’s disease?Neurology
2003;60:1374 –77
11. Anchisi D, Borroni B, Franceschi M, et al.Heterogeneity of brain glucose me-tabolism in mild cognitive impairment and clinical progression to Alzheimer disease.Arch Neurol2005;62:1728 –33
12. Arnaiz E, Jelic V, Almkvist O, et al.Impaired cerebral glucose metabolism and cognitive functioning predict deterioration in mild cognitive impairment.
Neuroreport2001;12:851–55
13. Mosconi L, Perani D, Sorbi S, et al.MCI conversion to dementia and the APOE genotype: a prediction study with FDG-PET.Neurology2004;63:2332– 40 14. Drzezga A, Grimmer T, Riemenschneider M, et al.Prediction of individual
clinical outcome in MCI by means of genetic assessment and (18)F-FDG PET.
J Nucl Med2005;46:1625–32
15. Silverman DHS, Truong CT, Kim SK, et al.Prognostic value of regional cere-bral metabolism in patients undergoing dementia evaluation: comparison to a quantifying parameter of subsequent cognitive performance and to prog-nostic assessment without PET.Mol Genet Metab2003;80:350 –55 16. Borroni B, Anchisi D, Paghera B, et al.Combined 99mTc-ECD SPECT and
neuropsychological studies in MCI for the assessment of conversion to AD.
Neurobiol Aging2006;27:24 –31. Epub 2005 Mar 24
17. Ishiwata A, Sakayori O, Minoshima S, et al.Preclinical evidence of Alzheimer changes in progressive mild cognitive impairment: a qualitative and quanti-tative SPECT study.Acta Neurol Scand2006;114:91–96
18. Johnson KA, Jones K, Holman BL, et al.Preclinical prediction of Alzheimer’s disease using SPECT.Neurology1998;50:1563–71
impair-ment to Alzheimer’s disease.Eur J Nucl Med Mol Imaging2003;30:1473– 80. Epub 2003 Aug 15
20. O’Mahony D, Coffey J, Murphy J, et al.The discriminant value of semiquanti-tative SPECT data in mild Alzheimer’s disease.J Nucl Med1994;35:1450 –55 21. Hirao K, Ohnishi T, Hirata Y, et al.The prediction of rapid conversion to
Alzheimer’s disease in mild cognitive impairment using regional cerebral blood flow SPECT.Neuroimage2005;28:1014 –21
22. Huang C, Wahlund L, Almkvist O, et al.Voxel- and VOI-based analysis of SPECT CBF in relation to clinical and psychological heterogeneity of mild cognitive impairment.Neuroimage2003;19:1137– 44
23. Huang C, Wahlund L, Svensson L, et al.Cingulate cortex hypoperfusion pre-dicts Alzheimer’s disease in mild cognitive impairment. BMC Neurol
2002;2:9 –14
24. Galton CJ, Erzincxlioglu S, Sahakian BJ, et al.A comparison of the Adden-brooke’s Cognitive Examination (ACE), conventional neuropsychological as-sessment, and simple MRI-based medial temporal lobe evaluation in the early diagnosis of Alzheimer’s disease.Cogn Behav Neurol2005;18:144 –50 25. Convit A, Asis J, Leon MJ, et al.Atrophy of the medial occipitotemporal,
infe-rior, and middle temporal gyri in non-demented elderly predicts decline to Alzheimer’s disease.Neurobiol Aging2000;21:19 –26
26. Devanand DP, Pradhaban G, Liu X, et al.Hippocampal and entorhinal atrophy in mild cognitive impairment prediction of Alzheimer disease.Neurology
2007;68:828 –36
27. Geroldi C, Rossi R, Calvagna C, et al.Medial temporal atrophy but not memory deficit predicts progression to dementia in patients with mild cognitive im-pairment.J Neurol Neurosurg Psychiatry2006;77:1219 –22
28. Visser PJ, Scheltens P, Verhey FRJ, et al.Medial temporal lobe atrophy and memory dysfunction as predictors for dementia in subjects with mild cogni-tive impairment.J Neurol1999;246:477– 85
29. Korf ESC, Wahlund L, Visser PJ, et al.Medial temporal lobe atrophy on MRI
predicts dementia in patients with mild cognitive impairment.Neurology
2004;63:94 –100
30. Visser PJ, Verhey FRJ, Hofman PAM, et al.Medial temporal lobe atrophy pre-dicts Alzheimer’s disease in patients with minor cognitive impairment.J Neu-rol Neurosurg Psychiatry2002;72:491–97
31. Dickerson BC, Goncharova I, Sullivan MP, et al.MRI derived entorhinal and hippocampal atrophy in incipient and very mild Alzheimer’s disease. Neuro-biol Aging2001;22:747–54
32. Teipel SJ, Born C, Ewers M, et al.Multivariate deformation-based analysis of brain atrophy to predict Alzheimer’s disease in mild cognitive impairment.
Neuroimage2007;38:13–24
33. Killiany RJ, Gomez-Isla T, Moss M, et al.Use of structural magnetic resonance imaging to predict who will get Alzheimer’s disease. Ann Neurol
2000;47:430 –39
34. Gould MK, Maclean CC, Kuschner WG, et al.Accuracy of positron emission tomography for diagnosis of pulmonary nodules and mass lesions: a meta-analysis.JAMA2001;285:914 –24
35. Del Bo R, Scarlato M, Ghezzi S, et al.Is M129V of PRNP gene associated with Alzheimer’s disease? A case-control study and a meta-analysis.Neurobiol Ag-ing2006;27:770.e1–770.e5. Epub 2005 Aug 15
36. Koster MN, Dermaut B, Cruts M, et al.The alpha2-macroglobulin gene in AD: a population-based study and meta-analysis.Neurology2000;55:678 – 84 37. Gre´goire G, Derderian F, Le Lorier J.Selecting the language of the publications
included in a meta-analysis: is there a Tower of Babel bias?J Clin Epidemiol
1995;48:159 – 63
38. Petersen RC, Smith GE, Waring SC, et al.Mild cognitive impairment: clinical characterization and outcome.Arch Neurol1999;56:303– 08