J. Range Manage.
56: 234-246 May 2003
Evaluation of USLE and RUSLE estimated soil loss on rangeland
KENNETH E. SPAETH JR., FREDERICK B. PIERSON JR., MARK A. WELTZ, AND WILBERT H. BLACKBURN
Authors are USDA-NRCS Rangeland Hydrologist and USDA-ARS Research Hydrologist, both at NW Watershed Research Center, Boise, Ida; USDA-ARS National Program Staff, Beltsville, Md.; and USDA- ARS Area Director, Ft. Collins Colo.
Abstract
The Universal Soil Loss Equation (USLE) and the Revised Universal Soil Loss Equation (RUSLE 1.06) were evaluated with rainfall simulation data from a diverse set of rangeland vegeta- tion types (8 states, 22 sites, 132 plots). Dry, wet, and very-wet rainfall simulation treatments were applied to the study plots within a 2-day period. The rainfall simulation rate was 65mm/hr for the dry and wet simulation treatments and alternated
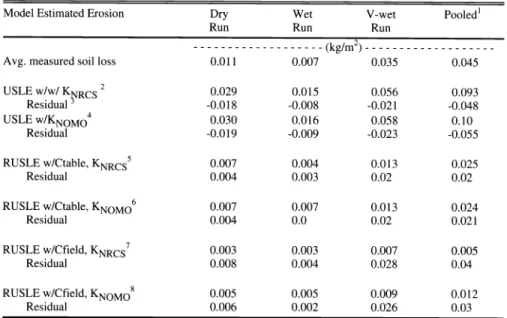
between 65-130 mm/hr for the very-wet treatment. Average soil loss for all plots for the representative simulation runs were:
0.011 kg/m2, 0.007 kg/m2, and 0.035 kg/m2 for the dry, wet, and very-wet simulation treatments, respectively. The Nash-Sutcliffe Model efficiencies (R2eff) of the USLE for the dry, wet, very-wet simulation treatments and sum of all soil loss measured in the three composite simulation treatments (pooled data) were nega- tive. This indicates that the observed mean measured soil loss from the field rainfall simulations is better than predicted USLE soil loss. The USLE tended to consistently overpredict soil loss for all 3 rainfall simulation treatments. As the USLE predicted values increased in magnitude, the error variance between pre- dicted and observed soil loss increased. Nash-Sutcliffe model effi- ciency for the RUSLE was also negative, except for the dry run simulation treatment [Reef f = 0.16 using RUSLE cover manage- ment (C) subfactor parameters from the RUSLE manual (Ctable), NRCS soil erodibility factor (K); and R2eff = 0.17 with Ctabte and K estimated from the soil-erodibility nomograph]. In comparison to the USLE, there was less error between observed and RUSLE predicted soil loss. The RUSLE error variances showed a consis- tent trend of underpredicted soil loss among the 3 rainfall simu- lation treatments. When actual field measured root biomass, plant production and soil random roughness values were used in calculating the RUSLE C subfactors: the R2eff values for the dry, wet, very-wet rainfall simulation treatments and the pooled data were all negative.
Key Words: erosion models, sheet and rill erosion, rainfall simu- lation experiments, rangeland health
Since the mid 1940's, the United States Department of Agriculture (USDA) has been using erosion prediction equations
as a guide in conservation planning to select suitable structural and field management practices on cropland. The USDA-Natural Resources Conservation Service (NRCS) first applied the
Manuscript accepted 13 Jul. 02.
Resumen
La Ecuacion Universal de Perdida de Suelo (EUPS) y la Ecuacion Universal de Perdida de Suelo Revisada (EUPSR 1.06) fueron evaluadas con datos de simulacion de lluvia de un grupo diverso de tipos de vegetacion de pastizal (8 estados, 22 sitios y 132 parcelas). Los tratamientos de simulacion de lluvia, seco, humedo y muy humedo se aplicaron en las parcelas de estudio dentro de un periodo de 2 anos. Las tasa de simulacion de lluvia fue de 65 mm/hr para los tratamientos de simulacion seco y humedo y alternada entre 65-130 mm/hr para el tratamiento muy humedo. Los promedios de perdida de suelo para todas las parcelas en las corridas de simulacion representativas fueron:
0.011 kg/m2, 0.007 kg/m2 y 0.035 kg/m2 para los tratamientos seco humedo y muy humedo respectivamente. Las eficiencias del modelo Nash-Sutcliffe (R2eff) de la EUPS para los tratamientos seco, humedo y muy humedo y la suma de todo el suelo perdido medido en los tres tratamientos compuestos de simulacion (datos mezclados) fueron negativas. Esto indica que la media de perdi- da de suelo observada en las simulaciones de lluvia en el campo es mejor que la predicha por la EUPS. La EUPS tendio a sobepredecir constantemente la perdida de suelo para los 3
tratamientos de simulacion de lluvia. Conforme los valores predichos por la EUPS se incrementaron en magnitud, la varian- za del error entre la perdida de suelo predicha y observada se incremento. La efciencia del modelo Nash-Sutcliffe tambien fue negativa, excepto para el tratamiento de simulacion seco [R2eff = 0.16, usando los parametros del subfactor el manejo de cobertu- ra © del manual de la EUPSR (Cb1a), la erodabilidad del suelo, factor (K) de la EUPS y R2eff = 0.17 con Ctabla y K estimados del nomografo de la erodabilidad de suelo]. En comparacion con la EUPS, hubo menos error entre la perdida de suelo observada y la predicha por la EUPSR. Las varianzas del error de la EUPSR mostraron un tendencia consistente de perdida de suelo no predicha entre los 3 tratamientos de simulacion de lluvia.
Conforme la cantidad a intensidad de la lluvia se incrementan y el suelo viene a estar mas saturado aumento la propension la subestimacion. Cuando la biomasa radical actual, la produccion de planta y la rugosidad aleatoria del suelo se usaron en calcular los subfactores C del EUPSR: los valores de R2eff fueron nega- tivos para los tratamientos seco, humedo y muy humedo y los datos promediados.
Universal Soil Loss Equation (USLE) on cropland in the early 1960' s to predict sheet and rill erosion. The USLE soil loss esti- mation and erosion research progressed with 2 Agricultural Handbook publications for predicting rainfall erosion losses
234 JOURNAL OF RANGE MANAGEMENT 56(3) May 2003
(Wischmeier and Smith 1965, 1978).
Wischmeier (1976) stated: "the USLE was designed to predict soil loss from sheet and rill erosion" and soil loss predicted by the LISLE is "that soil moved off the par- ticular slope segment represented by the selected topographic factor." The LISLE provided conservation planners with the ability to predict longtime average rates of soil erosion for different cropping systems and management practices in association with a specified soil type, rainfall pattern, and topography. When these predicted losses were compared with NRCS soil loss tolerances (T), they provided specific guidelines for implementing erosion con- trol within specified limits (Wischmeier and Smith 1978).
Wischmeier (1976) stated that the USLE
"permits methodical decision-making in soil conservation planning on a site basis."
Renard et al. (1997) state that for more than 4 decades, the technology has been valuable as a conservation-planning guide.
Government agencies have used the tech- nology for this purpose-to evaluate the benefits of various conservation practices;
however, other uses have emerged over the years such as ascertaining compliance with a soil loss standard and a means to prioritize programs based on soil loss.
These other uses, whether appropriate or inappropriate have been a point of debate for almost as long as the technology has existed (Wischmeier 1976, Blackburn
1980, Wight and Siddoway 1982).
During the early 1970's, the NRCS and the USDA-Forest Service met to discuss the extension of USLE to undisturbed land, which included rangeland. Since no field data was available on rangelands (as was for cropland: 10,000 plot-years over 40 years), Wischmeier developed a sub- factor method for determining permanent pasture, rangeland, and woodland cover- management factors (C) by extrapolating crop residue to vegetation cover on range and woodland (Wischmeier 1975). In the early 1980's, the NRCS was concerned with the adequacy of the LISLE because of anticipated Congressional legislation, which would affect USDA policies. The 1985 Farm Bill required that conservation plans on highly erodible cropland were necessary in order to participate in certain USDA farm programs and cost/share pro- grams. It was becoming increasingly clear that the NRCS needed and desired improved erosion prediction technology.
A plan was developed in USDA to update the LISLE and begin developing improved erosion prediction technology based on
process-based concepts (the Water
Erosion Prediction Project, WEPP; Foster and Lane 1987, Flanagan and Livingston 1995). The USLE was evolving using sub- factor methods and the USDA recognized the value of incorporating this technology into a computer program format and extending the technology beyond the orig- inal objectives of the early 1980's. The result of this effort was the Revised Universal Soil Loss Equation (RUSLE) (Renard et al. 1997).
Several studies have evaluated the USLE on rangelands. Simanton et al.
(1980) compared observed and USLE pre- dicted soil loss on 3 brush-covered and 1
grassland-covered watershed in southeast- ern Arizona. On brushland watersheds, they concluded that the LISLE tended to over predict soil loss during small runoff events and under predicted soil loss with large runoff events. On a grass-covered watershed, soil loss was over predicted.
Hart (1984) conducted rainfall simulation studies on sagebrush/grass plant commu- nities in northern Utah. On vegetated plots, the USLE overestimated soil loss on 10% and 32% slope plots. The USLE esti- mates were less accurate on the steeper slope. In rangeland rainfall simulation experiments on 28 sagebrush and shad- scale sites in southwest Idaho and north- central Nevada, Johnson et al. (1984) compared soil loss from field plots with the LISLE predicted values for tilled,
clipped, grazed, and ungrazed plots. They found good relationships (r2=0.89) between observed and predicted soil loss on tilled (vegetation removed and soil rototilled) rangeland sites. On all vegetat- ed plots combined (clipped, grazed, and ungrazed plots), coefficients of determina- tion were low (r2= 0.27) between observed and predicted soil loss. Simulated soil loss from ungrazed sites (10 years deferment) showed consistently lower values than the USLE predicted values. Johnson et al.
(1984) summarized that "variability in predicted soil losses from sagebrush rangelands indicates a need for more accu- rate quantification of cover and manage-
ment conditions."
Renard and Foster (1985) stated: "fun- damentally, the USLE is scientifically sound, although clearly, its factor values can be improved for western rangelands."
Hawkins (1985) stated: the LISLE "does not lead directly to erosion, but produces the intermediate product of storm runoff ...
the complications of time and spatial varia- tions in site properties are usually not con- sidered, even when of known conse- quence." Weltz et al. (1998) reviewed sev- eral limitations regarding the LISLE:
"LISLE is a lumped empirical model that does not separate factors that influence soil erosion, such as plant growth, decom- position, infiltration, runoff, soil detach- ment, or soil transport. The USLE was designed to estimate sheet and rill erosion from hillslope areas. It was not designed to address soil deposition and channel or gully erosion within watersheds." Renard et al. (1991) summarized, "the fundamen- tal erosion processes and their interactions are not represented, explicitly" in the LISLE.
Advancements in hydrology and erosion research have been incorporated into the RUSLE 1.06 (hereon, RUSLE is version 1.06) (Renard et al. 1997). Specific advancements since the USLE include techniques to address slopes over 20%, compound slopes, and time variance adjustments for soil erodibility (Weltz et al. 1998). The RUSLE is an index method containing factors that represent how cli- mate, soil, topography, and land use affect rill and intern!! soil erosion caused by raindrop impact and surface runoff. The RUSLE, however, does not explicitly rep-
resent the fundamental processes of detachment, deposition, and transport by rainfall and runoff, but represents the effects of these processes on soil loss. The RUSLE is based on 6 factors, which are also represented in the LISLE:
A=RKLSCP (1)
where: A = average annual soil loss, R=
rainfall-runoff erosivity factor, K = soil erodibility factor, L = slope length factor, S = slope steepness factor, C = cover-man- agement factor, and P= supporting prac- tices factor. Soil loss (erosion rate) is com- puted by substituting values for each RUSLE factor to represent conditions at a specific site. Detailed discussions of the 6 components may be found in Renard et al.
(1997).
Renard and Simanton (1990) evaluated the USLE and RUSLE predictions with measured soil loss from 17 rangeland sites in 7 western states. The simulation experi- ments consisted of natural vegetation and 2 altered treatments: l) clipping vegetation only, and 2) removing all litter, vegetation, and soil surface erosion pavement (bare plots). On bare, clipped, and natural plots combined, coefficients of determination (r2) between the RUSLE and measured soil loss (r2 = 0.66) were higher compared to the USLE (2 = 0.62). On clipped and natural plots, r2 between the RUSLE and measured soil loss (r2 = 0.36) were higher compared to the USLE (r2 = 0.08). When bare plots were included with the other 2
treatments, r2 between the USLE and
JOURNAL OF RANGE MANAGEMENT 56(3) May 2003 235
RUSLE predicted and field measured soil loss improved; i.e., the bare plots pro- duced more soil loss thus improving the
"best fitted" prediction line. The bare plot treatment may represent the "worst case scenario" encountered; however, this situ- ation is not a common occurrence on rangelands. Even after wildfire, root struc- tures remain intact in the soil surface, which help stabilize the soil surface even when live surface cover is gone. Only after severe wind and water erosion and little plant regrowth over more than 1
growing season, would the bare treatment begin to become a reality.
Using Johnson and Gordon's (1988) sagebrush-grassland rainfall simulation and erosion data from the Reynold's Experimental Watershed, Benkobi et al.
(1994) evaluated the RUSLE soil loss pre- dictions using a refined RUSLE surface cover subfactor. The RUSLE soil loss was correlated with slope steepness and length (r = 0.90), vegetation cover (r = -0.88), random roughness (r = -0.68), root bio- mass (r = -0.50), and rock cover (r = -0.42). Coefficients of determination com- paring field measured soil loss with the refined RUSLE model were 0.81 for dry and 0.50 for the wet simulation treatments.
Using the unrefined RUSLE, r2 = 0.67 for the dry treatment and r2 = 0.14 for the moist treatment. Their conclusion was that use of the refined surface cover subfactor method increased accuracy; however, the RUSLE still underpredicted actual amounts of soil loss for the sagebrush/grassland
sites. The objective of this study is to com- pare the LISLE and RUSLE (version 1.06) soil loss estimates with observed soil loss from rainfall simulation studies conducted on a large and diverse set of rangeland community types.
Procedures and Methods
Field Methodology
In 1990, the NRCS established the National Range Study Team (NRST), which was a cooperative effort between the NRCS and the USDA-Agricultural Research Service (ARS). The purpose of the team was to collect field data that would expand the database for develop- ment and implementation of the WEPP and other rangeland models within the NRCS. The study was modeled (using same simulator design and field methodol- ogy) from the original ARS-Southwest Watershed Research Center rangeland simulation experiments conducted during 1987-1988 (Renard and Simanton 1990);
however, additional sampling of vegeta- tion and soils were included.
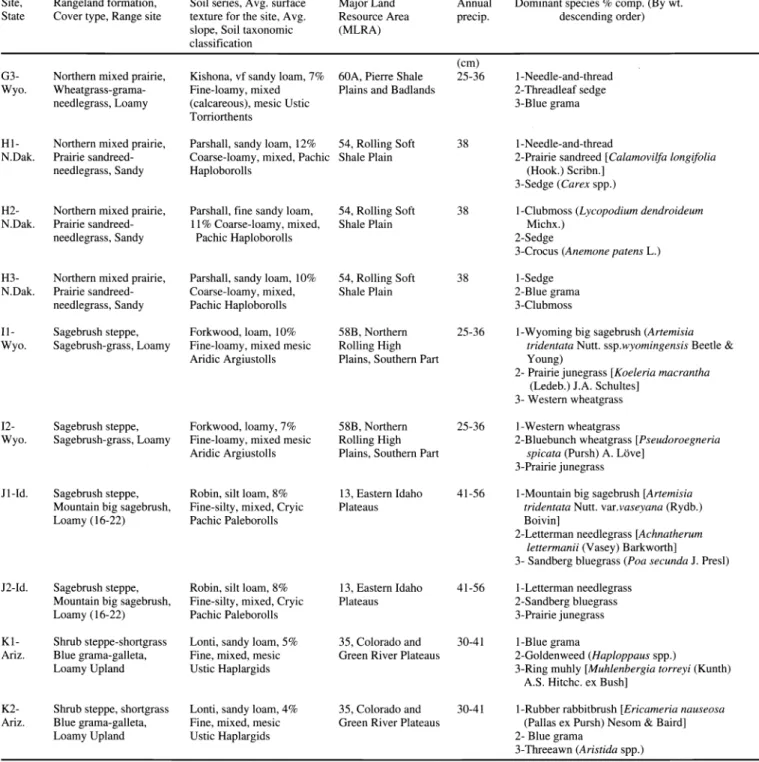
Twenty-two sites (6 plots per site), from 8 states in the NRST data set were used in this study (Table 1). Summaries of plant composition, soils, hydrology, erosion data, and management history are pub- lished in USDA (1998) and Pierson et al.
(2002). This study data set represents a total of 396 rainfall simulation runs. The original NRST data set included 2 sites each from Utah and California, but were not used in this analysis because the very- wet run simulations were not conducted.
Only natural vegetated plots were used in this study (no artificial soil altering treat- ments such as rototilling; scalping; or removing vegetation, litter, organic layer, or the 0 horizon). Site selection by the NRST was based on benchmark soils and rangeland community types. Each site was selected because it represented a major soil type within the selected Major Land Resource Area (MLRA). To insure soil uniformity at each study site, 22 pedons were examined and described morphologi- cally at 7.6 m intervals around the perime- ter of the study site to a depth of 0.5 m.
Study sites were located on slopes between 3-12%. Five soil pedon descrip- tions and samples were taken on each site.
These plots were chosen to represent dom- inant and minor soil conditions occurring at the plot level.
The rainfall simulation technology used by the NRST was developed by Swanson (1965). The NRST simulator was trailer- mounted and has ten, 7.6 m booms radiat- ing from a central stem. The arms support 30 V-jet 80100 nozzles positioned at vari- ous distances from the stem. Half of the nozzles can be opened or closed by sole- noid valves to attain target simulated rain- fall intensities of 65 mm/hr (15 nozzles open) or 130 mm/hr (30 nozzles open).
Rainfall was simulated uniformly over a 15 m diameter area where two (3.05 x 10.7 m) steel walled plots (long axis paral- lel to the slope) were located on each side of the simulator. Three rainfall simulation treatment rates were sequentially applied during the growing season: 1) dry antecedent moisture, at an application rate of 65 mm/hr until runoff equilibrium (denoted the dry run); 2) wet antecedent moisture, 24 hours later, at 65 mm/hr until runoff equilibrium (wet run); and 3) very- wet antecedent moisture, 30-min after the end of the wet application at 65 mm/hr (phase 1) until runoff equilibrium, 130 mm/hr (phase 2) until runoff equilibrium, and 65 mm/hr (phase 3) until final runoff equilibrium (very-wet run). Simulator
rainfall energy is 77% of natural rainfall when the simulator pressure and rainfall application rate using the V -jet 80100 noz- zles are held constant at 65 mm/hr (Simanton et al. 1991). The same pressure in the V -jet 80100 nozzles is used for the very-wet treatment; however, 30 nozzles are used instead of 15. The coefficient of variation of rainfall spatial distribution over the plots is < 10% (Simanton et al.
1987, Weltz et al. 1997). One recording raingage was placed between the paired plots to measure rainfall intensity. Six sta- tionary gauges were also located in each plot to measure total applied rainfall.
Runoff troughs attached to the plot cut-
off wall drained into drop-box weirs (Bonta 1998). Runoff water depths through small super critical flumes was measured using a pressure transducer bub- bler gauge on each plot. Calibration curves allowed conversion of instantaneous depth to flow rate. Sediment sampling intervals were dependent on hydrograph curve dynamics, with 1-2 minute intervals between samples on the rising and falling portions of the hydrograph. Sediment con- centrations were determined by adding a
flocculating agent to each sample, and then decanting as much water as possible from the pre-weighed sample bottle, oven dried at 105° and reweighed to the nearest 0.01 g. Observed soil loss (kg/m2) from the dry, wet, and very-wet rainfall simula- tion treatments were used in this study.
The total sum of these 3 rainfall simula- tion treatments is denoted as the pooled data set.
LISLE and RUSLE Components Predicted soil loss was calculated via SAS (SAS 1999), by individual plot, from the 6 component factors in LISLE and RUSLE. Both models were programmed in SAS to facilitate calculation of soil loss and to perform the analysis in 1 package.
The SAS program outputs for the RUSLE component factors were verified using the RUSLE. The energy-times-intensity factor (El) (Renard et al. 1997) was calculated using the Brown and Foster (1987) unit energy equation for the dry, wet, very-wet rainfall simulation treatments and pooled data. Since the simulator rainfall energy is 77% of natural rainfall, the El value was adjusted for all simulation runs. The LS for the USLE was determined from Wischmeier and Smith (1978); whereas, the RUSLE was used to calculate LS using percent slope and length of the plot for 1
overland flow element. A support practice value (P) of 1.0 was used throughout this study. Two K factors were alternately
236 JOURNAL OF RANGE MANAGEMENT 56(3) May 2003
Table 1. Summary of descriptive information for the National Range Study Team sites.
Site, Rangeland formation, Soil series, Avg. surface Land species % comp. (By wt.
State Cover type, Range site texture for the site, Avg.
slope, Soil taxonomic classification
Area (MLRA)
order)
(cm)
B 1- Tallgrass prairie, Burchard, loam, 10% Nebraska bluegrass (Poa pratensis L.)
Nebr. Bluestem prairie, Loamy Fine-loamy, mixed, mesic Kansas (Taraxacum ofcinale G.H.
Typic Argiudolls Loess-Drift Hills Weber ex Wiggers)
3-Alsike clover (Tr(folium hybridum L.)
B2- Tallgrass prairie, Burchard, loam, l1% Nebraska (Primula spp.)
Nebr. Bluestem prairie, Loamy Fine-loamy, mixed, mesic Kansas [Hesperostipa spartea (Trin.)
Typic Argiudolls Loess-Drift Hills Barkworth]
3-Big bluestem (Andropogon gerardii Vitman) Cl-Tex. Shortgrass prairie,
Blue grama-buffalograss, Deep Hardland (25-34)
loam, 3%
Fine, mixed, thermic, Aridic Paleustolls
Southern High Plains
grama [Bouteloua gracilis (Willd. ex Kunth) Lag. Ex Griffiths]
2-Buffalograss [Buchloe dactyloides (Nutt.) Engelm]
3-Prickly pear cactus (Opuntia polyacantha Haw.)
C2- Shortgrass prairie, Olton, loam, 2% Southern High grama
Tex. Blue grama-buffalograss, Deep Hardland (25-34)
mixed, thermic,
Aridic Paleustolls 3-Prickly pear cactus
El-. Tallgrass prairie, Martin, silty clay loam, 5% Bluestem Hills broomweed [Amphiachyris
Kans. Bluestem prairie, Loamy Fine, smectic, mesic, Typic (DC.) Nutt.]
Upland Hapuderts 2-Missouri goldenrod (Solidago missouriensis
Nutt.)
3-Tall dropseed [Sporobolus compositus (Poir.) Merr.]
E2- Tallgrass prairie, Martin, silty clay loam, 5% Bluestem Hills bluestem [Schizachyrium scoparium
Kans. Bluestem prairie, Fine, smectic, mesic, Typic Nash]
Loamy Upland Hapuderts 2-Big bluestem
3-Indiangrass [Sorghastrum nutans (L.) Nash]
E3- Tallgrass prairie, Martin, silty clay loam, 3% Bluestem Hills Kans. Bluestem prairie,
Loamy Upland
smectic, mesic, Typic Hapuderts
grama [Bouteloua curtipendula (Michx.) Ton.]
3-Little bluestem
F1 Northern mixed prairie, Stoneham, loam, 7% Central grama-buffalograss,
Colo. Blue grama-buffalograss Loamy Plains
mixed, mesic, Aridic Haplustalfs
Plains wheatgrass [Pascopyrum smithii
(Rydb.) A. Love]
3-Buffalograss
F2- Northern mixed prairie, Stoneham, fine Central High grama
Colo. Blue grama-buffalograss, Loamy Plains
loam, 8% fine- loamy, mixed, mesic, Aridic Haplustalfs
sedge [Carex mops Bailey ssp.
heliophila (Mackenzie) Crins]
3-Bottlebrush squirreltail [Elymus elymoides (Raf.) Swezey]
F3- Northern mixed prairie, Stoneham, loam, 7% Central Colo. Blue grama-buffalograss,
Loamy Plains
mixed, mesic, Aridic Haplustalfs
Plains grama
3-Prickly pear cactus G 1- Northern mixed prairie, Kishona, of sandy loam, 7% Pierre Shale pear cactus Wyo. Wheatgrass-grama-
needlegrass, Loamy
mixed (calcareous), mesic Ustic Torriorthents
and Badlands [Hesperostipa comata
(Trip. & Rupr.) Barkworth]
3-Threadleaf sedge (Carex filifolia Nutt.)
G2- Northern mixed prairie, Kishona, clay loam, 8% Pierre Shale (Bromus tectorum L.)
Wyo. Wheatgrass-grama- needlegrass, Loamy
mixed (calcareous), mesic Ustic Torriorthents
and Badlands
3-Blue grama
Table 1 continued on page xxx.
JOURNAL OF RANGE MANAGEMENT 56(3) May 2003 237
Table 1. Continued.
Site, Rangeland formation, Soil series, Avg. surface Land species % comp. (By wt.
State Cover type, Range site texture for the site, Avg.
slope, Soil taxonomic classification
Area (MLRA)
order)
(cm) G3- Northern mixed prairie, Kishona, of sandy loam, 7% Pierre Shale
Wyo. Wheatgrass-grama- needlegrass, Loamy
mixed (calcareous), mesic Ustic Torriorthents
and Badlands sedge
3-Blue grama
Hi- Northern mixed prairie, Parshall, sandy loam, 12% Rolling Soft N.Dak. Prairie sandreed-
needlegrass, Sandy
mixed, Pachic Haploborolls
Plain sandreed [Calamovilfa longifolia
(Hook.) Scribn.]
3-Sedge (Carex spp.)
H2- Northern mixed prairie, Parshall, fine sandy loam, Rolling Soft (Lycopodium dendroideum N.Dak. Prairie sandreed-
needlegrass, Sandy
Coarse-loamy, mixed, Pachic Haploborolls
Plain
2-Sedge
3-Crocus (Anemone patens L.) H3- Northern mixed prairie, Parshall, sandy loam, 10% Rolling Soft
N.Dak. Prairie sandreed- needlegrass, Sandy
mixed, Pachic Haploborolls
Plain grama
3-Clubmoss
Ii- Sagebrush steppe, Forkwood, loam, 10% Northern big sagebrush (Artemisia
Wyo. Sagebrush-grass, Loamy Fine-loamy, mixed mesic Aridic Argiustolls
High Plains, Southern Part
Nutt. ssp.wyomingensis Beetle &
Young)
2- Prairie junegrass [Koeleria macrantha (Ledeb.) J.A. Schultes]
3- Western wheatgrass
12- Sagebrush steppe, Forkwood, loamy, 7% Northern wheatgrass
Wyo. Sagebrush-grass, Loamy Fine-loamy, mixed mesic Aridic Argiustolls
High Plains, Southern Part
wheatgrass [Pseudoroegneria spicata (Pursh) A. Love]
3-Prairie junegrass Jl-Id. Sagebrush steppe,
Mountain big sagebrush, Loamy (16-22)
silt loam, 8%
Fine-silty, mixed, Cryic Pachic Paleborolls
Eastern Idaho Plateaus
big sagebrush [Artemisia tridentata Nutt. var.vaseyana (Rydb.) Boivin]
2-Letterman needlegrass [Achnatherum lettermanii (Vasey) Barkworth]
3- Sandberg bluegrass (Poa secunda J. Presl) J2-Id. Sagebrush steppe,
Mountain big sagebrush, Loamy (16-22)
silt loam, 8%
Fine-silty, mixed, Cryic Pachic Paleborolls
Eastern Idaho Plateaus
needlegrass 2-Sandberg bluegrass 3-Prairie junegrass
K1- Shrub steppe-shortgrass Lonti, sandy loam, 5% Colorado and grama
Ariz. Blue grama-galleta, Loamy Upland
mixed, mesic Ustic Haplargids
River Plateaus (Haploppaus spp.)
3-Ring muhly [Muhlenbergia torreyi (Kunth) A.S. Hitchc. ex Bush]
K2- Shrub steppe, shortgrass Lonti, sandy loam, 4% Colorado and rabbitbrush [Ericameria nauseosa Ariz. Blue grama-galleta,
Loamy Upland
mixed, mesic Ustic Haplargids
River Plateaus ex Pursh) Nesom & Baird]
2- Blue grama
3-Threeawn (Aristida spp.)
used: the NRCS assigned K value for the soil type (KNRCS), and nomograph K (KNOMO) calculated from the soil-erodi- bility nomograph equation (Wischmeier and Smith 1978). Data for the nomograph (percent silt, very fine sand, clay, organic matter, soil structure, and profile perme- ability class) were determined from soil profile descriptions and samples collected at each plot. Complete soil characteriza- tion (physical and chemical) was per-
formed by the NRCS National Soil Survey Laboratory in Lincoln, Nebr. Laboratory procedures are given in detail in the Soil Survey Laboratory Methods Manual (USDA-SCS 1992).
The study plot USLE cover manage- ment factors (C) were obtained from Table 10 of USDA-Agriculture Handbook No.
537 (Wischmeier and Smith 1978). The RUSLE C factor was calculated using 2 strategies (Ctable and Cfield) The RUSLE
Ctable value was obtained by "best fitting"
the study plot vegetation type with values given in Tables 5-4 (ratio of effective root mass to annual site production potential, ni) and 5-6 (soil surface roughness, Ru)(Renard et al. 1997). For example, site B 1, plot 1 (tall grass prairie ecotype) is dominated by Kentucky bluegrass (Poa pratensis L.), dandelion (Taraxacum offic- inale G.H. Weber ex Wiggers), and alsike clover (Trifolium hybridum L.)(Table 1).
238 JOURNAL OF RANGE MANAGEMENT 56(3) May 2003