AccountAnts for business
Disclosures on water
About AccountAnts for business
AccA’s global programme, Accountants for business, champions the role of finance professionals in all sectors as true value creators in organisations. through people, process and professionalism, accountants are central to great performance. they shape business strategy through a deep understanding of financial drivers and seek opportunities for long-term success. by focusing on the critical role professional accountants play in economies at all stages of development around the world, and in diverse organisations, AccA seeks to highlight and enhance the role the accountancy profession plays in supporting a healthy global economy.
www.accaglobal.com/accountants_business
© the Association of chartered certified Accountants,
this report is part of a series of research
†projects carried out by
ACCA Australia and
New Zealand
in collaboration with the net
balance foundation and the sustainable
investment research institute (siris). the
series analyses disclosures on areas of
non-financial performance by Australian
securities exchange (AsX) top 50
companies (AsX 50).
this report examines the reporting quality
of 32 companies from the AsX 50.
inclusion was based on companies’
requirements for significant quantities of
water for their operations, supply chain
and product-use areas.
this research report:
provides the business case for improved
water disclosures by companies
analyses Australian companies’ current
water disclosures
highlights the strengths and
weaknesses of Australian companies’
water disclosures
recommends how companies can
improve their disclosures on water
management, processes and
performance.
Glossary 4
executive summary 5
1. why water matters 6
2. the importance of water disclosure 8
3. reporting frameworks and guidelines 11
4. Methodology 13
5. results 15
6. conclusions and recommendations 26
references 28
about the authors 30
Glossary
AA1000 AccountAbility assurance standard
cDP carbon Disclosure Project
esG environmental, social, and governance
GHG greenhouse gas
Gri Global reporting initiative
iPcc intergovernmental Panel on climate change
nWi national Water initiative
siris sustainable investment research institute
unGc united nations Global compact
WbcsD World business council for sustainable Development
WWf World Wildlife fund
AcknowleDGements
this report has been produced by the following team. rebecca Allonby, net balance foundation
•
chris bourke, net balance foundation •
terence Jeyaretnam, net balance foundation •
Melinda Leth, net balance foundation •
stefanie Phelan, siris •
ben spruzen, siris •
ross Wyatt, net balance foundation •
bAckGrounD
During March and April 2010 research was undertaken to assess the completeness of selected Australian companies’ disclosures on water management and performance across their operations and supply chains. A sample of 32 companies from the AsX 50 were assessed. these were selected on the basis of their risk exposure to water, and included companies from the energy, materials, utilities, food, beverage and tobacco, capital goods, food and staples retailing, transportation and real estate sectors.
Drought, although intrinsic to Australia, is being exacerbated by weather extremes possibly caused by climate change. this is bringing consequent material risks to communities and businesses. investors are increasingly demanding more robust corporate disclosure of the material risks to and opportunities for companies. these include the environmental, social and governance (esG) issues that can affect a company’s financial performance. Water-related risks are no exception, and have been given a high priority by investors such as norges bank
investment Management, given the nature of companies whose operations show high dependency on water in their supply chains.
Measuring and reporting corporate water-related risks and opportunities is complex. this complexity arises from issues such as the lack of a universally accepted
methodology for calculating the risk impact of water, lack of mandate for corporate water reporting, the piecemeal ability to access reliable data from suppliers on water performance, as well as the dynamic variability of local and regional issues in water catchments. Water pricing has also been comparatively lower in Australia and, until recently, there have not been the pricing signals to encourage risk-management behaviours, as a driver for managing input costs. While these difficulties need to be recognised, there are strong business benefits from identifying the risks and opportunities of water scarcity for a company. While there is no one way to measure and report this, there are a number of standards, frameworks and guidelines emerging that companies can use to help measure and report their water use and impact, such as ‘water footprinting’ and the carbon Disclosure Project Water Disclosure initiative.
results
this report presents the results of Australian companies’ current water disclosures. the research found that there is significant variation in the performances of the companies included in this study. the overall scores ranged from 56% (rio tinto Ltd) to less than 10%. the average score for all 32 companies was just 28%, illustrating that for the majority of companies included in the research, there is significant progress still to be made on disclosing water-related data in a more uniform comparable manner.
this research highlights that, while water-related issues are frequently broadly addressed in sustainability reporting, there is still room for many companies to improve their disclosure on water risk issues. compared with mandated reporting and disclosures around greenhouse gas
emissions and energy consumption, through the National Greenhouse Energy Reporting and Energy Efficiency Opportunities legislation, comprehensive water disclosure in Australia still has some way to go.
in response to restricted water allocations, arising from drought conditions across Australia, and strong
community awareness, many companies have developed positive initiatives to incorporate efficiency measures, water recycling and the use of alternative water sources into their operations. in practice, reporting on such programmes is not always comprehensive and frequently lacks quantitative data analysis, which prevented several companies from achieving high scores in this research.
the social, economic and environmental prosperity of the nation depends on its ability to provide safe, clean drinking water, avoid water shortages, protect the environment, improve land management, address climate risks and sustain profitable production (csiro 2010). Within Australia, one of the world’s driest continents (oecD 2005), water shortages and drought are common, with seven major droughts since before federation in 19011
(bureau of Meteorology 2010). While droughts are part of the Australian landscape, a changing climate, over-allocation, poor governance and water-intensive activities have exacerbated the problem.
the impact of drought on communities and companies has not only been felt in terms of the physical effects such as water restrictions, declining water quality, dust storms and bushfires: there is also a significant economic impact. in one of Australia’s worst droughts between 1992 and 1995, average production by rural industries fell about 10%. this resulted in an estimated $5 billion cost to the Australian economy, including $590 million drought relief provided by the commonwealth Government (bureau of Meteorology 2010).
to address water shortage issues in Australia, both state and commonwealth governments along with water authorities have implemented a range of supply and demand-side initiatives as part of their water planning frameworks and policies.
wAter cAps AnD mArkets
south Australia was the first state to introduce water markets in 1983, when water entitlements were separated from land. in 1994, the council of Australian Governments (coAG) water reforms required the separation of water rights from land; a necessary first step to expand trade in water. since then, water trading has expanded and is a key mechanism, reflecting the true cost of water and driving more efficient use of water in farms. it has also resulted in the transfer of water to more economically efficient end uses such as growing grapes and stone fruit. the national Water commission estimated the total value of water traded in 2007/8 to be around $1.68 billion (nWc 2010a).
1. official drought years in Australia: the federation drought 1895–1902; the 1914–15 drought; the WWii droughts 1937–45; the 1965–68 drought; the short and sharp drought 1982–83; the long el niño droughts 1991–96 and 2002–06.
wAter entitlements
the commonwealth Government plans to spend AuD $1.5 billion purchasing water entitlements for the environment over three years from 2008/9 to 2010/11 (Hone et al. 2010). to date, the water has been purchased through competitive tenders with the aim of providing increased environmental flows to rivers and to help farmers adjust to new water regimes with reduced water availability.
infrAstructure projects
state governments and water authorities have increased spending on large-scale water infrastructure projects such as water pipelines and desalination plants to meet
increasing urban water demand. Melbourne Water recently completed the sugarloaf Pipeline Project, a 70km pipeline linking the Goulburn river near Yea to the sugarloaf reservoir in Melbourne’s north-east, at a cost of $750 million (Melbourne Water 2010). sydney Water has recently completed the desalination plant at Kurnell at a cost of $1.89 billion, and Melbourne has also built plants (nsW Government 2010).
cleAn technoloGies
there has been increased investment in clean technologies such as water filtration technology, storage and treatment to improve the quality of waste water. the sydney olympic Park Authority’s Water reclamation and Management scheme at Homebush bay was Australia’s first large scale urban recycling scheme to source wastewater through sewer mining for irrigation and residential non-drinking uses (sydney Water 2010).
DemAnD mAnAGement initiAtives
state Governments and Water Authorities have
implemented a range of demand management initiatives to help residential, business, agriculture and industrial users of water become more efficient. Demand
management initiatives have mainly focused on subsidies for water efficient appliances and technologies such as washing machines, smart metering, sub-surface drip irrigation and more efficient industrial processes to help reduce water demand. sydney Water saves over 80,000 megalitres per year (year ending June 2009) though demand management initiatives such as leakage reduction and helping businesses and households save water (sydney Water 2009).
wAter restrictions
Many regional and metropolitan centres in Australia experienced record low rainfall and dam levels during the 2002/6 drought. for example, Melbourne dams reached a record low of 25.6% capacity in June 2009 (Melbourne Water 2010). Government interventions such as water restrictions in varying degrees of severity were enforced to help manage demand for water and ensure sufficient water was available for future dry seasons.
While agriculture is Australia’s largest water user,
representing almost 65% of Australia’s total freshwater use (Abs 2006) companies are reliant on water to operate and consequently have a substantial role to play in managing water. the carbon Disclosure Project (cDP) (2010),
identified industry sectors such as agriculture, forestry and paper products, food and beverage consumer goods, mining, manufacturing, pharmaceuticals and power generation as the most likely industries to be affected by water scarcity and quality. these industries are more likely to feature water-intensive industrial processes and are therefore reliant on water to support their business activities.
it is not just the water directly used by companies in their own operations that is significant. for many companies, their own water use and impact are secondary to the water used by their suppliers along their supply chain. the multinational nature of many businesses means that water scarcity and its availability in sourcing or finishing a product are not just a local concern. What may also not be sufficiently accounted for are the indirect economic and social exposures and supply-chain risks in sourcing from other water-challenged regions such as china, and the impact that can have on a local community even when a company’s immediate locations or internal operations are not seriously affected. While there are measures a
company may take to manage commodity-input risks, be it through financial hedging or finding another supplier, there is ultimately a consequential cost passed through, with higher product pricing to end consumers.
wAter consumption in AustrAliA
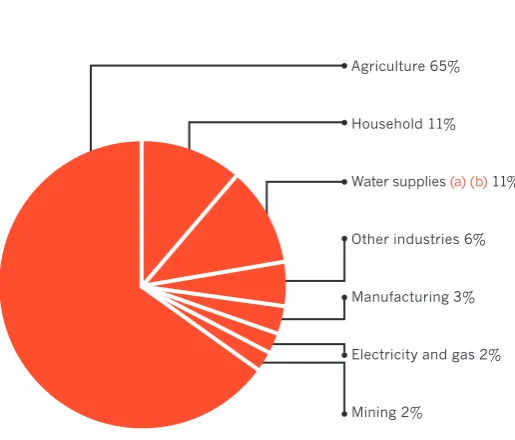
Water consumption in Australia for 2004/5 was 18,767GL compared with 21,702GL in 2000/1. the agriculture industry had the highest water consumption in 2004/5, accounting for 12,191GL (or 65%). Households were the next highest consumer of water, accounting for 2,108GL (or 11%) of water consumption. the water supply, sewerage and drainage services industry was also a significant consumer of water, accounting for 2,083GL (or 11%) of water consumption (mostly due to losses in distribution), followed by manufacturing with 589GL (or 3%). see figure 1 (Asb 2006).
Agriculture 65%
Household 11%
Water supplies (a) (b) 11%
other industries 6%
Manufacturing 3%
electricity and gas 2%
Mining 2%
[image:7.595.316.574.417.637.2]forestry and fishing (c) 0%
Figure 1: water consumption in australia for 2004/5
(a) includes sewerage and drainage services.
(b) includes water losses.
companies have an important role to play in managing water resources. While effective water management is a socially responsible act, there are also strong business benefits from identifying the water-related risks and opportunities to a business. this section looks at the drivers for improved water disclosure; the challenges companies may face in measuring and reporting water performance; and the standards, frameworks and guidelines available to businesses to help them improve their disclosures.
investor DemAnD
to make informed investment decisions, investors require robust corporate disclosure of the material risks and opportunities to companies, including environmental, social and governance (esG) issues that can affect their financial performance. ‘Anything that affects a firm’s business model can affect the financial performance and valuation, and esG issues are no exception.’ Julie Hudson, cfA global head of sri and sustainability research, ubs investment bank (ceres 2010).
investor interest in esG Disclosures is A GlobAl AGenDA
in January 2010, the us securities and exchange commission (sec) provided interpretative guidance on disclosures related to business or legal developments regarding climate change (sec 2010). the guidance was issued after six years of lobbying by institutional investors. the guidance clarifies what publicly listed companies need to disclose about material climate-related risks, including physical risks, such as water (sec 2010). ‘companies should also evaluate for disclosure purposes the actual and potential material impacts of environmental matters on their business.’
norges bank investment Management (nbiM) announced in August 2009 that responsible water management was a new priority area for its investment evaluations. nbiM, which manages investments worth over usD$43 billion, identified water scarcity as a business risk to its managed
investments. to understand the full exposure of a company, stakeholders require meaningful disclosure. in response, nbiM published its expectations with regard to companies’ management of water as a resource and the related risk in a report in 2009 (nbiM 2009). the expectations relate to companies with activities or supply chains in high-risk sectors and regions.
the weight of the investment community was thrown behind the united nations Global compact ceo Water Mandate when, in December 2009,16 members of the united nations Principles for responsible investment asked 100 of the world’s largest companies to sign up to the ceo Water Mandate (unGc 2010). the members, representing us$1.5 trillion in managed investments, included leading european and north American institutional investors and asset managers such as connecticut retirement Plans and trust funds, calvert, robeco, and f&c Management Ltd.
the King iii report on corporate Governance for south Africa (ioD 2009) recommends that companies integrate their esG performance with their financial performance to enable stakeholders to make more informed decisions about the economic value of a company. the guidance is expected to be mandatory for all companies listed on the Johannesburg securities exchange.
business Drivers
Dr Dave tickner, head of freshwater programmes at WWf uK, identified four key business risk areas arising from water scarcity and management issues (AccA 2009).
Physical risks arise through flooding, pollution, and scarcity of water in the regions where an organisation operates. this scarcity can be caused by an actual deficit of water or through a failure of supply from water
managers. this is especially true for water-intensive sectors, which may have to transfer operations to a more water-rich area, or one where the regulatory environment is more coherent.
financial risks arise from competition, increases in water tariffs and other pricing mechanisms, and cost inflation of water and energy as a result of increasing water stress across regions globally. Higher costs, plant closure and reputational damage are other risks arising as a result of water scarcity.
regulatory risks arise as water scarcity and corruption and security issues increase, governments may decide to control business water use and decrease the number of water extraction licences issued, or change the rules that govern water use, licensing and allocation, or the costs and conditions of water put back into the system.
reputational risks arise when those businesses that fail to understand the impacts that their operations, supply chains and discharges have on water resources, aquatic ecosystems and local communities leave themselves open to reputational risks and potential loss of customers and investors.
Given these risks and their potential impact on a company’s financial success, the carbon Disclosure Project identified four key ways in which companies may benefit from improved water disclosure (cDP 2010).
1. improving the operational efficiency of sites involved in running the business and manufacturing products for consumers.
2. identifying and assessing water–related risks and opportunities to the company that may affect its financial performance, and encourage action.
3. Managing water-related social and environmental impacts and water stewardship response to help maintain a licence to operate and grow.
4. communicating water-related risk and performance with stakeholders, such as investors and community groups, to improve their understanding and ability to make informed decisions.
stAkeholDer ApprovAl
Global companies are increasingly being held accountable when esG considerations are not managed and disclosed. in 2004, coca-cola Amatil Ltd was unable to renew the operating licence for its bottling plant in Plachimada, southern india, owing to concerns that the company’s over extraction of ground water was exacerbating local water scarcity (Hills and Welford 2005). Gaining community acceptance is essential and requires meaningful stakeholder engagement to identify the material issues and develop strategies to manage the risks and
opportunities. As companies improve their disclosure on water, stakeholders and community groups will be better informed of the issues and the right actions, and be able to benchmark a company’s performance against its industry peers.
the chAllenGes in wAter Disclosure
While there are substantial benefits for investors, businesses and communities in improved water disclosures, there are also numerous challenges for businesses in measuring, gathering and reporting. the cDP Water initiative identified the following challenges (cDP 2010).
Ability to measure
unlike greenhouse gas emissions, which can be expressed as co2e, there is no universally accepted method for calculating the impact of water use by businesses. the impact of using one megalitre of water for industrial processes will vary for different geographic and climatic regions.
local/regional issues
With water, many factors need to be considered, including the water source; availability of water within the
catchment; urban or rural infrastructure support and pricing; the volume and quality of water returned; and its impact on the surrounding environment, such as
groundwater; and alternative beneficial uses. the
case study: water footprinting
the Water footprint network is a Dutch not-for-profit foundation, which works with its partners (including nGos, academics, global companies and government agencies) to develop standards on water footprint accounting for companies. Water footprinting includes the total volume of fresh water that is used directly and indirectly to run and support the business (Water footprint network 2010). it consists of two
components:
1. operational water footprint – the direct water use by the business in its own operations, and
2. supply-chain water footprint – the water use in the business’s supply chain.
Water use is measured in terms of: the volume of surface water and ground water used (blue water); the volume of evaporative flows taken from rainwater stored in the soil moisture (green water); and the theoretical volume of water needed to dilute water discharged to surrounding waters to the extent they do not exceed regulatory standards (grey water).
While the methodology is still under development, it is a significant first step in helping companies to
measure their water use and has three key benefits.
1. it helps companies to calculate the water used in their supply chain, in both the production and use of goods and services.
2. it helps the company to benchmark its water use against its industry peers.
3. it helps the company to identify risks and opportunities to manage water better.
water in the supply chain
the direct use and management of a company’s water is only part of the equation. companies also need to consider the water use along their supply chain, where there can be substantially larger, compounding impacts than from their own facilities. supply chain considerations include both upstream issues with suppliers and downstream issues in terms of the water used when consumers use their products and services. Accessing meaningful data from suppliers can also be difficult.
Globally accepted standard
currently, there is no universally accepted standard for measuring water use and its impact. this is due, in part, to complexities in collecting and disseminating meaningful water-related data and measuring the impact on surrounding environments. three of the most widely recognised methods for measuring water use include:
the Water footprint network,
• 2 life cycle assessment
the World business council Global tool,
• 3 and
the Global environmental Management initiative Water •
sustainability Planner tool.4
A joint report by the uneP, uncG and Pacific institute released in 2010 provides a comprehensive summary of the strengths and weaknesses of each of these methods along with case studies of global companies’ experiences with these methods (uneP 2010). While the methodologies are not perfect, they are a substantial step in the right direction.
2. http://www.waterfootprint.org/
3. http://www.wbcsd.org/templates/templateWbcsD5/layout.asp?type=p &Menuid=MtuxnQ&doopen=1&clickMenu=LeftMenu=LeftMenu
Although there is no globally accepted standard for measuring and reporting on corporate water consumption and its effects, there are a number of frameworks and guidelines available to help guide companies in disclosing their water management activities and performance.
GlobAl reportinG initiAtive, G3 sustAinAbility reportinG GuiDelines
the Global reporting initiative5 (Gri) is a network-based
organisation with participants representing businesses, civil society, labour and professional institutions.
in 2006, the Gri developed the G3 sustainability reporting guidelines. the guidelines set out the principles and indicators that companies use to measure and report their economic, environment and social performance, and enables companies to:
benchmark their performance with respect to laws, norms, •
codes, performance standards and voluntary initiatives
demonstrate commitment to sustainability •
compare performance over time. •
the guidelines are open-source and reporting companies declare an application level (c, b or A) to indicate the extent to which the core indicators have been reported. the guidelines include five water-related indicators that focus on a company’s direct water use.
water
en8: total water withdrawal by source. •
en9: Water sources significantly affected by withdrawal •
of water.
en10: Percentage and total volume of water recycled •
and reused.
emissions, effluents and waste
en21: total water discharge by quality and destination. •
en25: identity, size, protected status, and biodiversity •
value of water bodies and related habitats significantly affected by the reporting company’s discharge of water and runoff.
5. www.globalreporting.org
cArbon Disclosure project, wAter Disclosure initiAtive
the carbon Disclosure Project6 is an independent
not-for-profit organisation holding the largest database of primary corporate climate change information in the world. it acts on behalf of 534 institutional investors, holding a
combined usD$64 trillion in assets under management.
in 2010, the cDP released its water disclosure
questionnaire, which was sent to over 300 of the world’s largest companies, operating in water-intensive sectors including: consumer goods; forestry and paper products; beverages; mining; pharmaceuticals; and power
generation. Australian companies asked to participate included bHP billiton Ltd, rio tinto Ltd, and Woodside Petroleum Ltd. Participants were requested to provide the following information:
risks and opportunities that companies face in relation •
to water
water use and exposure to water stress in companies’ •
own operations and in their supply chains
companies’ water management plans and governance. •
the questionnaire was intended to provide insights into how companies manage water and to inform the global market place on water-related investment risk and commercial opportunities driving sustainable water use.
6. www.cdproject.net
AccA AustrAliA AnD new ZeAlAnD sustAinAbility reportinG AwArDs
since 2002 ACCA Australia and New Zealand has rewarded companies for excellence in environmental, social, and wider economic reporting. Water criteria play a prominent role as part of a wider company assessment highlighting respective approaches to and transparency around the integration of sustainability criteria in core business strategies.
the aims of the ACCA Australia and New Zealand Awards for sustainability reporting9 are:
to reward and recognise those organisations that report •
and disclose environmental, social or full sustainability information within Australia
to encourage the uptake of environmental, social or •
sustainability reporting
to raise awareness of corporate transparency issues •
and increase accountability for responsiveness to stakeholders.
AccA awards around the world reward companies for excellence in environmental, social and sustainability reporting. the awards identify and reward innovative attempts to communicate corporate performance, although AccA does not comment on performance itself. the aim is to reward transparency.
At the core of the judging criteria are completeness, credibility and communication. Award winners
demonstrate that, by emphasising these key elements, companies can target significant improvements in the quality of information disclosed during the reporting process. ultimately, AccA awards help underline the business case for sustainable practices and development.
9. http://australia.accaglobal.com/australia/general/sustainability/
the uniteD nAtions GlobAl compAct
the united nations Global compact7 (un Global compact)
is a strategic policy initiative for businesses committed to aligning their operations and strategies with ten universally accepted principles in the areas of human rights, labour, environment and anti-corruption. in 2007, the un Global compact launched the ceo Water Mandate,8 a public–
private initiative created in partnership with the
Government of sweden and a group committed companies and specialist organisations dealing with the problems of water scarcity.
the Mandate is designed to assist companies in the development, implementation and disclosure of water sustainability policies and practices and to make water management a priority. the Mandate highlights the need for companies to work with governments, un agencies, nGos and other stakeholders to address the global water challenge. it covers six key areas:
direct operations •
supply chain and watershed management •
collective action •
public policy •
community engagement •
transparency. •
As of 2010, participation in the Mandate is restricted to those companies that are signatories to the un Global compact.
7. www.unglobalcompact.org
table 1: companies from the asX 50 used in the analysis
Company sector
1. Crown Ltd consumer discretionary
2. News Corporation Incorporated consumer discretionary
3. Coca-Cola Amatil Ltd consumer staples
4. Foster’s Group Ltd consumer staples
5. Wesfarmers Ltd consumer staples
6. Woolworths Ltd consumer staples
7. Oil Search Ltd energy
8. Origin Energy energy
9. Santos Ltd energy
10. Woodside Petroleum Ltd energy
11. Worleyparsons Ltd energy
12. Lend Lease Corporation Ltd financials
13. Macquarie Group Ltd financials
14. Stockland financials
15. Westfield Group financials
16. CSL Ltd Health care
17. Brambles Ltd industrials
18. Leighton Holdings Ltd industrials
19. Qantas Airways Ltd industrials
20. Toll Holdings Ltd industrials
21. Transurban Group industrials
22. Amcor Ltd Materials
23. BHP Billiton Ltd Materials
24. BlueScope Steel Materials
25. Fortescue Metals Group Ltd Materials
26. Incitec Pivot Ltd Materials
27. Lihir Gold Ltd Materials
28. Newcrest Mining Ltd Materials
29. One Steel Ltd Materials
30. Orica Ltd Materials
31. Rio Tinto Ltd Materials
32. AGL Energy Ltd utilities
this report summarises the findings of research, carried out by independent analysts, on 32 of the largest Australian companies (by market capitalisation) as recognised by the AsX and included within the AsX 50 as of 8 March 2010 (see table 1). the research of publicly available information for each company was conducted between 8 March and 30 April 2010.
the companies selected for inclusion in the analysis were drawn from the AsX50, with a bias towards high-impact sectors with specific exposure to water-related risk or opportunity (table 1). on the basis of these criteria, the sectors analysed included Materials and Mining, energy, utilities, industrials, consumer Discretionary and consumer staples. to enable a balanced assessment representative of the AsX50, individual companies were also selected from the Diversified financials and real estate sectors. the real estate companies sought for inclusion were those with substantial high impact
development and construction operations as measured by the percentage of total revenue generated by rental income.
evAluAtion criteriA inDicAtors
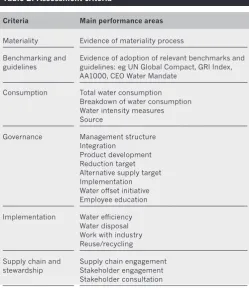
[image:14.595.293.543.242.531.2]the research findings were assessed on the basis of a series of criteria developed by the net balance foundation, siris and AccA. the criteria are broken down into six main areas of performance. table 2 provides a summary of the criteria groups – more detail on each is included in the next section of this report.
table 2: assessment criteria
criteria Main performance areas
Materiality evidence of materiality process
benchmarking and guidelines
evidence of adoption of relevant benchmarks and guidelines: eg un Global compact, Gri index, AA1000, ceo Water Mandate
consumption total water consumption breakdown of water consumption Water intensity measures source
Governance Management structure integration
Product development reduction target Alternative supply target implementation Water offset initiative employee education
implementation Water efficiency Water disposal Work with industry reuse/recycling
supply chain and stewardship
overAll
[image:15.595.316.566.250.441.2]there is a large variation in the performance of companies included in this study. the overall scores ranged from 56% (rio tinto Ltd) to less than 10% (five companies, see figure 2). the average score for all 32 companies was just 28%, illustrating that, for the majority of companies included in the research, there is significant progress to be made on disclosing water-related data in a standard manner (see figure 1). the same was true of the individual criteria groups – scores ranged from 100% down to 0% (see table 3 for the top-scoring companies in each criteria group). the overall average scores for all criteria groups ranged from 50% for ‘consumption’ and 17% for ‘supply chain and stewardship’.
table 3: top scoring companies in each criteria group
criteria group top-scoring company
top score (%)
average score of top 10 companies (%)
average score of all 32 companies (%)
Materiality bHP billiton Ltd 100 58 33
benchmarking and guidelines
Woolworths Ltd
Lihir Gold Ltd 75 41 22
consumption rio tinto Ltd
foster’s Group Ltd 100 83 50
Governance foster’s Group Ltd 56 43 25
implementation newcrest Mining
Ltd 71 43 26
supply chain and stewardship
coca-cola Amatil
Ltd 67 38 17
the top 1010 companies’ overall performance (ranged from
56% (rio tinto Ltd) to 34% (coca-cola Amatil Ltd and Wesfarmers Ltd) with only three companies scoring over 50%. this is significantly lower than the scores of the top 10 companies that featured in our previous research on environmental sustainability – ‘Disclosures on climate change’, where scores ranged from 82% to 43% (net balance and AccA 2007). this would indicate that companies find water disclosures more challenging than climate change disclosures, which could be explained by the fact that there are as yet no widely or formally accepted standards for water disclosure, and therefore companies report on water-related issues on a somewhat ad hoc basis.
10. eleven companies are included in the top 10, as two companies (coca-cola Amatil Ltd and Wesfarmers Ltd) had the same scores.
[image:15.595.51.301.451.771.2]5. results
Figure 2: overall average percentage of the 32 companies in each of the criteria groups
score %
consumption 49.6
Materiality 32.8
implementation 26.2
Governance 24.5
benchmarking and guidelines 22.0
supply chain and stewardship 16.7
Figure 1: number of companies in each score range
score 50–55% (3) score
0–9% (5)
score 10–29% (11)
these top-scoring companies are from a variety of different sectors, including materials, consumer staples, real estate, energy and industrials. consumer staples was the highest-scoring sector overall in the analysis, with an average score of 44% (see figure 5) and all four
companies in this sector group (foster’s Group Ltd, Woolworths Ltd, coca-cola Amatil Ltd and Wesfarmers Ltd) being among the top 10 overall performing
companies. it should be noted, however, that the number of companies included in the study varies for each sector. for example, 10 materials companies were included, whereas only one company in each of the utilities and healthcare sectors was included.
Figure 4: average overall score for each sector
score %
consumer staples 44.0
Materials 34.6
utilities* 32.4
A-reit 27.8
industrials 23.0
Health care* 21.3
energy 18.9
financials 13.0
consumer discretionary 10.6
[image:16.595.27.280.256.429.2]* only one company in this area.
Figure 3: top-performing australian companies in the asX 50
score %
rio tinto Ltd 56.5
foster’s Group Ltd 54.6
Woolworths Ltd 52.8
bHP billiton Ltd 47.2
stockland 45.4
newcrest Mining Ltd 44.4
Lihir Gold Ltd 43.5
santos Ltd 41.7
transurban Group 40.7
coca-cola Amatil Ltd 34.3
mAteriAlity
this criteria group examines whether or not companies identify water to be a material sustainability risk to their business operations. scores were awarded on the basis of whether or not a company publicly identified water to be a risk, if it discussed the issue and provided evidence of the risk being managed, and if quantitative disclosure was provided with regard to the company’s exposure to the risk (such as a statement of financial risk or the percentage of operations that were at risk).
Performance by the 32 companies against the materiality criteria group varied, with scores ranging from 100% to 0%. While one-third of the 32 companies scored 50% or higher, identifying and discussing water as a material issue in the context of their business operations, seven
companies scored 0%. the top 1011 companies are
presented in figure 6. the average score for all companies in the materiality criteria group was 33%.
it was found that, although most companies identified water as a material issue (25 out of 32 companies), only one-half of those (13 out of the 25) disclosed details of the areas in their businesses where water was seen to be an operational risk and where there were programmes for risk management. seven companies from various sectors, including financials, consumer discretionary, energy, industrials, and materials, did not report on
risk-management processes. this cross-sector lack of reporting suggests that the material consideration of water issues for companies is not necessarily sector-specific but, rather, company-specific.
[image:17.595.325.555.259.447.2]11. thirteen companies are included in the top 10, as 11 companies had the same scores.
Figure 6: top-performing companies in the ‘Materiality’ criteria group
score %
AGL energy Ltd 100
bHP billiton Ltd 100
Amcor Ltd 50
bluescope steel Ltd 50
brambles industries Ltd 50
coca-cola Amatil Ltd 50
crown Ltd 50
foster’s Group Ltd 50
Leighton Holdings Ltd 50
Lend Lease Group 50
rio tinto Ltd 50
santos Ltd 50
[image:17.595.315.567.516.720.2]Woolworths Ltd 50
Figure 5: number of companies in each score range, ‘Materiality’ criteria group
score 100% (2) score
0% (7)
score 25% (12)
benchmArkinG AnD GuiDelines
this section examines companies’ use of nationally or internationally accepted benchmarking guidelines in their reporting, specifically in reference to water issues. these include the adoption of the: unGc; Gri; AA1000
(AccountAbility series of sustainability standards); ceo Water Mandate; and for financial companies, the equator Principles and the united nations’ environment Program finance initiative (uneP fi). scores were dependent on companies’ referencing of such guidelines, and on their providing detailed information on how they were applied in reference to water issues.
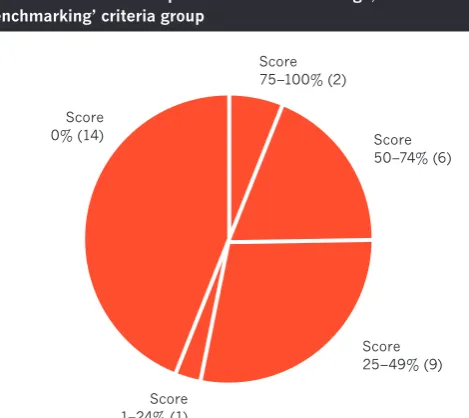
eighteen out of 32 companies referred to the use of guidelines in their sustainability reporting and achieved a score of 25% or higher (see figure 7). two companies with the top score, 75%, Woolworths Ltd and Lihir Gold Ltd, provided detailed descriptions on the use of the Gri index, unGc principles and AA1000 Assurance standard. some companies made very limited or no disclosure on water issues and, overall, 14 companies scored 0%. the average score of all 32 companies in this criteria group was 22%.
Best practice case study: recognition of water as a material risk
bhp billiton ltD – score 100%
bHP billiton Ltd (2009) provided comprehensive discussion of water in its 2009 sustainability
reporting, by identifying both risks and opportunities. the company acknowledges its dependence on access to water, and associated infrastructure, for a significant portion of its major operations, and the unavailability of water for any reason would have significant negative impacts on its bottom line. bHP further recognises that access to high-quality water is an issue of growing international importance and a key challenge for sustainable development. to address the risk of potential water shortages and to mitigate the associated impacts, bHP has set a five-year target to improve its ratio of clean water to recycled water use by 10%. in addition, it is
[image:18.595.308.543.546.755.2]investigating risks and opportunities for access, reuse or recycling, efficiency and responsible disposal. in 2009, the company reported that 42% of its consumed water was from recycled sources, which was an 8% improvement over 2007.
Figure 7: number of companies in each score range, ‘Benchmarking’ criteria group
score 75–100% (2)
score 0% (14)
score 1–24% (1)
score 25–49% (9)
the most commonly used reporting guideline was the Gri, which was adopted by 17 of the 32 companies. only seven companies had their sustainability reporting assured according to the AA1000 Assurance standard, and six companies mentioned the incorporation of the unGc principles, though not all were official signatories. none of the companies in this study group referred to the use of the voluntary principles of the ceo Water Mandate. it should be noted however, that as of 1 May 2010, only one AsX 50 company was a signatory to the ceo Water Mandate,12 and therefore this global initiative is yet to be
commonly recognised by Australian companies.
12. Westpac Banking Corporation is a signatory but was not included in this study.
Best practice case study: Formal adherence to multiple standards
woolworths ltD – score 75%
Woolworths Ltd (Woolworths) used a number of complementary international guidelines in its sustainability reporting for 2009. it applied the Gri framework to its reporting to an ‘A+’ application level, and was assured in accordance with the AA 1000 Assurance standard. Woolworths also became a signatory to the unGc in 2009, making a formal commitment to upholding the Principles throughout its operations.
[image:19.595.50.305.431.707.2]Woolworths has made the decision to apply more than one of these widely recognised standards formally and to use the frameworks in meaningful complement with each other.
Figure 8: top-performing companies in the ‘Benchmarking and guidelines’ criteria group
score %
Lihir Gold Ltd 75
Woolworths Ltd 75
transurban Group 62.5
AGL energy Ltd 50
bHP billiton Ltd 50
newcrest Mining Ltd 50
rio tinto Ltd 50
stockland 50
Qantas Airways Ltd 31
brambles industries Ltd 25
csL Ltd 25
foster’s Group Ltd 25
orica Ltd 25
origin energy Ltd 25
santos Ltd 25
Wesfarmers Ltd 25
consumption
the ‘consumption’ criteria group considered quantitative disclosure of water consumed. the criteria group was broken down to consider total consumption, a breakdown of disclosure into fresh, potable, recycled or reused water, intensity of consumption, and disclosure of water sources (mains water, reservoirs, aquifers, bores, etc). Higher scores were awarded for specific, quantitative disclosure.
the consumption category has the highest average scores of the six key criteria groups, and the overall average score of the 32 companies was 50%. the average of the top 10 companies was 83%, with scores ranging from 100% (rio tinto Ltd and foster’s Group Ltd) to 75% (scored by seven companies).
[image:20.595.27.280.400.606.2]Quantitative disclosure was most evident for ‘total water consumption’, which was disclosed by 20 of the 32 companies. While more than one-half of the companies mentioned some aspects of ‘breakdown of water use’ and ‘water source’, only 14 provided full quantitative reporting on the ‘breakdown of water use’. twelve companies reported data on the amount of water used from each of their various sources. the least disclosed indicator was ‘intensity of consumption’, for which only eight of the 32 companies provided quantitative disclosure. even among the top 10 companies in this category, only three (rio tinto Ltd, foster’s Group Ltd, and stockland) provided figures on the intensity of water use in their operations. Despite the high average score in the consumption criteria group, most AsX companies seem to be struggling to analyse and fully disclose quantitative performance figures, other than for total water consumption.
Figure 9: top-performing companies in the ‘consumption’ criteria group
%
foster’s Group Ltd 100
rio tinto Ltd 100
bHP billiton Ltd 87.5
bluescope steel Ltd 87.5
Lihir Gold Ltd 87.5
stockland 87.5
fortescue Metals Group 75
newcrest Mining Ltd 75
onesteel Ltd 75
santos Ltd 75
transurban Group nPV 75
Wesfarmers Ltd 75
GovernAnce
the governance criteria group examines how water risks and other issues are being addressed and managed within a company. this report considers the management structures that are in place to respond to water-related issues, and how water management is implemented and integrated across business operations. it also seeks evidence of whether targets have been set by companies to reduce water consumption, alternative supply sources sought, water efficiency products or services developed, and education provided to employees to change behaviours around the efficient use of water.
overall performance by all companies in this area was quite low; the average score being 25%. the top score achieved was 56% (foster’s Group Ltd), which was the lowest high-score for any of the main criteria groups examined in this report. the average of the top 10 companies was 43%, with foster’s Group Ltd leading the way (see figure 10).
Best practice case study: comprehensive quantitative disclosure
rio tinto ltD – score 100%
rio tinto Ltd (rio tinto) demonstrated best practice in its water data compilation and public reporting through its provision of comprehensive quantitative data of its water use. rio tinto reported its water consumption by distinguishing the type of water used as ‘freshwater’ and ‘poor water’ and disclosed the percentage of water used per source. in 2009, rio tinto withdrew 42% of its water from fresh sources and 58% from poor sources. of this, marine water (poor water) accounted for 51%, imported surface water (freshwater) accounted for 27% and other sources included imported groundwater (fresh and poor water), on-site impounded water (poor water) and on-site groundwater (fresh and poor water).
[image:21.595.315.567.528.711.2]breaking down and analysing the use of water by source allows companies to identify specific risks by water source and to establish detailed targets on how to mitigate such risks in certain areas. rio tinto has established a group target to reduce freshwater use per tonne of product by 6% in 2013 from a 2008 baseline.
Figure 10: top-performing companies in the 'Governance' criteria group
score %
foster's Group Ltd 56.3
Woolworths Ltd 50.0
Leighton Holdings Ltd 46.9
bHP billiton Ltd 43.8
stockland 43.8
rio tinto Ltd 40.6
santos Ltd 40.6
onesteel Ltd 40.6
orica Ltd 40.6
Amcor Ltd 37.5
the study showed that few companies have a system in place at board level to address and manage water-specific risks (8 out of 32 companies), nor did many companies have initiatives in place to educate employees specifically on water issues (6 out of 32 companies). nonetheless, 24 companies mentioned the use of alternative water supplies, such as recycled or reused water, and 10 companies had quantitative water-performance targets. the low average score implies that, while companies may have initiatives in place to monitor and improve water performances (as seen from the consumption and implementation criteria groups), there seems to be a lack of strategic water-specific management systems on a company-wide basis. for example, newcrest Mining Ltd has one of the lowest scores (13%) in the governance criteria group, despite scoring the highest (71%) in the implementation criteria group. in addition, none of the 32 companies provided disclosure on water offset initiatives, which highlights that the concept of water-neutrality and its practical implications are not yet recognised by Australian businesses.
Best practice case study: Governing global performance
foster’s Group ltD – score 56%
foster’s Group Limited (foster’s) has a set of environmental performance metrics that are used globally to facilitate the collection of data on energy and water consumption, waste generation and GHG emissions. the Web-based database provides a central repository for data from 90 environmental metrics that are collected from 108 production sites. foster’s rolled out the database over a six-month period in 2009; the rollout included online training and development of data collection protocols to ensure consistency and accuracy across all operations. the development of this database has enabled foster’s to report on progress against
targets, as well as meeting requirements for a number of mandatory reporting regulations.
implementAtion
the implementation criteria group looks at the methods employed within a company’s operations to reduce the effects of water-related issues. it takes into consideration use, disposal and relationships with other bodies. Programmes to use water more efficiently, to manage water disposal effectively and to manage legacy impacts (remediation and so on) were examined, as were
programmes to recycle or reuse water. this research also looked at whether or not companies were working with other industry bodies, including utility companies, non-governmental organisations (nGos) and communities, to address or manage water initiatives, and whether quantitative disclosure was made regarding waste water.
Performance in this section ranged from 71% to 0%, and the overall average was 26%. the average of the top 10 companies was 43%, which was towards the lower end of the scores of all the six key criteria groups. newcrest Mining Ltd provided the most disclosure in this area, with a score of 71%, followed by rio tinto Ltd (57%) and transurban Group (53%). it is also noteworthy that only three companies scored above 50% (see figure 11).
Despite the low overall average, 31 out of 32 companies mentioned the implementation of water programmes, such as the improvement of water efficiency or water recycling. full quantitative disclosure was, however, absent from most companies’ reporting in the areas of wastewater disposal and water recycling, as was information regarding strategies to manage legacy impacts. it was found that 16 of the 32 companies stated that they worked with other relevant industry bodies to manage water-related impacts, but only seven provided further details on such
participation. the results highlight that water improvement programmes are commonly implemented in many
[image:23.595.51.304.563.786.2]Australian companies, but that such positive initiatives are not necessarily as comprehensively reported publicly.
Figure 11: top-performing companies in the ‘implementation’ criteria group
score %
newcrest Mining Ltd 71.4
rio tinto Ltd 57.1
transurban Group nPV 53.6
foster’s Group Ltd 50.0
Lihir Gold Ltd 50.0
santos Ltd 42.9
origin energy Ltd 39.3
bHP billiton Ltd 35.7
bluescope steel Ltd 35.7
coca-cola Amatil Ltd 32.1
Leighton Holdings Ltd 32.1
onesteel Ltd 32.1
stockland 32.1
Best practice case study: Quantitative disclosure and industry participation
newcrest mininG ltD – score 71%
newcrest Mining Limited (newcrest) provided the most disclosure on its initiatives to manage
operational water risks and provided quantitative data on water consumption, recycling and wastewater discharge. three out of the four mining sites were reported to be ‘non-discharge’ sites, which maximise the retention of water within the sites. At the cadia Valley site, water was returned to the process plant from the tailings dam as much as possible (on average 80%), and casual surface and by-products of dewatering were utilised within the process circuit. newcrest stated that water recycling at cadia Valley is estimated to provide 82.5% of daily requirements (99 megalitres per day out of a total water demand of 120 megalitres per day).
Along with the implementation of water-related programmes in the company’s operations, newcrest Mining engaged in industry initiatives to address water-related effects in the mineral industry. newcrest Mining participates in the Minerals council of
Australia’s Water Working Group, which aims to develop a water accounting framework for the minerals industry. the framework provides a consistent approach for quantifying and reporting water flows and enables comparison and sharing of water planning processes in the industry.
supply chAin AnD stewArDship
Looking outside a company’s direct operations, this criteria group examines what policies, programmes and practices companies have in place to manage water risks within their supply chains and in the communities in which they operate. the presence of policies and/or other initiatives to manage water issues within the supply chain were
considered. Additionally, consultation and engagement with other stakeholders, including community groups, regulators, nGos and other industry bodies, were taken into account.
in this criteria group it was evident that, while companies had made efforts to engage with community stakeholder groups to mitigate the water-related effects experienced by such stakeholders from the company’s operations, there was little consideration of risks in relation to the supply chain. Many companies (21 out of 32) had mentioned incorporating water initiatives in stakeholder consultation, but only seven companies had some form of policy or initiative in place to reduce water risks originating from their supply chain. in addition, the 32 companies disclosed limited evidence of strategies and systems to engage with stakeholders on water issues, and only five companies described the mechanisms in place to conduct stakeholder engagement.
Best practice case study: rainwater tank provides water to nearby community
cocA-colA AmAtil ltD – score 67%
coca-cola Amatil Ltd (ccA) has constructed a million-dollar underground rainwater harvesting tank at its northmead operations in 2007. the tank can hold more than two million litres of water and provides water for ccA’s onsite use as well as for the
[image:25.595.50.306.467.640.2]community. Water from the tank is piped under the highway and stored in tanks of the Arthur Phillip reserve, a sports and recreational park in the local neighbourhood, and is used to irrigate the grass all year round. the northmead plant is the first manufacturing plant to receive a five-star rating for water management from sydney Water under the ‘every Drop counts’ business programme. ccA has consulted with neighbouring communities and the local council to understand their needs. Work is underway on a comprehensive redevelopment plan for the reserve, to include seating, landscaping and the replacement of old cricket nets.
Figure 12: top-performing companies in the 'supply chain and stewardship' criteria group
score %
coca-cola Amatil Ltd 66.7
Leighton Holdings Ltd 50.0
rio tinto Ltd 50.0
Woolworths Ltd 50.0
foster's Group Ltd 41.7
Wesfarmers Ltd 33.3
AGL energy Ltd 25.0
Amcor Ltd 25.0
Lend Lease corporation Ltd 25.0
newcrest Mining Ltd 25.0
conclusions
this research shows that while water-related issues are frequently being addressed in sustainability reporting, there is still room for many companies to improve their disclosure on the management of water-related risk issues. the research also highlights the need for a common reporting standard for water disclosure, particularly lagging when compared with other recent mandating of reporting around greenhouse gas (GHG) emissions and energy consumption. in response to restricted water allocations, arising from drought conditions across Australia, and strong community awareness, many companies have developed positive initiatives to
incorporate efficiency measures, water recycling and the use of alternative water sources into their operations. in practice, reporting on the effect of such programmes is not always comprehensive and frequently lacks
quantitative data analysis, which in this research has prevented several companies from achieving high scores.
the research also found that while water is considered to be a material business risk by many companies, limited evidence is disclosed on how such risks are addressed strategically at the management level. there also appears to be little evidence available on initiatives targeting risks to supply chains or communities, or to address water-related gaps in employee education and governance. it is also suggested that companies could improve their governance of water issues by establishing committees at board/executive level specifically to address water-related risks. the success of managing each of these elements also requires companies to recognise the growing need to understand and respond better to evolving stakeholder expectations, not just those of regulators, but also those of people directly affected by their activities, such as
investors, employees and communities.
6. conclusions and recommendations
it is also important for businesses to understand why water disclosure is critical to achieving credible
recommenDAtions
benchmarking
companies need to adopt an established and
internationally accepted benchmark. some companies declared the use of the Gri framework, but did not fully disclose data according to the framework or did not make it clear how and what indicators were used. other
organisations were apparently engaged in water-saving or management activities but were not reporting on their progress against these activities.
integrated reports
companies need to adopt integrated reporting methods, so stakeholders can understand more clearly the
connections between various subsidiaries and/or operating units and have a clear appreciation of the company’s overall performance against corporate strategy. While reporting performance for different operating units and/or subsidiaries of a company is useful for some purposes, it is critical that stakeholders are provided with an
explanation of how a company as a whole (at the group level) is performing. this is part of a transparent picture of company performance.
managing risk
companies need to communicate more effectively their understanding of water as a business risk. Although some examples were found in this research, there is a general lack of disclosure of companies’ efforts to identify and understand the threats or opportunities posed by water issues.
materiality
improved disclosures must include reporting on the materiality of water through quantification of exposure to risk and opportunity, either in monetary terms or production-based reporting, notably, water intensity measures.
measurement
there is an apparent lack of quantitative disclosure in the current reporting, particularly in relation to data on water discharge, breakdown and source of water used, recycling and reuse. companies must establish systems to collect and analyse various water performance data on a company-wide basis.
Goals and targets
companies should report on their goals or targets for water-related risks, particularly in the areas of
consumption, discharge, efficiency and recycling. this should include disclosure of the process by which these targets were set, the baseline and how progress will be measured.
education and awareness
companies should report more comprehensively on employee education initiatives. Many companies did not explicitly state whether water and water management issues were covered in employee training, which is generally labelled ‘environmental’ training.
supply chain risk
company reporting should reflect an awareness of upstream and downstream water risks and opportunities throughout the full operational life cycle and company supply chain. this should include the development of formal guidelines and processes.
supply chain impact
current disclosures do not address the wider impact of companies’ supply chains, which will become increasingly important in future. though many companies have begun reporting on efforts taken to reduce detrimental
environmental effects in the supply chain through green procurement practices and the measuring of indirect GHG emissions, no such guidelines or practices are being reported with specific reference to water issues.
community engagement
companies for which water is a material issue should develop and disclose formal community engagement programmes where appropriate. the research indicated that many companies lacked formal established
Abs (Australian bureau of statistics) (2006), ‘4610.0 Water Account, Australia 2004–5’ [online text], <http://www.abs. gov.au/ausstats/[email protected]/productsbytitle/9f319397D7A9 8Db9cA256f4D007095D7?openDocument>, accessed 2 July 2010.
AccA (2009), Water: The Next Carbon? <http://www. accaglobal.com/documents/Waterfootprinting.pdf>, accessed 15 March 2010.
bureau of Meteorology (Australia) (2010), ‘Annual Australian climate statement 2009’ [online text], <http:// www.bom.gov.au/announcements/media_releases/ climate/change/20100105.shtml>, accessed 2 July 2010.
bHP billiton Ltd (2009), Sustainability Report 2009, <http://www.bhpbilliton.com/bbcontentrepository/docs/ sustainabilitysummaryreport2009.pdf>, accessed 19 April 2010.
cDP (carbon Disclosure Project) (2010), ‘Water Disclosure’ [online text], <https://www.cdproject.net/en-us/
Programmes/Pages/cdp-water-disclosure. aspx#objectives>, accessed 22 March 2010.
ceres (coalition for environmentally responsible economies) (2010), Murky Waters? Corporate Reporting on Water Risk, A Benchmarking Study of 100 Companies, <http://www.ceres.org/Document.Doc?id=547>, accessed 22 March 2010.
csiro(commonwealth scientific and industrial research organization) (2010), ‘Water overview’ [online text], <http://www.csiro.au/org/Wateroverview.html>, accessed 15 March 2010.
Hills, J. and Welford, r. J. (2005), ‘case study: coca-cola and Water in india’, Corporate Social Responsibility and Environmental Management, 12: 168–77.
Hone, s., foster, A., Hafi, A., Goesch, t., sanders, o., Mackinnon, D. and Dyack, b. ( 2010), Assessing the Future Impact of the Australian Government Environmental Water Purchase Program, AbAre research report 10.03, [online report], <http://www.abare.gov.au/publications_html/ landwater/landwater_10/waterbuyback.pdf>, accessed 30 July 2010.
ioD (institute of Directors south Africa) (2009), King Report on Governance for South Africa (King iii) [online report], <http://www.iodsa.co.za/products_reports. asp?catiD=150>, accessed 30 July, 2010.
Melbourne Water (2008), Sustainability Report 2008, <http://www.melbournewater.com.au/content/library/ publications/reports/annual_report/Melbourne_Water_ sustainability_report_2008-09.pdf>, accessed 5 July 2010.
nbiM (norges bank investment Management) (2009),
NBIM Investor Expectations: Water Management, [online report], <http://www.nbim.no/Global/brochures/Water_ web.pdf>, accessed 30 July 2010.
net balance and AccA (2007), Disclosures on Climate Change, <http://www.netbalance.com/research/climate_ report.pdf>, accessed 2 July 2010.
nsW Government (2010), ‘sydney’s Wind Powered Desalination Plant now online’ [online press release], <http://www.sydneywater.com.au/WhoWeAre/
Mediacentre/documents/ministerial/Keneally_switch%20 on_280110.pdf>, accessed 30 July 2010.
nWca (Australian Government, national Water commission) (2010), ‘indigenous Water Management’ [online text], <http://www.nwc.gov.au/www/html/273-indigenous-water-issues.asp>, accessed 15 March 2010.
nWcb (Australian Government, national Water
commission) (2010), The Impacts of Water Trading in the Southern Murray–Darling Basin: an Economic, Social and Environmental Assessment [online report], <http://www. nwc.gov.au/www/html/2816-impacts-of-water-trading-in-the-southern-murraydarling-basin.asp?intsiteiD=1>, accessed July 30, 2010.
sec (united states securities and exchange commission) (2010), ‘sec issues interpretive Guidance on Disclosure related to business or Legal Developments regarding climate change’ [online press release], January 2010, <http://www.sec.gov/news/press/2010/2010-15.htm>, accessed 30 July 2010.
sydney Water (2009), Sydney Water Annual Report 2009
[online report], <http://www.sydneywater.com.au/ Annualreport/performance/water_efficiency.html#water_ efficiency>, accessed 30 July 2010.
sydney Water (2010), ‘sewer Mining’ [online text], <http:// www.sydneywater.com.au/Water4Life/recyclingandreuse/ recyclingAndreuseinAction/sewerMining.cfm>, accessed 30 July 2010.
oecD (organisation for economic co-operation and Development) (2005), ‘institutional overview from an Australian Perspective – with Particular focus of the Murray–Darling basin’, Workshop on Agriculture and Water: sustainability, Markets and Policies, no. 5, 14–18 november, south Australia.
uneP (united nations environment Programme) (2010),
Corporate Water Accounting: an Analysis of Methods and Tools for Measuring Water Use and Its Impact, [online report], <http://www.pacinst.org/reports/corporate_water_ accounting_analysis/corporate_water_accounting_analysis. pdf>, accessed 30 July 2010.
unGc (united nations Global compact) (2010), ‘the ceo Water Mandate’ [online text], <http://www.
unglobalcompact.org/issues/environment/ceo_Water_ Mandate/>, accessed 22 March 2010.
Water footprint network (2010), [website] <http://www. waterfootprint.org>, accessed 2 April 2010.
other reports by net bAlAnce AnD
AccA AustrAliA AnD new ZeAlAnD
Disclosures on Social Investment,
AccA 2010.
Disclosures on Corporate Governance, AccA 2009.
Anti-bribery and Corruption Reporting Disclosures, AccA 2008.
Disclosures on Human Capital Management, AccA 2008.
Disclosures on Climate Change, AccA 2007.
Disclosures on Stakeholder Engagement, AccA 2007.