
P-MaNGA: Emission Lines Properties - Gas Ionisation and
Chemical Abundances from Prototype Observations
F. Belfiore,
1,2?R. Maiolino,
1,2K. Bundy,
3D. Thomas,
4C. Maraston,
4D. Wilkinson,
4S. F. S´
anchez,
5M. Bershady,
6G. A. Blanc,
7M. Bothwell,
1,2S. L. Cales,
8L. Coccato,
9N. Drory,
10E. Emsellem,
9,11H. Fu,
12J. Gelfand,
13,14D. Law,
15K. Masters,
4,16J. Parejko,
8C. Tremonti,
6D. Wake,
6,17A. Weijmans,
18R. Yan,
19T. Xiao,
20K. Zhang,
21T. Zheng,
12D. Bizyaev,
22K. Kinemuchi,
22D. Oravetz
22and A. Simmons
22(Affiliations can be found after the references)
12 February 2015
ABSTRACT
MaNGA (Mapping Nearby Galaxies at Apache Point Observatory) is a 6-year SDSS-IV survey that will obtain spatially resolved spectroscopy from 3600 ˚A to 10300 ˚A for a representative sample of over 10000 nearby galaxies. In this paper we present the analysis of nebular emission line properties using observations of 14 galaxies obtained with P-MaNGA, a prototype of the MaNGA instrument. By using spatially resolved diagnostic diagrams we find extended star formation in galaxies that are centrally dominated by Seyfert/LINER-like emission, which illustrates that galaxy characteri-sations based on single fibre spectra are necessarily incomplete. We observe extended LINER-like emission (up to 1Re) in the central regions of three galaxies. We make use of the EW(Hα) to argue that the observed emission is consistent with ionisation from hot evolved stars. We derive stellar population indices and demonstrate a clear correlation between Dn(4000) and EW(HδA) and the position in the ionisation diag-nostic diagram: resolved galactic regions which are ionised by a Seyfert/LINER-like radiation field are also devoid of recent star formation and host older and/or more metal rich stellar populations. We also detect extraplanar LINER-like emission in two highly inclined galaxies, and identify it with diffuse ionised gas. We investigate spa-tially resolved metallicities and find a positive correlation between metallicity and star formation rate (SFR) surface density. We further study the relation between N/O vs O/H on resolved scales. We find that, at given N/O, regions within individual galaxies are spread towards lower metallicities, deviating from the sequence defined by galac-tic central regions as traced by Sloan 300 fibre spectra. We suggest that the observed dispersion can be a tracer for gas flows in galaxies: infalls of pristine gas and/or the effect of a galactic fountain.
Key words: galaxies: surveys – galaxies: evolution – galaxies: fundamental parame-ters – galaxies: ISM – galaxies: abundances – galaxies: active
1 INTRODUCTION
The Sloan Digital Sky Survey (SDSS, York et al. 2000) has proved to be a transformational tool for the study of galaxy evolution. The statistical power of the SDSS galaxy
sam-? [email protected], Cavendish Laboratory, Cambridge, CB3 0HE, UK
ple has shed light on the complex interplay of phenomena that shape the formation and evolution of galaxies - from their history of star formation and chemical enrichment, the impact of inflows and outflows, to the role of active galactic nuclei (AGN), the effect of environment on galaxy properties and cessation of star formation (Kauffmann et al. 2003a,b; Brinchmann et al. 2004; Tremonti et al. 2004; Kewley et al. 2006; Asari et al. 2007; Mannucci et al. 2010; Peng et al.
©0000 RAS
2010; Thomas et al. 2010; Johansson, Thomas & Maraston 2012). SDSS currently provides the most comprehensive pic-ture of galaxies in the low-redshift Universe, against which theories of galaxy evolution are tested and properties of high redshift objects are compared.
Despite its tremendous success, Sloan spectroscopy suf-fers from a major drawback: the single 300-diameter Sloan fibre can only trace circum-nuclear galactic properties. For nearby galaxies the derived properties might not be repre-sentative of the galaxy as a whole, since the fibre might just be targeting the galactic centre or other areas of high sur-face brightness. By investigating the full 2D spectroscopic structure of galaxies, integral field spectroscopy (IFS) pro-vides the ideal observational tool to circumvent this prob-lem, while adding a whole new dimension to the study of galaxy evolution by providing spatially resolved spectral in-formation in the optical and near-IR.
In the last decade the internal structure and kinemat-ics of galaxies in the local universe have been successfully studied using IFS by the SAURON (de Zeeuw et al. 2002), ATLAS3D(Cappellari et al. 2011), DiskMass (Bershady et al.
2010) and VENGA (Blanc et al. 2013) surveys, just to men-tion a few. The ongoing CALIFA (S´anchez et al. 2012a) and SAMI (Croom et al. 2012) surveys, planning to observe re-spectively 600 and 3400 galaxies, are currently extending IFS data to much more representative samples of nearby galaxies of all morphologies. Moreover new instruments with IFS capabilities are now available on large telescopes (for ex-ample KMOS (Sharples et al. 2006) and MUSE (Bacon et al. 2010)) and future large ground-based and space telescopes (e.g., E-ELT, JWST) are planning to provide IFS capability for the study of the high-redshift Universe. In this frame-work it is clear that a large IFS survey of the local Universe is needed to provide a suitable benchmark for future high-z observations.
Intending to provide the next step forward towards a statistically representative IFS survey of the nearby Uni-verse, one of the three major programs of the fourth gener-ation SDSS (SDSS-IV) is dedicated to a large IFS survey of local galaxies called MaNGA (Mapping Nearby Galaxies at APO). MaNGA plans to observe 10000 galaxies with aver-age redshift < z >= 0.03, systematically covering galax-ies out to 1.5 and 2.5 effective optical radii (Re) in the wavelength range 3600˚A< λ <10300˚A. A detailed survey overview, describing MaNGA’s key science questions, is pre-sented in Bundy et al. (2014). The MaNGA survey started on 1st July 2014, and the program will run for 6 years, utilis-ing half of the dark time available in SDSS-IV. Details on the instrumentation including the design, testing, and assembly of the IFUs are given in Drory et al. (2014). Wake et al. (in preparation) presents the sample design, optimisation, and final selection of the survey. The software and data frame-work as well as the reduction pipeline is described in Law et al. (in preparation). A description of the commissioning, the quality of survey observations and further operational details will be given in Yan et al. (in preparation).
In this work we exploit observations of 14 galaxies ob-tained with a prototype of the MaNGA instrument (P-MaNGA), which were secured through a generous donation of observing time by the SDSS-III Collaboration (Eisenstein et al. 2011). This data and the P-MaNGA setup is described in more detail in Bundy et al. (2014). In this work we
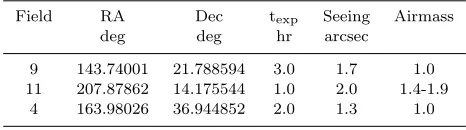
fo-Table 1.Summary of galaxy fields observed during the MaNGA prototype observations (P-MaNGA, January 2013).
Field RA Dec texp Seeing Airmass
deg deg hr arcsec
9 143.74001 21.788594 3.0 1.7 1.0 11 207.87862 14.175544 1.0 2.0 1.4-1.9
4 163.98026 36.944852 2.0 1.3 1.0
cus on two broad science areas: the study of the spatially resolved properties of the ionised gas and the study of spa-tially resolved gas chemical abundances.
The study of gas ionisation and chemical abundances using IFS has benefited from the efforts of previous sur-veys (Sarzi et al. 2006, 2010; Sharp & Bland-Hawthorn 2010; Alonso-Herrero et al. 2010; Arribas et al. 2014), which were, however, limited by small sample size and/or narrow wave-length coverage. Recent publications from the CALIFA and SAMI collaborations (S´anchez et al. 2012b; Kehrig et al. 2012; Fogarty et al. 2012; S´anchez et al. 2013; Papaderos et al. 2013; Singh et al. 2013; S´anchez et al. 2014b) have considerably extended on previous work and demonstrated the power of IFS in disentangling different sources of gas ionisation and probing chemical abundances of star-forming regions at different galactocentric radii. The MaNGA survey, with its extended and continuous wavelength coverage and large galaxy sample, will provide the necessary step forward to understand how the trends studied in previous work be-have statistically in the overall galaxy population and vary as a function of environment and other galactic properties. The work presented here is intended as a demonstration of the insights that the MaNGA survey might deliver in this area.
More specifically, in this work we present resolved clas-sical Baldwin-Phillips-Terlevich (BPT, Baldwin, Phillips & Terlevich 1981; Veilleux & Osterbrock 1987) diagrams for the 14 emission-line galaxies in our sample. Four of these galaxies are classified as Seyfert/LINER based on Sloan single-fibre spectra, and 10 as star formation dominated. We further investigate the relation between the gas exci-tation conditions and properties of the underlying stellar population. Finally, we investigate the relation between spa-tially resolved metallicity and star formation rate as well as the spatially resolved distribution of the nitrogen-to-oxygen abundance ratio. These tracers, we argue, might provide in-sights into the star formation history and gas flows in galax-ies
This paper is structured as follows. In Section 2 we de-scribe the P-MaNGA observations of our galaxy sample and the reduction steps leading to the science-level datacubes. In Section 3 we describe the subsequent analysis performed on the datacubes to derive emission line fluxes. In Sections 4 and 5 we describe our results on ionised gas properties and chemical abundances. Finally in Section 6 we present the overall conclusions.
2 OBSERVATIONS AND DATA REDUCTION
Observations were carried out using the P-MaNGA instru-ment in January 2013. P-MaNGA was designed to explore
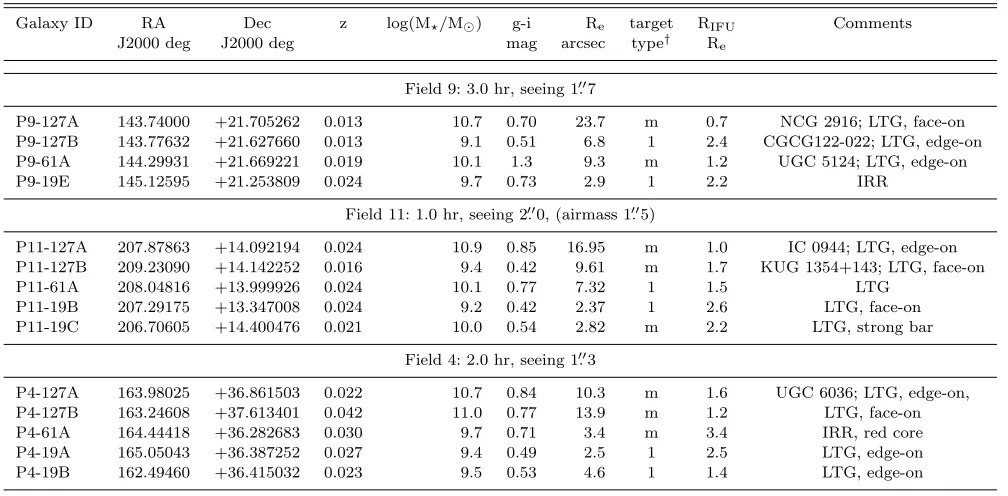
[image:2.612.306.539.120.185.2]a variety of instrument design options and observing strate-gies, hence P-MaNGA data differ substantially from the MaNGA survey data in several ways. The P-MaNGA in-strument consisted of a set of 8 hexagonal fibre bundles, deployed across a field of view of 3 degrees in diameter on the Sloan 2.5 m telescope at Apache Point Observatory. In-dividual science Integral Field Units (IFUs) consisted of 19 fibres (12.005 diameter, 5 per field), 61 fibres (22.005 diameter, 1 per field) and 127 fibres (32.005 diameter, 2 per field), feed-ing one of the two BOSS spectrographs (Smee et al. 2013). This IFU size distribution differs from that adopted by the MaNGA survey, and hence the masses and sizes of the P-MaNGA galaxies are not representative of the final P-MaNGA sample. While some of the P-MaNGA targets were drawn from an earlier version of the MaNGA sample selection (see target column in Table 2), some targets were chosen for spe-cific testing tasks. In particular three galaxies were chosen to provide overlap with the CALIFA DR1 galaxy sample (Husemann et al. 2013).
P-MaNGA observations were obtained of three galaxy fields (labelled 9, 4 and 11, see summary in Table 1). In each case, observations were obtained in sets of three 20-minute exposures, dithered by roughly a fibre radius along the vertices of an equilateral triangle to provide uniform coverage across each IFU. These three fields were observed to varying depths, and in varying conditions, as required by the P-MaNGA engineering tasks that they were designed for. Field 9 was observed to a depth comparable to what will be regularly achieved during MaNGA operations, but both Field 11 and Field 4 are significantly shallower than MaNGA survey data. Moreover Field 11 was intentionally observed at high airmass, resulting in particularly poor image quality. For each field one of the 19-fibre IFU was targeted at a region of blank sky and a second one at a standard star, leading to a final sample of 18 galaxies. Of these, 4 galaxies will not be discussed in this work, since their spectra do not show significant emission lines. Table 2 provides an overview of the 14 galaxies observed by P-MaNGA which will be discussed in this work.
The raw data was reduced using a prototype of the MaNGA Data Reduction Pipeline (DRP), which is described in detail by Law et al. (in prep). In brief, individual fibre spectra were extracted using a row-by-row algorithm, wave-length calibrated using a series of Neon-Mercury-Cadmium arc lines, and flatfielded using internal quartz calibration lamps. Sky-subtraction of the IFU fibre spectra was per-formed by constructing a cubic basis spline model of the sky background flux as seen by the 41 individual fibres placed on blank regions of sky, and subtracting off the resulting com-posite spectrum shifted to the native wavelength solution of each IFU fibre. Sky subtraction in the P-MaNGA data red-ward of∼8000 ˚A suffered from a coma aberration in the red channel of the BOSS spectrograph used. This issue has now been fixed and will not affect MaNGA survey data, which is expected to reach Poisson-limited sky subtraction at all wavelengths (see Drory et al. 2014, Law et al. in prep).
Flux calibration of the P-MaNGA data was performed by fitting Kurucz model stellar spectra to the spectra of cal-ibration standard stars covered with single fibres at each of the three dither positions. The flux calibration vectors de-rived from these single-fibre spectra were found to vary by ∼10% from exposure to exposure, depending on the amount
of light lost from the fibre due to atmospheric seeing and as-trometric misalignments. While this uncertainty is accept-able for the present science purposes, the flux calibration uncertainty of the single fibres ultimately drove the design decision of the MaNGA survey to instead use 7-fibre IFU ‘mini-bundles’ for each calibration standard star, which re-sult in a photometric accuracy of 2.5% between Hα and Hβand of 7% between [NII]λ6584 and [OII]λλ3726,29 for MaNGA survey data (see Yan et al., in prep.).
Flux calibrated spectra from the blue and red cameras were combined together across the dichroic break using an inverse-variance weighted basis spline function. Astromet-ric solutions were derived for each individual fibre spectrum that incorporate information about the fibre location within an IFU, dithering, and atmospheric chromatic differential refraction, among other effects. Fibre spectra from all expo-sures for a given galaxy were then combined together into a single datacube (and corresponding error vectors) using these astrometric solutions and a nearest-neighbour sam-pling algorithm similar to that used by the CALIFA sur-vey. For the P-MaNGA datacubes, a spaxel size of 0.005 was chosen. The typical effective spatial resolution in the recon-structed datacubes can be described by a Gaussian with FWHM≈2.005.
As a check on our spectrophotometry, a spectrum was extracted from the P-MaNGA datacubes in a 3” aperture at the position of the SDSS-I Legacy fibre spectrum. We find that P-MaNGA spectrophotometry agrees with that of Sloan spectra within better than 10 % over the whole wave-length range of the Sloan spectra for Plates 4 and 9. In the case of Plate 11, taken at high airmass, a distortion in the spectral shape of the P-MaNGA data is observed blue-ward of 4500 ˚A with respect to the Sloan single fibre spec-tra. The amplitude and shape of the distortion is approx-imately constant over all the galaxies on this plate. Given the poorer spectrophotometric accuracy of P-MaNGA Plate 11 observations with respect to the legacy Sloan spectra, the P-MaNGA spectral shape was anchored to that of the Sloan spectrum blueward of 4500 ˚A. This procedure leads to an overall spectrophotometric accuracy of 15% for Plate 11 in the blue with respect to the legacy Sloan spectra. Absolute flux calibration of the P-MaNGA data was anchored to that of Sloan photometry in the r-band.
For more details on the P-MaNGA hardware and ob-servations, see Bundy et al. (2014), sections 4.7 and 7.1.
3 DATA ANALYSIS
The final products of the Data Reduction Pipeline are sky subtracted, wavelength calibrated and interpolated data and error cubes. In this work we extract emission line fluxes by first fitting simple stellar population (SSP) models to the spectra and then fitting the emission lines with Gaussian functions. We expand and adapt a suite of routines from the preliminary MaNGA analysis pipeline (see Wilkinson et al., submitted, for further details on the MaNGA analysis pipeline).
The detailed sequence of steps implemented to extract the emission line fluxes in each P-MaNGA galaxy is de-scribed in the rest of this section.
(i) For each spaxel in the datacube, the signal and noise
Table 2. Galaxy sample. Data from SDSS DR7 Abazajian et al. (2009). Stellar masses are from the MPA-JHU catalogue, based on Kauffmann et al. (2003a). LTG=late type galaxy, IRR=irregular.
Galaxy ID RA Dec z log(M?/M) g-i Re target RIFU Comments
J2000 deg J2000 deg mag arcsec type† R
e
Field 9: 3.0 hr, seeing 1.007
P9-127A 143.74000 +21.705262 0.013 10.7 0.70 23.7 m 0.7 NCG 2916; LTG, face-on P9-127B 143.77632 +21.627660 0.013 9.1 0.51 6.8 1 2.4 CGCG122-022; LTG, edge-on P9-61A 144.29931 +21.669221 0.019 10.1 1.3 9.3 m 1.2 UGC 5124; LTG, edge-on
P9-19E 145.12595 +21.253809 0.024 9.7 0.73 2.9 1 2.2 IRR
Field 11: 1.0 hr, seeing 2.000, (airmass 1.005)
P11-127A 207.87863 +14.092194 0.024 10.9 0.85 16.95 m 1.0 IC 0944; LTG, edge-on P11-127B 209.23090 +14.142252 0.016 9.4 0.42 9.61 m 1.7 KUG 1354+143; LTG, face-on
P11-61A 208.04816 +13.999926 0.024 10.1 0.77 7.32 1 1.5 LTG
P11-19B 207.29175 +13.347008 0.024 9.2 0.42 2.37 1 2.6 LTG, face-on
P11-19C 206.70605 +14.400476 0.021 10.0 0.54 2.82 m 2.2 LTG, strong bar
Field 4: 2.0 hr, seeing 1.003
P4-127A 163.98025 +36.861503 0.022 10.7 0.84 10.3 m 1.6 UGC 6036; LTG, edge-on,
P4-127B 163.24608 +37.613401 0.042 11.0 0.77 13.9 m 1.2 LTG, face-on
P4-61A 164.44418 +36.282683 0.030 9.7 0.71 3.4 m 3.4 IRR, red core
P4-19A 165.05043 +36.387252 0.027 9.4 0.49 2.5 1 2.5 LTG, edge-on
P4-19B 162.49460 +36.415032 0.023 9.5 0.53 4.6 1 1.4 LTG, edge-on
Notes:† Target type 1 indicates the galaxy would be selected in the MaNGA Survey’s Primary sample. “m” indicates a galaxy that was chosen manually for the prototype run. RIFUindicates the radial coverage of the allocated bundle in units of Re. Revalues are taken from an extended version of the NASA-Sloan Atlas (NSA, http://www.nsatlas.org, Blanton et al. 2011).
per pixel are computed on the r-band continuum. Spaxels with S/N lower than a specified threshold (here S/N = 4) are discarded.
(ii) The remaining spaxels are binned using a centroidal Voronoi binning algorithm (Cappellari & Copin 2003) to reach a target r-band S/N of 301. The noise from different
spaxels is coadded in quadrature, neglecting the fact that errors in different spaxels are correlated because of the in-terpolation procedure used to create the datacube.
(iii) In each bin, a linear combination of SSP templates is fitted to the spectrum, using Penalised Pixel Fitting (Cap-pellari & Emsellem 2004), after correcting for systemic ve-locity (as estimated from the redshift) and instrumental dis-persion (taken as 2.73 ˚A FWHM). For the purposes of this work we use a set of 29 models generated using Maraston & Stromback (2011) templates based on the STELIB empirical stellar library (Le Borgne et al. 2003), chosen to represent a wide range in age and stellar metallicity (ages from 0.2 to 15 Gyr and three metallicities: [Z/H] = −2.25,0.00,0.35). A region of 600 km s−1 is masked around each fitted
emis-sion line and strong sky lines. Additive and multiplicative polynomials are also used to take into account residual im-perfections in the spectrophotometry, stellar exctinction and possible contribution to the continuum emission from non-stellar (e.g. AGN) sources. In this work we allowed the fit to use polynomials of up to fourth degree.
1 From now on we call ‘Voronoi bins’ all the bins that have been created by this procedure, even when they consist of single spax-els, as is often the case in centres of galaxies or other regions of high S/N.
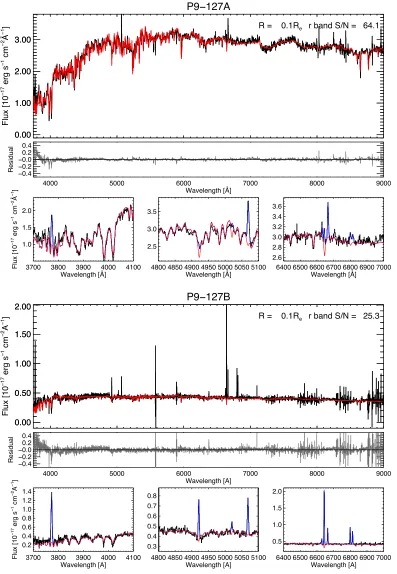
(iv) In each bin, the stellar population fit is subtracted from the observed spectrum to obtain a pure emission line spectrum. This is then fitted with a set of Gaussian func-tions, one per emission line. The initial guesses for the emis-sion lines velocities and velocity disperemis-sion are set to be equal to the ones derived from the SSP fitting of the stellar continuum. Multiplets are set to have the same velocity and velocity dispersion and the ratio of intensities is fixed to the theoretical one (here only in the case of [OIII]λλ4945,5007 and [NII]λλ6548,6584), while for the other lines no con-straints are set. Figure 1 shows spectra from the nuclear regions of two different galaxies (P9-127B and P9-127A), fit-ted using this procedure. We calculate emission line fluxes by integrating the flux under the fitted Gaussian. Errors are calculated for each emission line flux.
(v) The reddening (for the gas component) is calculated from the Balmer decrement, for those spaxels where we de-tect both Hαand Hβ with S/N>3, and a Calzetti (2001) reddening curve with RV = 4.05. The theoretical value for
the Balmer line ratio is taken from Osterbrock & Ferland (2006), assuming case B recombination (Hα/Hβ= 2.87). We note that the use of extinction curve of Cardelli, Clayton & Mathis (1989) (or the modification by O’Donnell 1994) with RV= 3.1 yields very similar results for the 3000 ˚A to 7000
˚
A wavelength range considered in this work.
To test the reliability of the emission line fluxes, the fitting procedure detailed above was repeated using the Bruzual & Charlot (2003) templates (BC03, used in pre-vious work with SDSS data, for example: Kauffmann et al. 2003a; Tremonti et al. 2004; Brinchmann et al. 2004). Both
0.00 1.00 2.00 3.00
P9−127A
0.00 1.00 2.00 3.00
Flux [10
−
17 erg s
−
1 cm
−
2 Å
−
1 ] R = 0.1Re r band S/N = 64.1
4000 5000 6000 7000 8000 9000
Wavelength [Å]
−0.4
−0.2
−0.0 0.2 0.4
Residual
3700 3800 3900 4000 4100
Wavelength [Å] 1.0
1.5 2.0
Flux [10
−
17 erg s
−
1 cm
−
2Å
−
1]
4800 4850 4900 4950 5000 5050 5100 Wavelength [Å]
2.5 3.0 3.5
6400 6500 6600 6700 6800 6900 7000 Wavelength [Å]
2.6 2.8 3.0 3.2 3.4 3.6
0.00 0.50 1.00 1.50
2.00
P9−127B
0.00 0.50 1.00 1.50 2.00
Flux [10
−
17 erg s
−
1 cm
−
2 Å
−
1 ] R = 0.1Re r band S/N = 25.3
4000 5000 6000 7000 8000 9000
Wavelength [Å] −0.4
−0.2
−0.00.2
0.4
Residual
3700 3800 3900 4000 4100
Wavelength [Å] 0.2
0.4 0.6 0.8 1.0 1.2 1.4
Flux [10
−
17 erg s
−
1 cm
−
2Å
−
1]
4800 4850 4900 4950 5000 5050 5100 Wavelength [Å]
0.3 0.4 0.5 0.6 0.7 0.8
6400 6500 6600 6700 6800 6900 7000 Wavelength [Å]
[image:5.612.92.489.94.668.2]0.5 1.0 1.5 2.0
Figure 1.Spectral fitting of two spectra, corresponding to Voronoi bins in the central regions of two galaxies: P9-127B and P9-127A. For each galaxy, the top panel shows the spectrum (black) with the SSP fitting (red). Fit residuals are shown in the middle panel. The smaller panels at the bottom show the details of the fit in three narrow wavelength ranges: around 4000 ˚A (note the prominent [OII] λ3727 unresolved doublet), 5000 ˚A (with prominent Hβand [OIII]λλ4945,5007 lines) and 6700 ˚A (with prominent Hα, [NII]λλ6548,6584 and [SII]λλ6717,6731 lines). The observed spectrum is in black, the SSP fit in red and the emission line fit (summed to the SSP fit) in blue. The galactocentric distance in units of Reand the S/N in the r-band (from fit residuals) is shown in the top right corner.
0.00 2.00 4.00 6.00 8.00 10.00 P9−127B 0.00 2.00 4.00 6.00 8.00 10.00 Flux [10 −
17 erg s
−
1 cm
−
2Å
−
1] R = 0.8Re r band S/N = 14.9
4000 5000 6000 7000 8000 9000 Wavelength [Å] −0.4 −0.2 −0.00.2 0.4 Residual
3700 3800 3900 4000 4100 Wavelength [Å] 2 4 6 Flux [10 −
17 erg s
−
1 cm
−
2Å
−
1]
4800 4850 4900 4950 5000 5050 5100 Wavelength [Å] 1.0 1.5 2.0 2.5 3.0 3.5
6400 6500 6600 6700 6800 6900 7000 Wavelength [Å] 2 4 6 8 10 0.00 1.00 2.00 3.00 4.00 5.00
6.00 P9−127B
0.00 1.00 2.00 3.00 4.00 5.00 6.00 Flux [10 −
17 erg s
−
1 cm
−
2Å
−
1] R = 2.0Re r band S/N = 7.1
4000 5000 6000 7000 8000 9000
Wavelength [Å] −0.4 −0.2 −0.0 0.2 0.4 Residual
3700 3800 3900 4000 4100 Wavelength [Å] 1 2 3 4 5 6 Flux [10 −
17 erg s
−
1 cm
−
2Å
−
1]
4800 4850 4900 4950 5000 5050 5100 Wavelength [Å] 1.0
1.5 2.0 2.5
6400 6500 6600 6700 6800 6900 7000 Wavelength [Å] 1
[image:6.612.43.287.82.446.2]2 3 4
Figure 2.Spectral fitting of two off-nuclear spectra, correspond-ing to Voronoi bins in the outskirts of P9-127B. Galactocentric distance and S/N in the r-band are shown for each spectrum in the top right corner (see caption in Fig. 1 for full details).
the fit residuals and the emission line fluxes obtained with the M11 STELIB and BC03 templates were found to be in good statistical agreement. The reduced χ2 for the contin-uum fit favours the M11 STELIB models. We will therefore present results obtained using the M11 STELIB templates, although the use of BC03 templates does not significantly affect any of our conclusions.
To evaluate the effect of neglecting noise correlation be-tween different spaxels when building the Voronoi bins, we estimate of the noise ‘a posteriori’ using the standard devi-ation of the fit residuals in the r-band. While this noise esti-mate will be affected by template mismatch, it should repre-sent an upper limit on the true noise vector. We observe that the S/N calculated using the fit residuals is up to a factor of 2-3 lower than that estimated from the error vectors associ-ated with each bin, and follows a functional form similar to that found in CALIFA data (Husemann et al. 2013; Garcia-Benito et al. 2014). The error vectors were hence rescaled to match the fit residuals (S/N shown in Fig. 1 and 2 refers to the fit residuals). This approach differs from the one re-cently implemented by the SAMI collaboration (Sharp et al. 2014), who deliver an estimate of the covariance matrix gen-erated by their cube-reconstruction algorithm. To date, no
work has attempted to compare these different approaches and estimate the effect that the choice of method has on the final error vectors. This comparison, although important to validate the soundness of our error analysis and timely in the era of large IFS surveys, goes beyond the scope of this prototype data paper and will be presented in future publi-cations from the MaNGA collaboration.
In Fig. 2 we show two off-nuclear spectra from P9-127B, the galaxy in our sample that most closely resem-bles MaNGA survey quality data in terms of exposure time, airmass and sample selection. Two spectra are shown, be-longing to bins at deprojected galactocentric radii of 0.8 Re
and 2 Re. In both of these spectra all strong emission lines
([OII]λ3727,[OIII]λλ4945,5007, Hβ, Hα, [NII]λλ6548,6584 and [SII]λλ6717,6731) are detected above the noise level even at such large galactocentric distances.
Maps of Hαflux, velocity and velocity dispersion for all the galaxies are presented in the Appendix.
4 GAS IONISATION DIAGNOSTICS
4.1 The BPT Diagram
The BPT diagram is a powerful tool to identify the dominant mechanism of gas ionisation using ratios of strong optical lines (Baldwin, Phillips & Terlevich 1981; Veilleux & Oster-brock 1987). The most popular version of this diagnostic di-agram makes use of the [OIII]λ5007/Hβand [NII]λ6584/Hα line ratios ([NII] BPT). Other commonly used ionisation di-agnostic diagrams substitute the [NII]λ6584/Hα with the [SII]λλ6717,31/Hα([SII] BPT) or [OI]λ6300/Hαline ratios. Kewley et al. (2001) (K01) used population synthesis models together with photoionisation models to construct a division line, arguing that points above the line cannot be reproduced using star forming models alone. With the advent of the SDSS survey it became apparent that galax-ies tend to lie in two well-defined sequences in the BPT diagram, leading to the characteristic ‘sea gull’ shape. The left-wing sequence is associated with star-forming galaxies, while the right-wing sequence is associated with other ionisa-tion mechanisms, including photoionisaionisa-tion by AGN (Type 2 Seyfert nuclei), Low Ionisation Nuclear Emission-line Re-gions (LINER) and shocks.
Kauffmann et al. (2003b) (K03) proposed a modifica-tion of the K01 line to better match the observamodifica-tional data derived from more than 105 galaxies from SDSS. More
re-cently Stasinska et al. (2006) studied the demarcation lines of K03 and K01 using composite AGN+SF photoionisation models and concluded that the K03 demarcation line al-lows for contamination from an AGN to the Hβ flux of <3% while the K01 line allows for a contamination up to roughly 20%. Qualitatively similar conclusions are obtained by Schawinski et al. (2010), who argue that for an AGN sample with L[OIII] = 1040 erg s−1, about 13% of the ob-jects would appear as left-wing sources if observed through the 300Sloan fibre, based on the K03 delimiter.
The right-wing of the BPT diagram is known to show a bimodality, and is generally divided into an upper branch (we will refer to this as the Seyfert branch, although we only wish to state that these objects have Seyfert-like line ratios) and a lower branch (the LINER branch, populated
by object with LINER-like line ratios). Kewley et al. (2006) studied this bimodality from an empirical perspective and concluded that the division between the two classes is most evident by using the [OI]/Hαand [SII]/Hαline ratios. Hence in this work we will be using the demarcation in the [SII]/Hα diagram to distinguish between the Seyfert-like and LINER-like branches.
The LINER-like branch, accounting for up to a third of all galaxies (Ho, Filippenko & Sargent 1997a; Cid Fernandes et al. 2010), is generally characterised by an ionisation mech-anism significantly different from that of known Seyfert nu-clei. Nuclear LINERs are thought to be associated with low-luminosity accreting black holes with a very hard ionisation spectrum, and some of them are known to host an X-ray de-tected AGN (Gonzalez-Martin et al. 2009). However, other possible explanations have been put forward, especially to account for LINER-like emission on extended scales, includ-ing ionisation by post-asymptotic giant branch (post-AGB) stars (Binette et al. 1994; Goudfrooij 1999), shocks (Heck-man 1980; Lipari et al. 2004; Rich, Kewley & Dopita 2011, 2014) and hot (possibly Wolf-Rayet) stars (Terlevich & Mel-nick 1985; Barth & Shields 2000).
Post-AGB stars represent a particularly promising ex-planation, since they are the natural product of stellar evolu-tion and have been shown to produce the required LINER-like line ratios, at least within the uncertainties of mod-ern stellar population modelling (Cid Fmod-ernandes et al. 2010, 2011). Moreover it has been found that extended LINER-like sources (Sarzi et al. 2010; Yan & Blanton 2012; Singh et al. 2013) have radial profiles of line emission surface bright-ness shallower thanr−2. Some authors have argued that this represents evidence against ionisation from a central point source. However, Yan & Blanton (2012) correctly point out that line emission surface brightness gradients are chiefly de-pendant on several unknown parameters (including the gas filling factor, the spatial distribution of gas clouds, and the gas density), and hence do not provide sufficient evidence for ruling out ionisation from a central point source.
LINER-like line ratios can also be produced by harden-ing of the ionisharden-ing spectra due to photoelectric absorption and the low density of the gas above and below the disc of star-forming galaxies. This phase of the ISM is gener-ally referred to as extraplanar Diffuse Ionised Gas (DIG). DIG is warm (104K), low density (10−1cm−3) ionised gas
with low ionisation parameter, which is known to surround the plane of the Milky Way and other spiral galaxies. Its ionisation state is generally compatible with the ionising flux from stellar sources (O and B stars, but possibly also hot evolved stars), hardened by photoelectric absorption (Hoopes & Walterbos 2003; Rossa & Dettmar 2003; Oey et al. 2007; Haffner et al. 2009; Blanc et al. 2009; Flores-Fajardo et al. 2011). Extensive work on edge-on galaxies (with NGC 891 as a prototypical case, see for example Rand, Kulkarni & Hester 1990; Rossa et al. 2004; Bregman et al. 2013) has shown that DIG emission is detectable up to sev-eral kpc from the disc and that DIG contains also dust and metal enriched material.
An extra source of confusion, specific to the [NII] BPT (but absent in the [SII] BPT), is the role of what is often called the ‘Composite’ region, lying between the K03 and K01 lines. There is no physical reason to associate this re-gion with ionisation from a mixture of AGN and SF, since
-1.5 -1.0 -0.5 0.0 0.5 1.0 log ([NII] 6583 / H ) -1.5
-1.0 -0.5 0.0 0.5 1.0 1.5 2.0
log ([OIII]
5007 / H
)
SF Inter Sy
-10 -5 0 5 10 [arcsec] -10
-5 0 5 10
[arcsec]
PSF
-1.5 -1.0 -0.5 0.0 0.5 1.0 log ([SII] 6717,31 / H ) -1.5
-1.0 -0.5 0.0 0.5 1.0 1.5 2.0
log ([OIII]
5007 / H
)
SF
Sy
LINER
-10 -5 0 5 10 [arcsec] -10
-5 0 5 10
[arcsec]
[image:7.612.304.534.92.317.2]PSF
Figure 3.The ionised gas properties in P11-61A. The top panels show the BPT diagnostic diagrams using canonical strong line ratios and the demarcation lines of Kauffmann 2003 (solid line in the [NII] BPT diagram) and Kewley 2006 (dashed line in the [NII] BPT diagram), as described in the text. Points in the BPT diagrams correspond to individual Voronoi bins within the galaxy (97 in total in this galaxy) and are colour-coded depending on their position in the diagram. The open circle shows the line ratios extracted from the Sloan 300fibre (using the MPA-JHU emission line fluxes). The coloured error bars show the median error in the different areas of the BPT diagram (the colour reflects the area it corresponds to). The bottom panels show, with the same colour-coding, the position of these regions on the sky. The black hexagon shows the coverage of the P-MaNGA fibre bundle, while the black circle shows the position of the Sloan 300 fibre. The P-MaNGA PSF is represented in the bottom right corner.
both purely SF and bone-fide Seyfert ionised regions can be found there. It has also been suggested that an increase in the nitrogen abundance due to population ageing can shift Hiiregions into this intermediate region (Kennicutt, Keel & Blaha 1989; Ho, Filippenko & Sargent 1997b; S´anchez et al. 2014a). However, it is found observationally that the dis-tance from the star-forming sequence along the right wing of the BPT diagram is an empirically well-motivated param-eter, which correlates with other galactic properties (Stasin-ska et al. 2006; Kewley & Ellison 2008). We therefore decided to keep the so-called ‘Composite’ class as a rough proxy for sources in the right-wing characterised by small distance from the SF sequence. We will, however, not call objects in this class ‘Composite’ but rather ‘Intermediate’, since we will be using the term ‘Composite’ for sources where we re-solve both SF and Seyfert/LINER-like emission in different regions within the same galaxy.
4.2 Resolved Ionisation Diagnostics: the P-MaNGA Perspective
In this work we present results based on the classical BPT diagrams using the line ratios [OIII]/Hβ vs [NII]/Hα and
[SII]/Hα. We do not use the [OI]λ6300 line since it is weaker than the other lines and it would require a coarser binning to be detected above the noise level. We discard regions where either Hβor [OIII]λ5007 are not detected to 3σ. We do not correct the line fluxes for extinction when calculating line ratios in the BPT diagram, since the line ratios considered are nearly unaffected by the extinction correction due to their proximity in wavelength space.
Overall, our sample spans a wide variety of ionisation conditions. Seven galaxies are entirely dominated by star formation. P11-61A is the only galaxy in which we confirm the SDSS Seyfert classification. In three galaxies we detect extended LINER-like ionisation, traced by both diagnostic diagrams, extending out to 0.5-1 Re. Finally, three galaxies
have a peculiar ionisation structure and we classify them as ‘Composite’, since they present both LINER-like line ratios and SF-dominated regions, but the spatial distribution of the ionisation is more varied. We summarise the differences between the Sloan single fibre classification and the resolved P-MaNGA analysis in Table 3.
In the Appendix we show BPT diagrams and maps of the ionisation conditions as derived from the BPT diagrams for all the galaxies, together with line ratio maps ([NII]/Hα and [OIII]λ5007).
4.2.1 Resolved Seyfert-like Ionisation in a Star Forming Disc
In Fig. 3 we show the [NII] and [SII] BPT diagrams for galaxy P11-61A. Points in the BPT diagram correspond to individual Voronoi bins (and are colour-coded according to the demarcation lines shown). The open circle corresponds to the line ratios obtained from the Sloan 300diameter fibre (emission line fluxes from the MPA-JHU DR7 catalogue, based on Brinchmann et al. 2004; Kauffmann et al. 2003a2).
We note that in both the [NII] and [SII] BPT diagrams the galaxy is classified as a Seyfert using the Sloan spectra.
Immediately below each BPT diagram we show how re-gions with different ionisation conditions, according to the BPT diagrams, are spatially distributed in the galaxy, by us-ing the same colour-codus-ing. The black hexagon corresponds to the size on the sky of the P-MaNGA bundle.
In the [NII] BPT we observe Seyfert-like ionisation (red) in the central regions, with a gradual transition to star-forming environments (blue) as we move further out into the disc. There is also evidence for LINER-like line ratios (orange), mostly in the transition region between Seyfert-dominated and SF-Seyfert-dominated regions. If we assume that ionisation is due mainly to a point source in the centre, then the observed Seyfert → LINER transition could be explained in terms of a decrease in the ionisation param-eter because of geometrical dilution of the ionising radiation (fion∝r−2) and/or hardening of the photoionising radiation
caused by photo-electric absorption. We also recall that, de-spite the fact that the ionising radiation of a nuclear source decreases as fion ∝r−2, the line emissivity of the resulting
nebular line can easily depart from the r−2 profile because
[image:8.612.305.540.122.386.2]2 The MPA-JHU catalogue is accessible at http://www.mpa-garching.mpg.de/SDSS/DR7/
Table 3.Properties of the ionised gas in our galaxy sample, using Sloan spectroscopy and P-MaNGA data.
Galaxy Sloan class P-MaNGA P-MaNGA (nucleus) (disc/outskirts) SF-dominated galaxies
P9-127B SF SF SF
P9-19E SF SF SF
P11-127B SF SF SF
P11-19B SF SF SF
P11-19C SF/Int SF /Int SF/Int
P4-61A SF SF SF (Int?)
P4-19A SF SF SF
Seyfert galaxy
P11-61A Sy Sy/LINER SF
LINER-like galaxies
P9-127A Sy LINER SF
P4-127A LINER LINER (some SF)
P4-127B Sy LINER SF
Composites
P9-61A SF SF LINER
P11-127A SF SF/LINER SF
P4-19B SF SF LINER
Notes: The classification is performed using the [SII] and [NII] BPT diagrams. SF=star forming, Sy=Seyfert-like, Int=Intermediate (between the K01 and K03 lines in the [NII] BPT). Where the Sloan classification from both diagram is am-biguous (e.g. SF in [NII] BPT and Sy in [SII] BPT) the field is left blank.
of the clumpy gas density distribution, changes in the cover-ing factor, self shadcover-ing and projection effects. We therefore wish to stress that within individual objects there is no rea-son to interpret the Seyfert/LINER demarcation as a clear-cut distinction between different ionisation mechanisms.The Seyfert/LINER demarcation line is an intrinsically porous demarcation.
Overall, this observation shows the potential of MaNGA in spatially resolving star formation from the AGN-dominated nuclear regions in active galaxies, opening up new possibilities to study AGN host galaxies and their star formation properties.
4.2.2 Extended Central LINER-like Ionisation
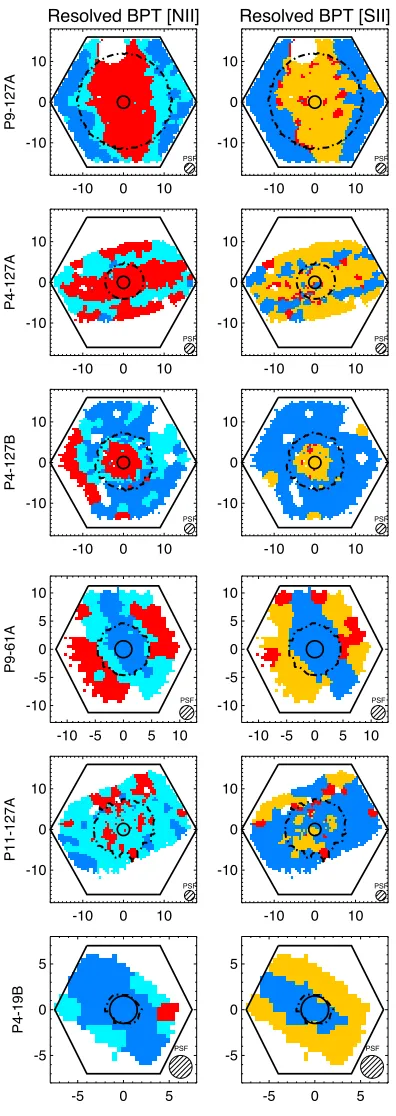
Three galaxies in our sample (P9-127A, P4-127A, P4-127B) show extended central LINER-like ionisation. Sloan single fibre fluxes (from the MPA-JHU catalogue) classify two of these galaxies as Seyfert-like, while P4-127A has an ambigu-ous classification. However, considering the errors associated with the emission line ratios (and the intrinsic porosity of the LINER-Seyfert demarcation line), the Sloan line ratios are also consistent with a LINER-like classification.
We show the BPT-derived maps of these galaxies using P-MaNGA data in Fig. 4 (top three galaxies, with the same colour-coding of regions as in Fig. 3). Both in P9-127A and P4-127B the LINER-like ionisation dominates within 0.5 Re,
while in the case of P4-127A, the LINER-like ionisation
Resolved BPT [NII]
-10 0 10
-10 0 10
P9-127A
PSF
Resolved BPT [SII]
-10 0 10
-10 0 10
PSF
-10 0 10
-10 0 10
P4-127A
PSF
-10 0 10
-10 0 10
PSF
-10 0 10
-10 0 10
P4-127B
PSF
-10 0 10
-10 0 10
PSF
-10 -5 0 5 10 -10
-5 0 5 10
P9-61A
PSF
-10 -5 0 5 10 -10
-5 0 5 10
PSF
-10 0 10
-10 0 10
P11-127A
PSF
-10 0 10
-10 0 10
PSF
-5 0 5
-5 0 5
P4-19B
PSF
-5 0 5
-5 0 5
[image:9.612.67.265.83.641.2]PSF
Figure 4.BPT classification of P-MaNGA galaxies (purely SF galaxies are not shown). The colour-coding reflects the position of each region in the [NII] (left) and [SII] (right) BPT diagrams. The colour-coding is the same as in Fig. 3. In the [NII] BPT blue corresponds to SF regions, cyan to intermediate and red to Seyfert/LINER-like. In the [SII] BPT blue corresponds to SF, or-ange to LINER-like and red to Seyfert-like. The dot-dashed black contour encloses all the bins with a galactocentric distance smaller than 0.5Re. The black hexagon corresponds to the P-MaNGA IFU, while the black open circle corresponds to the position and size of the Sloan 300 fibre. The PSF of the P-MaNGA data is represented in the bottom right corner. The spatial scale on the maps is in arcsec.
tends from the central regions out to galactocentric distances larger than 1.0 Re. Interestingly, all three LINER-like
galax-ies are massive disc galaxgalax-ies, (logM?/M>10, masses from MPA-JHU DR7 catalogue), and host active star formation in regions at large galactocentric radii. We will argue in sub-sequent Sections that, although contribution from an AGN to the ionisation budget cannot be ruled out, the most likely source of the observed LINER-like ionisation is hot evolved stars.
These conclusions confirm recent work from the CAL-IFA collaboration (Singh et al. 2013; Papaderos et al. 2013) on extended LINER-like emission. However, only full MaNGA sample will be able to study extended LINER emis-sion in statistical sense, and observe correlations between the extended LINER-like emission and other galactic properties. This study may potentially have a large impact on the local census of AGNs.
4.2.3 Extraplanar LINER-like Ionisation
Galaxies P9-61A and P4-19B (see Fig. 4) present peculiar ionisation conditions, as traced by the BPT diagrams, dis-playing a star formation dominated (highly inclined) disc and LINER-like ionisation in the extraplanar direction. We suggest these line ratios can be interpreted as signature of diffuse ionised gas (DIG, i.e. gas ionised by stellar radiation, likely from O and B stars in the disc), which dominates the ionised gas budget in extraplanar regions of low continuum emission. This observation shows that using MaNGA data for highly inclined/edge on galaxies we might be able to shed new light on the disc-halo interaction.
We see no signature of kinematic distortion or increase in velocity dispersion in these regions in either P9-61A or P4-19B, at least within the relatively large errors associated with emission line fitting in these regions of low S/N. This argues against the identification of the LINER-like emission in the outer regions with shocked outflowing (or inflowing) gas. However a more detailed analysis, exploiting the emis-sion lines detailed profile shapes (as in Ho et al. 2014), might be needed to detect outflow signatures and will be presented in future work.
4.3 Comparison of the Ionised Gas Properties with Stellar Population Indices
In this section we will focus on the study of Dn(4000),
EW(HδA) and the EW(Hα) to gain insight into the nature
of the underlying stellar population and the interplay be-tween the gas ionisation and the continuum emission. We refer to Li et al. (submitted) for a more detailed analysis of these indices and a study of their radial gradients in the P-MaNGA galaxies.
Dn(4000) (the so called ‘4000 ˚A’ break), calculated here
using the definition given by Balogh et al. (1999), is a proxy of recent star formation. For an instantaneous burst of star formation the Dn(4000) index increases monotonically with
the age of the stellar population, and is roughly independent of metallicity until about 1-2 Gyr after the burst. The equiv-alent width of HδA(defined by Worthey & Ottaviani 1997),
on the other hand, increases until about 300-400 Myr af-ter the burst (post-starburst population) and then decreases
Figure 5.[NII] (left) and [SII] (right) BPT diagnostic diagrams colour-coded by Dn(4000) (top), EW(HδA) (middle) and log EW(Hα) (bottom). Each points corresponds to a Voronoi bin in one of the 14 galaxies considered. Note that, since single spaxels oversample the PSF, not all data points are statistically independent.
again at later times (Kauffmann et al. 2003a; Gonz´alez Del-gado et al. 2005). At intermediate ages, both indices are known to depend both on the age and the metallicity of the stellar population (Thomas, Maraston & Korn 2004; Korn, Maraston & Thomas 2005; Thomas & Davies 2006). Both Dn(4000) and HδA are computed on the spectra after
sub-tracting the emission lines. The equivalent width (EW) of Hαis computed by dividing the Hα flux by an interpola-tion of the underlying continuum, which is calculated as the average of the median fluxes in two bandpasses 200 km s−1 wide, at a distance of 200 km s−1from the centre of the line
(the model continuum is used). Here we choose a
conven-tion where the EW of the emission line is defined as positive when the line is in emission.
The EW(Hα) is a measure of the amount of ionising photons absorbed by the gas relative to the stellar mass. Cid Fernandes et al. (2011) used stellar population models com-bined with data from SDSS to argue that EW(Hα) can be used to distinguish ionisation from hot evolved stars (charac-terised by EW(Hα)<3˚A) from other ionisation mechanisms (namely ionisation due to star formation or AGN activity, generally characterised by EW(Hα)>3˚A). DIG ionised by escaping UV photons from the disc is also expected to show low EW(Hα), as ionising photons can be coming from as
SF
0.5 1.0 1.5 2.0 DN(4000) 0
500 1000 1500 2000
N of bins
Intermediate
0.5 1.0 1.5 2.0 DN(4000) 0
500 1000 1500
Sy/LINER
0.5 1.0 1.5 2.0 DN(4000) 0
200 400 600 800
−4−2 0 2 4 6 8 EW(HA) 0
500 1000 1500 2000
N of bins
−4−2 0 2 4 6 8 EW(HA) 0
200 400 600 800 1000
−4−2 0 2 4 6 8 EW(HA) 0
200 400 600 800
−1 0 1 2 3
log EW(H ) 0
500 1000 1500
N of bins
−1 0 1 2 3
log EW(H ) 0
500 1000 1500 2000
−1 0 1 2 3
log EW(H ) 0
[image:11.612.41.283.87.348.2]200 400 600 800 1000 1200
Figure 6.Histograms of the distribution of Dn(4000), EW(HδA) and Log EW(Hα) for spaxels in different areas of the [NII] BPT diagram.
far as one kpc away and DIG is only present in regions of continuum emission.
In Fig. 5 we present the [NII] and the [SII] BPT dia-grams for all the sub-galactic regions in the galaxies in our sample (that meet the S/N cuts applied above) colour-coded by Dn(4000), EW(HδA) and EW(Hα). Note that, since
sin-gle spaxels oversample the PSF, not all data points shown are statistically independent.
We observe that within our sample there exists a strong correlation between the position in the BPT diagram and the indices considered. Regions classified as star-forming generally have low Dn(4000) (1.2 < Dn(4000) < 1.4) and
large EW(HδA) (peaking between 4 and 5): this is the
ex-pected signature of young stellar populations and it confirms that the BPT diagram correctly isolates regions of ongoing star formation, although at the typical distance of a MaNGA galaxy we are not able to resolve individual Hiiregions. The scatter observed in these indices is most likely due to the effect of varying metallicity. We refer to Wilkinson et al. (submitted) for a more in-depth discussion of the relation between age, metallicity and stellar population indices for the P-MaNGA galaxies.
As regions move away from the star-forming sequence towards the AGN locus in the BPT diagram, they are char-acterised by a gradual increase in Dn(4000) and a parallel
reduction in EW(HδA). This trend is tracing an increase
in the age (and possibly metallicity) of the underlying stel-lar population. The same effect is already well documented using SDSS data (Kauffmann et al. 2003a; Kewley et al. 2006). This result is consistent with the analysis performed in S´anchez et al. (2014b) using the largest sample of Hii regions to date extracted from the CALIFA survey. How-ever a statistical study of the resolved ionised gas properties
of LINER and Seyfert galaxies is still missing, and would be particularly interesting in the context of understanding how and where galactic regions stop forming stars. We also note that in regions ionised by a Seyfert/LINER-like ion-isation field we consistently observe both a high Dn(4000)
and a small EW(HδA), indicating that these regions have
not been ‘quenched’ recently (within the last few 100 Myr): we are not observing the result of rapid cessation of star formation.
The analysis of the EW(Hα) reveals that, as expected, regions classified as star-forming present large EWs. In par-ticular 99% of the regions classified as SF in the [SII] BPT have EW(Hα) > 3˚A, which is the delimiter proposed by Cid Fernandes et al. (2011) to classify regions as dominated by ionisation from young stars. This further confirms that, within the limitation of the considered diagnostics and the uncertainties in the extraction of line fluxes and EWs, we do not expect any significant contamination from other ion-isation sources in regions that we define as SF. Of course the reverse statement is not necessarily true: contamination from SF regions could be present in regions classified as right wing (Seyfert/LINER-like) sources based on the [SII] BPT diagram.
Figure 6 summarises the above discussion by showing histograms of the distribution of Dn(4000), EW(HδA) and
Log EW(Hα) for spaxels in different areas of the [NII] BPT diagram.
4.4 The WHAN Diagram: a Complementary
Diagnostic
The comparison of the EW(Hα) with the [NII]/Hαcan help us gain insight into the nature of the observed extended LINER ionisation. To this aim we tested the ‘WHAN’ dia-gram (Cid Fernandes et al. 2010, 2011) on the P-MaNGA galaxies. For consistency with our previous classification, which makes use of the Kewley 2001 demarcation lines, we used the best transposition of the Kewley 2001, as presented in Cid Fernandes et al. (2010). We show an example of this classification for P9-127A in Fig. 7. In detail, we classify regions as follows:
(i) ionisation due to old hot stars or DIG, if EW(Hα)< 3˚A (green in Fig. 8).
(ii) AGN if EW(Hα)>3˚A and [NII]/Hα >−0.1 (red in Fig. 8).
(iii) SF, if EW(Hα)>6˚A and [NII]/Hα >−0.1 (blue in Fig. 8).
We show the results of this classification for the galax-ies classified as Seyfert and LINER-like in Fig. 8, together with the maps of log EW(Hα) for the same galaxies. We note that using this revised classification the nuclear regions of P9-127A, P11-61A, P4-127A and P4-127B are all classified as dominated by hot evolved stars, with no AGN signature. Interestingly the external regions of P9-61A, which are clas-sified as LINER-like in the classical BPT diagram, present low EW(Hα) and are consistent with our preferred interpre-tation of extraplanar DIG.
Echoing the remark in Cid Fernandes et al. (2011) we note that AGN might still be present in the nuclei of other galaxies (especially in P9-127A, which shows an increase in
Figure 7. Example of a resolved WHAN diagram (as defined by Cid Fernandes et al. 2011) for the galaxy P9-127A and the distribution of the sky of the various regions with the same colour-coding. This diagram classifies the nuclear regions of this galaxy as dominated by hot evolved stars.
log EW(H )
-10 0 10
-10 0 10
-0.5 0.0 0.5 1.0 1.5
PSF
Resolved WHAN
-10 0 10
-10 0 10
P9-127A
PSF
-10 -5 0 5 10 -10
-5 0 5 10
0.2 0.4 0.6 0.8
PSF
-10 -5 0 5 10 -10
-5 0 5 10
P11-61A
PSF
-10 0 10
-10 0 10
-0.6 -0.4 -0.2 0.0 0.2 0.4 0.6 0.8
PSF
-10 0 10
-10 0 10
P4-127A
PSF
-10 0 10
-10 0 10
-0.2 0.0 0.2 0.4 0.6 0.8 1.0 1.2
PSF
-10 0 10
-10 0 10
P4-127B
PSF
-10 -5 0 5 10 -10
-5 0 5 10
0.0 0.5 1.0 1.5
PSF
-10 -5 0 5 10 -10
-5 0 5 10
P9-61A
[image:12.612.309.548.91.178.2]PSF
Figure 8. Left panels: Classification scheme for the P-MaNGA galaxies that show evidence for old hot stars/DIG ionisation using the ‘WHAN’ diagram (Cid Fernandes et al. 2010). Green regions are associated with hot evolved stars (or DIG), blue regions with SF and red regions with AGN. See text for details. Right Panels: Maps of log EW(Hα) for the same sources.
SF
0.5 1.0 1.5 2.0 [SII] 6731 / [SII] 6716 0
500 1000 1500 2000
N of bins
Intermediate
0.5 1.0 1.5 2.0 [SII] 6731 / [SII] 6716 0
200 400 600 800
Sy/LINER
0.5 1.0 1.5 2.0 [SII] 6731 / [SII] 6716 0
100 200 300
Figure 9.Histograms of the distribution of the [SII] doublet flux ratio [SII]λ6731/[SII]λ6717 for spaxels in different areas of the [NII] BPT diagram.
EW(Hα) in the nuclear regions, and P11-61A, which is clas-sified as AGN using the classical BPT diagram), but, accord-ing to this classification scheme, the AGN does not consti-tute the major contribution to the ionising photon flux. It is clear, however, that more detailed photoionisation mod-els, taking into account the information provided by stellar population modelling, is required in order to derive a self-consistent test of the photon budget. This analysis will be presented in future work from the MaNGA collaboration.
4.5 Electron Density and Ionisation Parameter
The flux ratio of the [SII]λλ6717,6731 doublet is sensi-tive to the gas electron density. More specifically the ratio [SII]λ6731/[SII]λ6717 is expected to vary from ∼0.65, for ne∼102 cm−3 to∼2.5, for ne∼104cm−3.
In the Appendix we show the maps of the [SII] doublet flux ratio for each galaxy. Although the doublet flux ratio can be converted into electron density, we prefer to show the measured flux ratio, since the conversion to electron density is non-linear and it saturates close to the boundaries, an effect which is difficult to illustrate graphically in the maps. Fig. 9 shows how the gas densities, as traced by the [SII] doublet, change in the various galactic regions, depending on the location on the BPT diagram. Quite interestingly, galac-tic regions located in the SF locus in the BPT diagrams are characterised by a relatively uniform and narrow range of [SII] ratio - between∼0.60 (which is about the lower limit, the value at which the ratio saturates) and∼0.85, imply-ing densities below∼300 cm−3. The intermediate region is characterised by a larger scatter, while the Seyfert/LINER-like regions are found to have a very broad distribution of densities, ranging from low values of < 100 cm−3 out to
>104 cm−3.
We also investigate the spatial distribution of the extinction-corrected line ratio [OIII]λ5007/[OII]λλ3726,29. This ratio is a good proxy for the ionisation parameter (U), defined as U = Fi
nec (where Fi is the flux of
ion-ising photons directed onto the gas clouds with electron density ne) in classical Hii regions. In regions dominated by other sources of ionisation the [OIII]/[OII] line ratio is also influenced by the hardness of the radiation field. For SF-regions we can relate the ionisation parameter to the [OIII]/[OII] ratio using the formula provided by Diaz et al. (2000), log U =−0.80 log[OIII][OII] −3.02.
For some of the galaxies that present nuclear Seyfert/LINER-like emission the [OIII]/[OII] ratio peaks in
[image:12.612.45.282.280.720.2]Figure 10.Logarithmic plot of the extinction-corrected line ra-tio [OIII]λ5007/[OII]λλ3726,29 versus the ratio of extinction-corrected Hαflux divided by the electron density, as derived from the sulphur doublet flux ratio ([SII]λ6731/[SII]λ6717). Each point corresponds to a region (Voronoi bin) in one of the galaxies in the P-MaNGA sample and is colour-coded depending on its clas-sification in the [NII] BPT diagram, with blue corresponding to SF-dominated regions, cyan to intermediate regions and red to Seyfert/LINER-like regions. The alternative y-axis on the right shows the value of log U corresponding to each [OIII]/[OII] ratio for Hiiregions (valid only for the SF regions).
the nuclear region (P9-127A, P4-127A, P11-61A). For the star forming galaxies, the ionisation parameter has a broader range of distributions, often not peaking in the central re-gion and offset with respect to the Hαemission, suggesting that gas density variation might play a significant role in the distribution of the ionisation parameter.
We have tried to quantify these effects by investigat-ing in more detail the relation between ionisation parame-ter, extinction-corrected Hαsurface density (ΣHα) and gas
density. Assuming the geometry of Hiiregions (and in par-ticular the distribution of gas around young stars) to be similar on average, then the Hαluminosity (LHα) should be
proportional to the local luminosity in ionising photons (Q): LHα∝cfQ, where cfis the photoionised clouds covering
fac-tor (this facfac-tor would take into account the possible effect of dust inside the Hii region absorbing ionising photons). If we assume that Hii regions are generally unresolved at the MaNGA pixel scale (the size of a pixel corresponds to around 250 pc at the median redshift), then, denoting the pixel size in physical units as p and the Hiiregion size as r we have
U∝ΣHα cfne
p2 r2
We therefore expect a correlation between U and ΣHα, with scatter induced by changes in covering factor. The rela-tion will also depend on distance (i.e. redshift) as, at higher redshift, as the size of one pixel in kpc (p) increases with redshift. The redshift dependance is lost in the limit where Hiiregions are resolved out by the MaNGA pixel scale.
Fig. 10 shows, for the various regions in the different galaxies, the value of [OIII]/[OII] as a function of the ratio ΣHα/ne. The various points are colour-coded according to
their location on the [NII] BPT diagram as in Fig. 3. The star forming (blue) and intermediate regions (cyan) show a large scatter, but they tend to correlate with ΣHα/ne. The
observed correlation is strongly sublinear, pointing towards systematic changes in covering factor with ionisation pa-rameter. We have also tested for the presence of a redshift dependance, but have found no evidence for it within our current sample. The issue will be revisited with a sample covering a larger redshift range.
Interestingly a large fraction of Seyfert/LINER-like re-gions are located well above the SF sequence, inhabiting predominately the top left part of the plot. We suggest two possible reasons responsible for this effect:
(i) The covering factor of the ionised clouds is generally lower than in typical Hii regions, thus moving the Seyfert nuclei towards the left in Fig. 10.
(ii) The ionising radiation of the AGN/hot stars is harder than the radiation ionising Hii regions. This produces a boost in the fraction of O3+ relative to O2+, boosting the [OIII]/[OII] ratio.
This result highlights that the [OIII]/[OII] line ratio can be successfully used to trace different ionisation conditions in the hot gas. In accordance with previous studies (e.g. Cid Fernandes et al. 2011) we suggest that this ratio might be a powerful probe of the dominant source of ionisation, complementary to the BPT diagram.
5 METALLICITY AND CHEMICAL
ABUNDANCES
In this Section we study the relation between the spatially resolved metallicity and star formation rate surface density, as well as the distribution of the nitrogen-to-oxygen abun-dance ratio.
Gas phase metallicity (oxygen abundance) can be esti-mated from collisionally excited lines making use of ratios of nebular to auroral lines to estimate the electron tempera-ture. This method (referred to as the Teor ‘direct’ method)
for calculating metallicity is generally considered the most reliable in the low metallicity regime (Pagel et al. 1992; Gar-nett 1992; Izotov et al. 2006). At higher metallicities, how-ever, the electron temperature decreases and auroral lines are generally undetected.
To overcome this limitation over the years a number of metallicity calibrators have been developed to estimate the oxygen abundance from ratios of strong nebular lines (in-cluding amongst others [OIII]λλ4959,5007, [OII]λλ3726,29, [NII]λ6584, [SII]λλ6717,31), suitable to be used in the high metallicity regime. These metallicity diagnostics are gen-erally calibrated against ‘direct’ metallicity measurements (Pettini & Pagel 2004; Pilyugin & Thuan 2005; Pilyugin, V´ılchez & Thuan 2010), photoionisation models (Denicolo, Terlevich & Terlevich 2002; Kobulnicky & Kewley 2004; Tremonti et al. 2004), or a mixture of both (Nagao, Maiolino & Marconi 2006; Maiolino et al. 2008; Perez-Montero 2014). It is well known that theTe-based calibrations generally yield a lower value of metallicity compared to the calibra-tions based on photoionisation models. The reasons for these discrepancies are still debated and thoroughly discussed in
the literature, where they are attributed to uncertainties as-sociated with the models, temperature fluctuations within Hii regions, deviations from the thermal Maxwellian dis-tribution in electron plasma, different assumptions regard-ing oxygen depletion onto dust grains and other effects (e.g. Stasinska 2005; Kewley & Ellison 2008; Pilyugin, V´ılchez & Thuan 2010; Rosales-Ortega et al. 2011; Binette et al. 2012; L´opez-S´anchez et al. 2012; Dopita et al. 2013; Nicholls et al. 2013; Perez-Montero 2014).
In this work we are mainly interested in the scaling relations between metallicity and other galactic properties, hence the absolute value of the metallicity scale is not a major concern. However, given the possible systematics in-troduced by the choice of a particular metallicity calibrator, we will explore the effect that the choice of calibrator has on the observed trends. In the following section all line fluxes are considered to be extinction corrected using the proce-dure outlined in Section 3.
To explore the parameter space of available calibrations in this work we will focus on three of them:
(i) The calibration presented in Maiolino et al. (2008) (M08), based on a combination of the Kewley & Dopita (2002) photoionisation models at high metallicities and a match to the direct metallicity measurements (usingTe) at low metallicities. Of the various strong line diagnostics pre-sented in that work we use the one based on R23, defined as R23 = ([OII]λλ3726,29 + [OIII]λ4959 + [OIII]λ5007)/Hβ. This calibration gives results very similar to the widely used fit to R23 presented in Tremonti et al. (2004).
(ii) The calibration of O3N2 = [OIII]/[NII] presented in Marino et al. (2013), based on a fit toTe-derived metallic-ities. This calibration yields similar results to the one pro-posed by Pettini & Pagel (2004).
(iii) The so-called ‘ONS’ calibration of Pilyugin, V´ılchez & Thuan (2010) (P10), which makes use of the [OII], [OIII], [NII] and [SII] lines to calculate the oxygen abundance based on best fit to a set of calibrating Hii regions with ‘direct’ metallicity measurements.
All the metallicity calibrators above have been derived for classical Hiiregions. We compute metallicity only on the spaxels that are classified as star forming regions using the K01 line in the [SII] BPT diagram. We choose to use this diagram rather than the [NII] BPT to avoid introducing any prior into our study of the N/O ratio in the subsequent section. In Section 4.3 we found that only 1% of the regions classified as SF in the [SII] BPT diagram have EW(Hα)< 3˚A, which is consistent with no significant contamination from ionisation due to hot evolved stars/diffuse ionised gas within the limits of the errors on the BPT line ratios.
For the same set of spaxels, the star formation rate surface density (ΣSFR) is calculated from the
extinction-corrected Hα surface brightness using the conversion pre-sented in Kennicutt (1998).
ΣSFR[Myr−1kpc−2] = 7.9·10−42ΣHα[erg s−1 kpc−2]
We note that ΣSFRmight be influenced by the imperfect
flux calibration of the P-MaNGA data. We consider ΣSFR
to be uncertain to the 0.1 dex level.
5.1 The Relation between Metallicity and Star Formation Rate Surface Density
In this Section we investigate the relation between spatially resolved metallicity and star formation rate surface density (ΣSFR). Previous studies of integrated galactic properties
have revealed, in addition to the well known mass-metallicity relation (Lequeux et al. 1979; Tremonti et al. 2004), a sec-ondary relationship between gas metallicity and star for-mation rate (Mannucci et al. 2010; Lara-L´opez et al. 2010; Yates, Kauffmann & Guo 2012; Andrews & Martini 2013). This three-dimensional relation has been dubbed the ‘Fun-damental Metallicity Relation’ (FMR). The secondary rela-tion of metallicity on SFR may be resulting from a more fundamental relation between metallicity and gas content (Moran et al. 2012; Bothwell et al. 2013; Hughes et al. 2013) and may be partially understood in terms of an equilibrium between gas inflows, outflows and star formation (Mannucci et al. 2010; Dav´e, Finlator & Oppenheimer 2011; Dayal, Fer-rara & Dunlop 2013). The extension of the relation to high redshift has been recently subject to some debate (Zahid et al. 2014; Wuyts et al. 2014; Steidel et al. 2014; Williams et al. 2014; Troncoso et al. 2014; Cullen et al. 2014).
The extension to spatially resolved scales is even more unclear. Spatially resolved observations of some star form-ing galaxies at high redshift (Cresci et al. 2010; Troncoso et al. 2014) and blue compact dwarfs in the local universe (Werk et al. 2010; S´anchez Almeida et al. 2014) have found an anti-correlation between SFR surface density and metal-licity. This finding has been interpreted as tracing the effect of localised metal poor inflows in diluting the metallicity and boosting the SFR. In the larger galaxy population, on the other hand, it is well known that both SFR and metallic-ity have negative gradients (Vila-Costas & Edmunds 1992; Bigiel et al. 2008; Leroy et al. 2008; S´anchez et al. 2013; Pi-lyugin, Grebel & Kniazev 2014; S´anchez et al. 2013), thus generating a global positive correlation between these two quantities on resolved scales. A systematic study of the rela-tion between resolved metallicity and ΣSFRwould help shed
more light on the plausibility of the inflow scenario for the wider galaxy population. Current and future IFS surveys are ideally placed for carrying out this work.
Using P-MaNGA data we make a preliminary study of the relation between metallicity and ΣSFR. For each galaxy
we plot ΣSFR against the gas phase metallicity, using the
three metallicity calibrations introduced in Sec. 5, and cal-culate the Spearman correlation coefficients between the two quantities. We show the results in Fig. 11.
Using the M08 and P10 metallicity calibrators, 12 of the 14 galaxies in our sample show a positive correlation between metallicity and ΣSFR. This can be understood as a
consequence of the fact that both metallicity and ΣSFR
gen-erally present a negative radial gradient. Within our sam-ple the only exception is P9-127A, where both the metallic-ity and ΣSFR gradient are positive between 0.4 and 0.7 Re
(the largest radius sampled by the P-MaNGA observations). This is not completely surprising if we consider that for this galaxy we have limited radial sampling (in terms ofRe), but better resolution, in terms of kpc, than the MaNGA survey data. Moreover we have checked that, taking advantage of the CALIFA IFS data, a negative metallicity gradient is ob-served in P9-127A at larger radii.
Figure 11.Top Panels: Star formation rate surface density (ΣSFR) plotted against gas phase metallicity (12 + log(O/H)) using different calibrators: M08 is the Maiolino et al. (2008) R23-based calibrator, O3N2 from Marino et al. (2013) and P10 ONS from Pilyugin, V´ılchez & Thuan (2010). Each point is colour-coded by the galaxy it belongs to. Regions that are not compatible with photoionisation by SF according to the [SII] BPT diagram are discarded. Bottom Panels: The Spearmanρrank correlation coefficients between metallicity and ΣSFRas a function of the total stellar mass of the P-MaNGA galaxies.
In Fig. 11, bottom panel, we show the Spearman corre-lation coefficients between metallicity and ΣSFR as a
func-tion of the total stellar mass of the galaxy. We observe that the positive correlation between the two quantities is stronger at lower masses (log(M?/M) < 10.5), while at high stellar masses our data does not allow to pose any con-strains on the presence of a correlation.
The fact that the trends discussed above are less evi-dent or even absent using the O3N2 calibrator might be due to that fact that this calibrator is sensitive to changes in the N/O ratio, which are expected to occur on longer timescales than oxygen enrichment. However, the well known indi-rect correlation between metallicity and ionisation param-eter (Perez-Montero 2014), which is assumed in the adopted strong-line calibrations, might also be playing a role in shap-ing the observed relation.
It is worth commenting here on the galaxy with the highest SFR in our sample: P11-19C (light green in Fig. 11, SFR ∼ 12 M yr−1). Most of the bins in this galaxy are classified as intermediate using the [NII] BPT, while in the [SII] BPT it lies safely inside the SF sequence. Its median EW(Hα) is ∼ 102 (in fact these points are clearly visible in the [NII] BPT colour coded by EW(Hα) in Fig. 5 as the blue points just across the K03 line) corroborating our
conjecture that this system is experiencing a starburst. We suggest that the reason why this galaxy lies so much above the SF sequence in the [NII] BPT is related to its nitrogen enhancement, as will be discussed in the next section.
5.2 Metallicity and Nitrogen Abundance
Nitrogen and oxygen have different nucleosynthetic path-ways in galaxies. Elements like oxygen, carbon and sulphur have a primary nucleosynthetic origin, i.e. their produc-tion yield is approximately independent from the amount of heavy elements already present in the galaxy. Therefore, to first order, the sulphur abundance will be proportional to the oxygen abundance, making sulphur lines emission lines precious tracers for abundance studies.
The nitrogen enrichment, on the other hand, is very sen-sitive to the details of the history of chemical evolution of a galaxy. It is predicted that in the low-metallicity regime most of the nitrogen has a primary origin (i.e. yield inde-pendent of metallicity), being generated in massive stars. At higher metallicities nitrogen becomes a secondary nucleosyn-thetic product (i.e. the yield is proportional to the metal-licity), since production of nitrogen depends on the previ-ous amount of oxygen (and carbon) synthesised in stars,

![Figure 3. The ionised gas properties in P11-61A. The top panelsshow the BPT diagnostic diagrams using canonical strong lineratios and the demarcation lines of Kauffmann 2003 (solid linein the [NII] BPT diagram) and Kewley 2006 (dashed line in the[NII] BPT d](https://thumb-us.123doks.com/thumbv2/123dok_us/8925229.391149/7.612.304.534.92.317/properties-panelsshow-diagnostic-diagrams-canonical-lineratios-demarcation-kaumann.webp)

![Figure 5. [NII] (left) and [SII] (right) BPT diagnostic diagrams colour-coded by Dn(4000) (top), EW(HδA) (middle) and log EW(Hα)(bottom)](https://thumb-us.123doks.com/thumbv2/123dok_us/8925229.391149/10.612.122.456.95.552/figure-right-diagnostic-diagrams-colour-coded-hda-middle.webp)

![Figure 9. Histograms of the distribution of the [SII] doublet fluxratio [SII]λ6731/[SII]λ6717 for spaxels in different areas of the[NII] BPT diagram.](https://thumb-us.123doks.com/thumbv2/123dok_us/8925229.391149/12.612.44.287.64.212/figure-histograms-distribution-doublet-uxratio-spaxels-dierent-diagram.webp)
