Effect of Specimen Preparation Method on the
Stress-Strain Behavior of Sand in Plane-Strain
Compression Tests
Article in Geotechnical Testing Journal · July 2008 DOI: 10.1520/GTJ101307
CITATIONS
14
READS
121
2 authors:
Some of the authors of this publication are also working on these related projects:
”Precise system of the load capacity parameters identification of roadway structure in predicting the lifetime of road pavements”, partially supported by the Polish National Center for Research and Development No. 244286
View project
Changi reclamation and ground improvement project
View project
Dariusz WanatowskiUniversity of Leeds
126PUBLICATIONS 638CITATIONS
SEE PROFILE
Jian Chu
Nanyang Technological University
252PUBLICATIONS 2,855CITATIONS
SEE PROFILE
All content following this page was uploaded by Dariusz Wanatowski on 23 September 2014.
D. Wanatowski
1and J. Chu
2Effect of Specimen Preparation Method on the
Stress-Strain Behavior of Sand in Plane-Strain
Compression Tests
ABSTRACT:Experimental results are presented in this paper to study the effect of specimen preparation method on the stress-strain behavior of sand in plane-strain compression tests. The data obtained fromK0consolidation, drained, undrained and strain path tests conducted on medium loose
specimens prepared by the moist-tamping (MT) and the water sedimentation (WS) methods are compared. The test data show that the plane-strain compression behavior of medium loose sand underK0, drained and strain-path controlled (including undrained) conditions is affected by the
speci-men preparation method. UnderK0conditions, theK0values obtained from the MT specimens are generally lower than those obtained from the WS
specimens. Under drained conditions, more contractive behavior was observed for the MT sand. However, the failure stress ratio (or the failure friction angle) was not affected by the specimen preparation method. The data presented in this paper also illustrate that the compression behavior of medium loose sand in strain-path testing can be affected by the specimen preparation method. However, the differences in the stress-strain behavior will also depend on the strain increment ratio (dv/d1) imposed on the specimens. In general, different behaviors of the moist-tamped and water-deposited specimens reflect the influence of soil fabrics on the stress-strain behavior of sand.
KEYWORDS:sand, plane-strain, stress-strain behavior, sand fabric, pluviation, moist tamping
Introduction
Several preparation methods of granular soil specimens can be used in soil mechanics laboratories. Moist tamping (MT), water sedimentation (WS) (also known as water pluviation), and air plu-viation (AP) are among the most popular techniques. In the MT method, moist granular soil is deposited into a mold in a few layers and each layer is compacted using a small tamper. In the other two preparation methods (i.e., WS and AP), a granular material is poured into the mold, which is either empty (AP method) or par-tially filled with water (WS method). If necessary, the density of the specimens prepared by pluviation methods can also be increased by vibration or tamping.
It has long been recognized that different preparation methods result in different fabrics of granular soils and, consequently, in dif-ferent stress-strain characteristics of reconstituted specimens (Oda 1972a, 1972b; Ladd 1974, 1977; Mulilis et al. 1977; Silver et al. 1980; Miura and Toki 1982; Kuo and Frost 1996; Frost and Park 2003; Yamamuro and Wood 2004). Owing to this, a number of ex-perimental studies discussing the various effects of sample prepa-ration methods on the stress-strain behavior of granular soils have been reported in the past. However, the majority of experiments have been conducted under axisymmetric conditions using triaxial cells. Studies investigating the effects of different specimen prepa-ration methods on the stress-strain behavior of sand under more generalized stress conditions, such as plane-strain, are very rare
even though several field problems (e.g., slopes, embankments, or retaining walls) cannot be approximated to axisymmetric condi-tions. This is partially due to the fact that plane-strain devices are not commonly available and plane-strain tests are more compli-cated to conduct than triaxial tests. As a result, our understanding of the effects of specimen preparation methods on the stress-strain be-havior of soil under plane-strain conditions is still very limited.
The main objective of this paper is to study the effects of speci-men preparation methods on the stress-strain behavior of sand under plane-strain conditions. SeveralK0consolidated plane-strain compression tests conducted on medium loose sand under various drainage conditions were carried out. The results obtained from the plane-strain tests conducted on medium loose specimens prepared by the moist tamping and the water sedimentation methods are compared. The effects of specimen preparation methods on the measurement ofK0values and the stress-strain behavior of sand in
plane-strain tests are discussed.
Previous Studies
In the past, several investigators have studied the effect of specimen preparation methods on stress-strain behavior of granular soil. Among the first attempts to study the effects of the specimen prepa-ration methods on the behavior of reconstituted sand were those of Ladd (1974, 1977), who observed that the method of specimen preparation could have a significant effect on the cyclic shear strength of sand. Similar observations were made by Mulilis et al. (1977). They reported that different specimen preparation proce-dures significantly affected the liquefaction characteristics of sand in undrained stress-controlled cyclic triaxial tests. Mulilis et al. (1977) also observed that the MT specimens were more nonuni-form than the others. Therefore, in order to improve the uninonuni-formity of the MT specimens Ladd (1978) proposed an undercompaction procedure. In this method, the specimen is prepared using a number Manuscript received June 18, 2007; accepted for publication December 28,
2007; published online February 2008.
1
Lecturer, Nottingham Centre for Geomechanics, School of Civil Engineer-ing, The University of Nottingham, University Park, Nottingham NG7 2RD, United Kingdom, e-mail: [email protected] (correspond-ing author)
2
Associate Professor, School of Civil and Environmental Engineering, Nan-yang Technological University, 50 NanNan-yang Avenue, Singapore 639798, e-mail: [email protected]
Available online at: www.astm.org
of layers and each layer is compacted to a selected percentage of the required density of the specimen. Mulilis et al. (1978) also verified that the MT specimens prepared by the undercompaction method were more uniform than comparable specimens prepared by the constant compactive effort method proposed by Castro (1969). Vaid and Negussey (1988), on the other hand, promoted the pluvia-tion methods. They reported that pluviated specimens were more uniform than moist-tamped specimens. A detailed study of density variations in sand specimens conducted by Gilbert and Marcuson (1988) has shown, however, that some nonuniform density redistri-butions within sand specimens are unavoidable, regardless of the preparation method.
The effect of the specimen preparation method on the steady state of granular soils (Poulos 1981) has also been studied. Dennis (1988) observed that the specimen preparation method affected the slope of the steady state line for stress-controlled loading but not for strain-controlled loading. DeGregorio (1990) also reported that the steady state line determined by undrained monotonic triaxial tests was affected by the sample preparation method. In contrast, Hird and Hassona (1990) observed that the specimen preparation technique has no apparent effect on the steady state. Similar obser-vations were made by Verdugo and Ishihara (1996) and Zlatovic and Ishihara (1997). A number of researchers have also reported that moist-tamped specimens were generally more susceptible to liquefaction than water- or air-pluviated specimens (DeGregorio 1990; Hird and Hassona 1990; Vaid et al. 1999; Vaid and Sivathay-alan 2000; Chu et al. 2003a; Eliadorani and Vaid 2003). Therefore, as noted by Leong and Chu (2002), the results obtained from tests conducted on specimens prepared by one method should not be generalized to specimens prepared by other methods.
Ishihara (1993), in the 33rd Rankine Lecture, emphasized that apart from the basic requirement to produce homogeneous speci-mens, a preparation method should also be able to cover a wide density range of reconstituted specimens. He reported that the wid-est range of void ratio can be achieved using the MT method, allow-ing both the contractive and dilative behaviors of sand to be studied. Vaid et al. (1999) argued that the MT method does not simulate the fabrics of naturally deposited alluvial and hydraulic fill sands. Therefore, the use of the MT specimens for element testing might be questionable (Vaid et al. 1999; Vaid and Sivathayalan 2000; Eliadorani and Vaid 2003). Chu and Leong (2003), on the other hand, have pointed out that not all practical problems can be simu-lated by the pluviation method; e.g., a case where moist sand is truck-dumped as a fill material and subsequently submerged as the water table rises. Furthermore, some of the most important con-cepts describing the general behavior of sand, such as the steady state (Poulos 1981) or the state parameter (Been and Jefferies 1985), have been established based on data obtained from tests con-ducted on moist-tamped specimens.
More recently, Yoshimine and Koike (2005) reported that homo-geneous and uniform sand specimens prepared in the laboratory by either method do not generally resemble natural soil deposits. This is because soil structures commonly observed in nature are layered and stratified rather than homogeneous. Therefore, Yoshimine and Koike (2005) emphasized that establishing a link between different fabrics and structures obtained from various preparation methods in the laboratory and thein situsedimentation and stress histories is very important from a practical point of view. Papadimitriou et al. (2005) reported that such a link could be established by using a plasticity model with the inherent fabric anisotropy scheme, pro-posed by Dafalias et al. (2004). However, more experimental data on the effects of specimen preparation method on the stress-strain
behavior of sand under various stress and drainage conditions are needed to improve further modeling.
To date, studies comparing the effects of different specimen preparation methods on the stress-strain behavior of sand under more generalized stress conditions (e.g. plane-strain, simple shear, or multi-axial) are still very limited. For instance, Finno et al. (1997) studied the effect of the specimen preparation methods in drained plane-strain tests, whereas Vaid et al. (1999), Vaid and Si-vathayalan (2000), and Wijewickreme et al. (2005) used un-drained direct simple shear tests. They reported that the moist-tamped specimens were more nonuniform and weaker than the water- or air-pluviated specimens. Furthermore, most experimental studies on the effects of specimen preparation methods have been conducted under undrained conditions. However, in most practical problems, a truly undrained condition is exceptional because anin situsoil element will normally experience both volume change and excess pore water pressure simultaneously (Chu et al. 1992; Vaid and Eliadorani 2000). This situation can only be simulated in the laboratory by a strain path testing method (Chu and Lo 1991), in which the strain increment ratio,dv/d1, imposed on a specimen,
is controlled. To the authors’ knowledge, a comparison of different specimen preparation methods in strain path testing has not yet been reported. Therefore, more experiments need to be conducted under plane-strain or other generalized stress conditions using the strain path testing method.
Test Arrangement
The plane-strain test system developed by Wanatowski and Chu (2006) was used in this study. A prismatic soil specimen 120 mm in height and 60 by 60 mm in cross section was tested. Two 35 mm thick by 74 mm wide by 120 mm high rigid vertical platens were fixed in position by two pairs of horizontal tie rods to impose a plane-strain condition. The lateral stress in this direction共2兲was
Material Tested
The granular soil tested in this study was a marine dredged silica sand, the so-called Changi sand, used for the Changi land reclama-tion project in Singapore (Leong et al. 2000). The Changi sand has the specific gravity共Gs兲 of 2.60, the mean grain size 共D50兲 of
0.30 mm, the coefficient of uniformity共Cu兲of 2.0, and the coeffi-cient of curvature共Cc兲of 0.8. The fines’ content is approximately 0.4 %. According to the Unified Soil Classification System (ASTM D2487-06) it is medium grained, poorly graded, clean sand. The individual particles of the sand are mainly subangular in shape. The minimum and maximum void ratios were 0.533 and 0.916, respec-tively. The minimum void ratio共emin兲was determined according to
ASTM D4253-00 and the maximum void ratio共emax兲according to
ASTM D4254-00. Since the Changi sand is dredged from the sea-bed, it contains shells of various sizes ranging from 0.2 to 10 mm. The shell content of the Changi sand is approximately 12 %.
Specimen Preparation and Testing Procedures
Laboratory reconstituted specimens were used in this study. Two different specimen preparation methods, the water sedimentation (WS) and the moist tamping (MT) were employed. A four-part split mold was used for the preparation of all the specimens. A 0.4 mm thick latex membrane was fitted into the mold. A vacuum pressure of 10 kPa was used to achieve a tight fit between the mold and the membrane. The top cap and the bottom pedestal were designed in such way that a transition from a square to a circular cross section was permitted so cylindrical-shaped membrane could be used. In the WS method, sand was pluviated into the mold which was half-filled with de-aired water. Deposition of sand was done by moving the tip of the funnel in a circular motion 1 – 2 cm above the water surface. In the MT method, the oven-dried sand was first mixed with 5 % of aired water. After mixing, the moist sand was de-posited into the mold in five layers and each layer was compacted using a small tamper. The number of blows applied for each layer was carefully controlled. To achieve a greater uniformity of speci-mens, the undercompaction method, proposed by Ladd (1978), was used. For each layer, the compactive effort was increased towards the top with the undercompaction ratio of 2.5 %. For saturation, the specimen was flushed with de-aired water from the bottom to the top for 60 min under a water head of about 0.5 m. After that a back pressure of 400 kPa was applied. The Skempton’s pore water pres-sure parameter (B-value) greater than 0.96 was obtained for all the specimens. A liquid rubber technique (Lo et al. 1989) was adopted to reduce the bedding and membrane penetration errors. For more details of the sample preparation procedures see Wanatowski and Chu (2006).
In order to compare different specimen preparation methods, several pairs of plane-strain compression tests were conducted. Each pair of tests was conducted on two duplicated specimens by following the same stress or strain path. However, one specimen was prepared by the MT method and the other by the WS method. All the specimens were consolidated from an initial isotropic stress state of 20 kPa to the required stress state along theK0path. TheK0 condition was imposed by regulating the volume change of the specimen in accordance with the axial strain to maintaindv/d1
= 1, a method proposed by Lo and Chu (1991). Shearing was car-ried out using either a stress or a strain path control. A drained test was conducted using a stress path withd3⬘= 0. All other tests were
carried out using a strain path method withdv/d1= const (Chu
and Lo 1991). In this method, an undrained test is only a special case of general drainage conditions withdv/d1= 0. All the other
drainage conditions can be simulated by dv/d1⫽0. When
dv/d1⬎0, the soil element will compress and water will flow out
of the specimen with axial deformation. Hence, the pore water pressure inside the specimen will reduce. On the other hand, when dv/d1⬍0, the specimen will dilate and water will flow into the
specimen. If the specimen dilates more than the sand would under a drained condition a positive pore water pressure will develop. Fur-thermore, the more negative thedv/d1imposed on the specimen,
the more positive excess pore water pressure will be generated. It needs to be pointed out that the pore water pressure developed in an undrained strain path共dv/d1= 0兲is not the highest, as often
assumed, but it is in between that for a dilative共dv/d1⬍0兲strain
path and a compressive共dv/d1⬎0兲strain path. It means that an
undrained condition is not the most dangerous drainage situation, as is often assumed. For instance, dense sand that exhibits strain hardening behavior under an undrained condition will soften in similar way to loose sand when it is subjected to an adequate dila-tive strain path, as observed by Chu et al. (1992), Vaid and Elia-dorani (1998), and Lancelot et al. (2004). As such, only undrained
共dv/d1= 0兲 and dilative (dv/d1= −0.2 and −0.6) strain path
tests were carried out in the present study.
All the plane-strain tests were carried out under a deformation-controlled loading mode at a constant rate of 0.05 mm/ min. It should be pointed out that the back pressure level at the end ofK0
consolidation was taken as the datum and the decrease in pore water pressure was noted as negative. A summary of the plane-strain tests conducted is given in Table 1.
In this study, the deviatoric stressqand the mean effective stress p⬘are defined as
q=
冑
12关共1−2兲
2+共
2−3兲2+共3−1兲2兴1/2 (1)
p⬘=1
3共1⬘+2⬘+3⬘兲 (2)
where1,2, and3are major, intermediate, and minor principal
stresses, respectively; the prime refers to effective stress.
Repeatability of Test Results
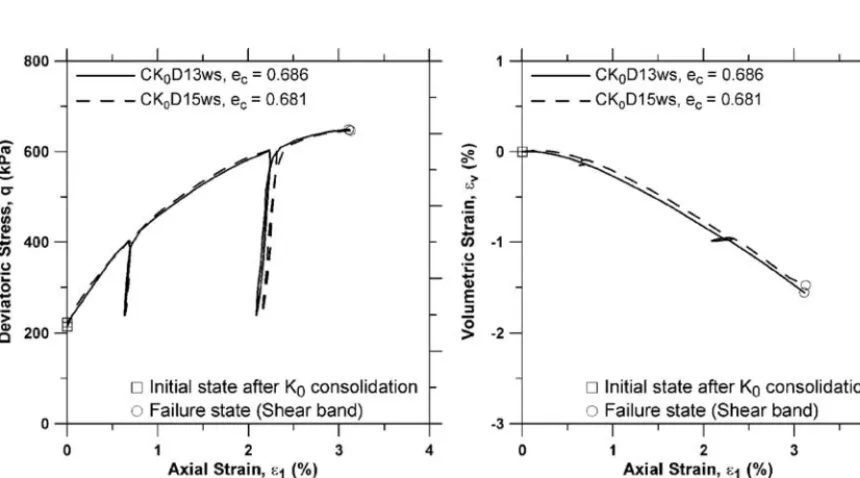
Confidence in any experimental investigation is highly dependent on the consistency and repeatability of test results. The duplication of the testing procedures described previously, ensured that repro-duction of specimens was achieved in all the tests. Figure 1 presents the results obtained from two CK0D plane-strain tests conducted in
the same way on two medium dense specimens. The specimens
were prepared by the WS method andK0consolidated to a mean
effective stresspc⬘= 200 kPa. Void ratios at the end ofK0
consolida-tion wereec= 0.686 and ec= 0.681, respectively. Both specimens were brought to the failure state by a d3⬘= 0 stress path. Two unloading-reloading cycles were imposed on each specimen. It can be seen from Fig. 1 that a good consistency in stress-strain behavior [Fig. 1(a)] and volume change [Fig. 1(b)] was obtained. Similar repeatability in test results was obtained for all the other plane-strain specimens (Wanatowski 2005)
four individual pressure transducers installed in the two vertical platens. Therefore, it was essential to ensure that2values
mea-sured by the four individual transducers were consistent and reli-able. Typical2versus1curves obtained from a drained test on a
very loose specimen prepared by the MT method are shown in Fig. 2. It can be seen that all the four curves are close to each other during the entire test. Similar observations were made from all the other plane-strain tests presented in this paper. However, it should
be pointed out that for medium loose or medium dense specimens, the lateral stress distributions become highly non-uniform in the post-peak region and the four local values of2will diverge.
Fur-thermore, the point where the2-1curves start to diverge
coin-cides with the point where shear bands occur, as discussed by Wanatowski and Chu (2006). Therefore, it can be assumed that the stresses and strains within the plane-strain specimens are essen-tially uniform before the shear band formation.
TABLE 1—Summary of plane-strain tests conducted.
Test
Preparation
Method Type of Test
Initial Statea K0consolidated State Peak State
Figure Number e0
Dr0,
% ec
Drc, %
pc⬘, kPa
qc, kPa
1c,
% K0 ep
Drp, %
pp⬘, kPa
qp, kPa 1p
CK0D13 WS drained
共d3⬘= 0兲
0.695 57.7 0.686 60.1 200.5 223.7 0.59 0.36 0.710 53.8 439.0 649.1 3.11 1 and 4
CK0D15 WS 0.689 59.3 0.681 61.4 199.4 217.6 0.52 0.34 0.703 55.6 435.1 643.5 3.13 1 and 4
CK0D08 MT 0.983 −17.5 0.914 0.5 202.0 166.0 3.41 0.47 0.869 12.3 305.8 357.9 11.79 2 and 4
CK0Dws WS 0.738 46.5 0.725 49.9 200.2 186.4 0.73 0.37 0.735 47.3 372.8 526.4 5.06 4 and 6
CK0Dmt MT 0.741 45.7 0.722 50.7 201.6 219.5 1.08 0.25 0.718 51.7 316.8 443.6 2.65 4 and 6
CK0Uws WS Undrained strain
path
0.761 40.5 0.734 47.5 199.2 205.0 0.85 0.34 0.734 47.5 486.4 660.7 5.44 4 and 7
CK0Umt MT 共dv/d1= 0兲 0.772 37.6 0.739 46.2 196.8 229.6 1.14 0.28 0.739 46.2 386.2 522.0 3.02 4 and 7
CK0SP − 0.2ws WS Dilative strain
path
0.746 44.4 0.730 48.6 202.7 191.9 0.91 0.39 0.745 44.6 282.4 385.2 4.02 4 and 8
CK0SP − 0.2mt MT 共dv/d1= −0.2兲 0.755 42.0 0.735 47.3 200.0 210.4 1.17 0.26 0.736 47.0 195.4 239.4 0.16 4 and 8
CK0SP − 0.6ws WS Dilative strain
path
0.764 39.7 0.745 44.6 200.7 200.0 1.10 0.38 0.746 44.4 200.4 220.5 0.18 4 and 9
CK0SP − 0.6mt MT 共dv/d1= −0.6兲 0.759 41.0 0.738 46.5 203.6 216.3 1.19 0.25 0.740 46.0 197.2 231.4 0.05 4 and 9
K0MT1 MT K0
consolidation
0.765 39.4 0.750 43.3 200.2 232.7 0.86 0.25 — — — — — 4 and 5
K0MT7 MT 共dv/d1= 1.0兲 0.978 −16.2 0.915 0.3 198.0 157.2 3.29 0.48 — — — — — 3 and 4
K0WS4 WS 0.768 38.6 0.756 41.8 202.9 203.5 0.93 0.39 — — — — — 4 and 5
a
[image:5.612.82.512.480.719.2]30= 420 kPa,u0= 400 kPa,p0⬘= 20 kPa,q0= 0 kPa
Experimental Results
K
0Consolidation
TheK0behavior of Changi sand in strain path tests conducted in a
triaxial cell and a plane-strain apparatus has already been discussed in detail by Chu and Gan (2004) and Wanatowski and Chu (2007). Therefore, only the most important findings will be reported in this paper.
Firstly, the2⬘and3⬘versus axial strain curves obtained from a K0consolidation test conducted on the MT sand in a plane-strain apparatus are compared in Fig. 3. It can be seen that the two curves are almost identical; that is, 2⬘=3⬘ is obtained under the d2
=d3= 0 condition. Similar observations were made from all the
otherK0consolidation tests conducted on Changi sand in the
plane-strain apparatus. This suggests that there is no strong anisotropy in the2⬘and3⬘directions; that is, the specimen is essentially cross-anisotropic. Furthermore, this also serves as a verification of the reliability of the plane-strain apparatus used in this study.
Secondly, the K0 values for Changi sand obtained from this
study and the study by Wanatowski and Chu (2007) carried out in a
triaxial cell and a plane-strain apparatus are compared in Fig. 4. All theK0values were calculated at the end of consolidation stage that
is at a mean effective stress of 200 kPa. It can be seen from Fig. 4 that within the range of void ratio tested theK0values of the WS
specimens fall within a narrow range. In other words, theK0values obtained from the tests on WS specimens show little dependence on the initial void ratio. On the other hand, theK0values obtained from
the tests on MT specimens form a relationship with the initial void ratio. It can be observed from Fig. 4 that the looser the MT speci-men, the higher theK0value. Chu and Gan (2004) and Wanatowski
and Chu (2007) have also reported thatK0values obtained from the
tests on Changi sand do not agree well with Jaky’s equation (Jaky 1944) expressed as
K0= 1 − sin⬘ (3)
where⬘is the peak effective friction angle of soil.
It can also be seen from Fig. 4 that theK0values obtained from
tests on the MT specimens are different from those on the WS specimens at the same void ratio. TheK0values obtained from the
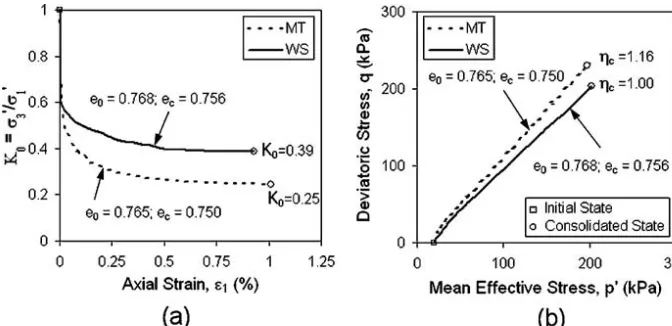
MT specimens are generally lower than those from the WS speci-mens. This is illustrated further in Fig. 5(a) where theK0-1curves
obtained from two tests conducted on WS and MT specimens with similar void ratios are compared. It can be observed from Fig. 5(a) that the higherK0value and the lower axial strain were measured
duringK0consolidation of the MT sand. It should also be noted that
aK0test on sand has to be started from an initial isotropic stress
state of 20 kPa. This is because theK0consolidation test on
satu-rated sand cannot be commenced from a free stress state. There-fore, there is an initial transition from the isotropic state to theK0 state. However, this transition only affects theK0value at the initial
period. TheK0value approaches more or less a constant value after
axial strain exceeds 0.4–0.5 %, which corresponds to the mean ef-fective stress of 80– 100 kPa, as shown in Fig. 5(a). This observa-tion is consistent with what has been established in a triaxial cell by Lo and Chu (1991) and Chu and Gan (2004). They have reported that an initial isotropic stress does not affect the resultingK0path
when the consolidation stress is beyond four times the initial stress. The effective stress paths obtained from the two K0 tests are
plotted in Fig. 5(b). It can be seen that the effectiveK0paths
[image:6.612.57.261.55.226.2]ob-tained from the WS and MT specimens are different. This shows that the specimen preparation method affects not only theK0value
FIG. 2—The2versus1curves obtained for a very loose specimen prepared by the moist tamping method.
[image:6.612.323.529.55.251.2]FIG. 3—The lateral stress response obtained from a K0consolidation test.
[image:6.612.55.261.520.719.2]of sand but also the effective stress ratiocdetermined at the end of
K0consolidation. As shown in Fig. 5(b), the higher effective stress
ratiocwas obtained for the MT sand. Similar behavior was
ob-served from all the otherK0consolidation tests conducted in the
plane-strain apparatus. As a result, all the plane-strain tests dis-cussed in the following sections are affected by theK0
consolida-tion stage; i.e., eachK0consolidated plane-strain compression test
conducted on the MT sand had to be commenced from the higher
ccompared to that conducted on the WS sand with comparable
void ratio.
Drained Behavior
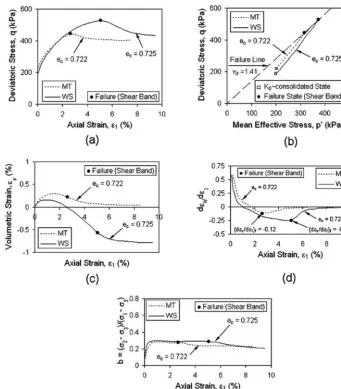
The results of two CK0D tests conducted on medium loose speci-mens with comparable void ratios are presented in Fig. 6. Both specimens were K0 consolidated to a mean effective stress pc⬘ = 200 kPa and then sheared under drained conditions with3⬘ main-tained constant. The stress-strain curves obmain-tained from the two tests are compared in Fig. 6(a). It can be observed that the two stress-strain curves are similar. In both tests, the deviatoric stress firstly reached a peak, and then reduced gradually to an ultimate value. However, the peak deviatoric stress obtained from the MT speci-men 共qp= 444 kPa兲 was lower than that from the WS specimen
共qp= 526 kPa兲. It can also be seen from Fig. 6(a) that the peak
de-viatoric stress of the MT specimen was reached at an axial strain of 2.6 %, which is much lower than that of the WS specimen (5.1 %). The effective stress paths obtained from the two tests are com-pared in Fig. 6(b). The two stress paths are slightly different due to different deviatoric stresses at the end of K0 consolidation (qc
= 184 kPa for the WS sand andqc= 219 kPa for the MT sand). This
is because the effective stress ratio at the end ofK0consolidation,
c, obtained from the MT specimen is higher than that from the WS
specimen, as explained earlier. Nevertheless, the same failure line with the gradient f= 1.41 was obtained from the two tests. It
should be noted that the peak (i.e., the failure) was accompanied by a shear band formation in both tests. Thev-1curves of the two
tests are compared in Fig. 6(c). The twov-1curves are similar,
showing an initial volumetric contraction and a subsequent volu-metric dilation. However, the MT specimen behaves more contrac-tively compared to the WS specimen. As a result, the volumetric strains measured at the end of two tests are different. The dilatancy behaviors of the two specimens are compared in Fig. 6(d) where the strain increment ratio共dv/d1兲versus axial strain共1兲curves are
plotted. In both tests, a contractive behavior (i.e.,dv/d1⬎0) was
observed until the characteristic state (Luong 1980) was reached. After that a dilative behavior (i.e.,dv/d1⬍0) was obtained in the
two tests. The characteristic state is defined as the transition point from compression to dilation in a drained test. It can be determined from thev-1curve as the point where the tangent is horizontal (Luong 1980). As shown in Fig. 6(d), the maximum rate of dila-tancy was measured at the failure state of each test. As a result, the minimum (i.e., failure) strain increment ratios of 共dv/d1兲f
= −0.12 and共dv/d1兲f= −0.25 were obtained from the MT and the
WS specimens, respectively. It can also be observed from Fig. 6(d) that the dilatancy rate slowed down in the post-peak regions reach-ing a constant value at the end of each test.
Theb-value 关b=共2−3兲/共1−3兲兴 versus1curves are
pre-sented in Fig. 6(e). It can be seen that similarb-values were mea-sured in the two drained tests. The failureb-values of 0.27 and 0.28 were obtained from the MT and the WS specimens, respectively.
Undrained Behavior in Strain Path Testing
共
d
V
/ d
1
= 0
兲
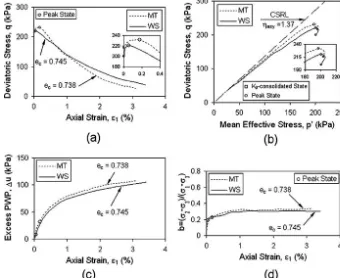
The results of two undrained tests, CK0Uws and CK0Umt, con-ducted on medium loose sand using a strain path method (Chu and Lo 1991) are compared in Fig. 7. The two specimens wereK0
con-solidated topc⬘= 200 kPa and then sheared undrained by maintain-ing thedv/d1ratio at zero. Test CK0Uws was conducted on the
WS specimen and test CK0Umt on the MT specimen.
The stress-strain curves of the two tests are plotted in Fig. 7(a). Similar stress-strain behaviors can be observed in the two tests. It can be seen from Fig. 7(a) that after the stress-strain curves reached a peak, strain softening occurred in both tests. The peak states de-termined from the two tests were accompanied by the formation of shear bands. However, the peak values in the two tests are different and the axial strains at the peak are also different. The higher peak deviatoric stress and the higher axial strain were measured from the WS test, as shown in Fig. 7(a). This is consistent with the stress-strain behavior of medium loose sand under drained conditions, shown in Fig. 6(a).
[image:7.612.127.463.57.220.2]lower peak deviatoric stress of the MT specimen. Nevertheless, it can be seen that the two effective stress paths approach asymptoti-cally to a straight line. This line has been called the constant stress ratio line (CSRL) by Chu et al. (2003b). The gradient of this line is asy= 1.37. This so-called asymptotic behavior (Gudehus et al.
1977) has also been observed for other soils under axisymmetric conditions (Zhang and Garga 1997; Chu et al. 2003b), plane-strain conditions (Topolnicki et al. 1990) and three-dimensional condi-tions (Chu and Lo 1994).
The excess pore water pressure versus axial strain curves ob-tained from the two tests are shown in Fig. 7(c). Similar pre-peak behaviors were observed for both, the MT and the WS, specimens. However, a more negative excess pore water pressure was gener-ated at the peak point of the WS specimen. As shown in Fig. 7(c), the⌬u-1curves of the two specimens are similar in the post-peak
region. The excess pore water pressures in the two tests ceased soon after the peak accompanied by shear bands was reached.
Theb-value versus1curves of the two tests are plotted in Fig.
7(d). It can be observed from Fig. 7(d) that both curves are very similar. The peakb-values of 0.26 and 0.22 were measured from the MT and the WS specimens, respectively.
Dilative Behavior in Strain Path Testing
共
d
v
/ d
1
⬍
0
兲
The results of two dilative strain path tests withdv/d1= −0.2
im-posed on medium loose specimens reconstituted to comparable void ratios by two different preparation methods are shown in Fig. 8. Both specimens wereK0consolidated topc⬘= 200 kPa and then
sheared withdv/d1= −0.2 maintained constant. This means that
water was controlled to flow into the specimen and the soil was forced to dilate at a constant rate during the entire shearing stage.
[image:8.612.126.467.55.444.2]men was reached at1= 4.02 %, whereas the peak point of the MT
specimen was reached at1= 0.16 %. Second, in the WS test, the
peak was accompanied by the shear band formation. However, in
[image:9.612.127.463.57.339.2]the MT test, no shear band has occurred. Therefore, the strain soft-ening observed in the strain path test on the WS sand is due to the development of shear band rather than an element soil behavior. In FIG. 7—Comparison of undrained共dv/ d1= 0兲strain path tests conducted on WS and MT specimens.
[image:9.612.125.463.435.718.2]other terms, a material softening was observed for the MT sand, whereas a banding softening (Chu et al. 1996, Wang and Lade 2001) was observed for the WS sand.
The effect of the specimen preparation method on the occur-rence of strain softening is further demonstrated in Fig. 8(b) where the effective stress paths of the MT and WS tests are compared. As shown in Fig. 8(b), the effective stress paths traced by the two dv/d1= −0.2 tests are different. Strain softening is observed in
the MT sand but not in the WS sand, as discussed earlier. However, both effective stress paths approach asymptotically to the same constant stress ratio line with the gradientasy= 1.37. This gradient
is consistent with that obtained from undrained tests共dv/d1= 0兲,
shown in Fig. 7(b).
The⌬u-1curves obtained from the two tests are shown in Fig.
8(c). It can be seen that two different curves were measured in the two tests. The excess pore pressure increased continuously throughout the entire MT test indicating contractive behavior of moist-tamped sand. On the other hand, the pore water pressure in the WS specimen increased initially leading to limited strain soft-ening behavior [see Fig. 8(b)], and then reduced gradually, leading to strain hardening behavior [see Fig. 8(a)]. Finally, after the shear band development, the excess pore water pressure in the WS test increased again [Fig. 8(c)] and the banding type of strain softening behavior was observed, as shown in Figs. 8(a) and 8(b). It can also be seen in Fig. 8(c) that the excess pore water pressure developed in the MT specimen was higher than that developed in the WS speci-men.
The b-value versus axial strain curves obtained from the
dv/d1= −0.2 path tests are shown in Fig. 8(d). The same peak
b-value of 0.27 was obtained from each specimen. However, the b-value measured for the MT sand was almost constant throughout
the entire test whereas the b-value measured for the WS sand
started to increase soon after the shear band had developed [Fig. 8(d)].
The results of another pair of dilative strain path tests with dv/d1= −0.6 imposed on the medium loose specimens prepared
to comparable void ratios by two different reconstitution methods are shown in Fig. 9. Both specimens were firstlyK0consolidated to
pc⬘= 200 kPa and then sheared withdv/d1= −0.6 maintained
con-stant.
The stress-strain curves and the effective stress paths obtained from the two tests are presented in Figs. 9(a) and 9(b), respectively. It can be observed that the trends of theq-1andq-p⬘curves are
very similar. The peak deviatoric stress, obtained at a very low axial strain, was followed by strain softening behavior in each test, as shown in Figs. 9(a) and 9(b). However, a slightly lower value of peak deviatoric stress was yielded in the WS test. This is because the effective stress ratio at the end ofK0consolidation,c, obtained
from the MT specimen was higher than that obtained from the WS specimen, as explained earlier. Nevertheless, the same CSRL with a slopeasy= 1.37 was approached by the two effective stress paths,
as shown in Fig. 9(b). The⌬u-1andb-1curves for the two tests
are plotted in Figs. 9(c) and 9(d), respectively. It can be seen that the excess pore water pressures and theb-values obtained from the two tests are very similar.
Discussion
[image:10.612.124.464.61.339.2]has been established that loose moist-tamped specimens subjected to undrained loading are generally more susceptible to liquefaction than water- or air-pluviated specimens (DeGregorio 1990; Vaid et al. 1999; Vaid and Sivathayalan 2000; Chu et al. 2003a; Elia-dorani and Vaid 2003).
The data presented in this paper further show that the plane-strain compression behavior of medium loose sand underK0,
und-rained, and drained conditions is affected by the specimen prepara-tion method.
UnderK0conditions, theK0values obtained from the MT
speci-mens are generally lower than those from the WS specispeci-mens. Fur-thermore, within the range of void ratios tested, the variation in the K0value of the MT specimens is much larger compared to that of
the WS specimens, as is shown in Fig. 4.
Under undrained conditions, the lower deviatoric stress and the more positive excess pore water pressure are measured at the peak state of the MT specimen. In other words, more contractive behav-ior is observed for the MT sand. This is consistent with the obser-vations made previously under axisymmetric conditions, which showed a higher liquefaction susceptibility of moist-tamped speci-mens than those of water- or air-pluviated specispeci-mens (e.g., DeGre-gorio 1990; Hird and Hassona 1990; Vaid et al. 1999; Chu et al. 2003a; Eliadorani and Vaid 2003). On the other hand, the results presented in this study have shown that the asymptotic state (Gude-hus et al. 1977; Chu and Lo 1994) and, consequently, the slope of constant stress ratio line (Chu et al. 2003b) approached by the ef-fective stress paths of medium loose (or denser) sand are not af-fected by the specimen preparation method. Similar observations were made under axisymmetric conditions by Verdugo and Ishihara (1996) and Zlatovic and Ishihara (1997), who showed that the steady state of loose sand in triaxial compression was not affected by the specimen preparation method.
Under drained conditions, the medium loose plane-strain speci-men prepared by the MT method behaved more contractively than that prepared by the WS method [Fig. 6(c)]. As a result, the dila-tancy behaviors of the MT and WS specimens were different [Fig. 6(d)]. Moreover, similar to an undrained condition, the lower peak deviatoric stress was obtained for the MT specimen under a drained condition [Fig. 6(a)]. Despite the differences in stress-strain and dilatancy behaviors of the MT and the WS specimens, the same failure line with the gradient f= 1.41 (corresponding to f⬘
= 44.5°) was reached in the two tests, as shown in Fig. 6(b). From a practical point of view, this is a very important observation because it shows that the effective stress ratio at failure or the effective fric-tion angle of a granular soil should not be affected by the specimen preparation method. Therefore, a relationship between the effective friction angle and the void ratio established for the MT sand should also be applicable for the WS sand, and vice versa. However, it should be emphasized that the stress-dilatancy relationships estab-lished for specimens prepared by different reconstitution methods will be different [Fig. 6(d)].
The data presented in this paper also illustrate that the plane-strain compression behavior of medium loose sand in plane-strain path testing can be affected by the specimen preparation method. How-ever, the differences in stress-strain behavior of sand will also de-pend on the strain increment ratio共dv/d1兲 imposed on
speci-mens. For example, different stress-strain curves of the MT and WS specimens were obtained fromdv/d1= −0.2 strain path tests. A
contractive behavior was obtained for the MT specimen whereas dilative behavior was obtained for the WS specimen, as shown in Fig. 8(a). On the other hand, a very similar stress-strain behavior of the MT and WS sand was observed indv/d1= −0.6 strain path
tests (i.e., strain softening) or indv/d1= 0 (undrained) strain path
tests (i.e., strain hardening followed by banding softening), as shown in Figs. 7(a) and 9(a).
The difference in the effects of the specimen preparation method on the stress-strain behavior of Changi sand in strain path testing can be explained by using the conditions for the occurrence of strain softening established by Chu et al. (1992) under axisym-metric conditions. As shown by Chu et al. (1996) and Wanatowski (2005), the conditions for the occurrence of strain softening are also applicable to true triaxial and plane-strain tests. Chu et al. (1992) have reported that whether a soil element undergoes strain softening or hardening depends on the relative magnitude of the strain increment ratio of soil at failure obtained from a drained test,
共dv/d1兲f, and the strain increment ratio,共dv/d1兲i, imposed
dur-ing the test. When the strain increment ratio imposed on the speci-men,共dv/d1兲i, is larger (i.e., more positive) than a strain
incre-ment ratio at failure as measured in a drained test,共dv/d1兲f, strain
hardening behavior will prevail. On the other hand, when the
共dv/d1兲iis smaller (i.e., more negative) than the strain increment
ratio at failure as measured in a drained test,共dv/d1兲f, strain
soft-ening will occur. However, as shown in this study, different
共dv/d1兲fratios will be obtained from drained tests conducted on two similar specimens prepared by different reconstituting methods [Fig. 6(d)]. Therefore, in order to determine whether a specimen prepared by a given reconstituting method will undergo strain soft-ening in a 共dv/d1兲i= const test, the relative magnitude of the 共dv/d1兲iand共dv/d1兲fobtained from a drained test conducted
on a similar specimen reconstituted by the same method must be determined.
For instance, in the dv/di= −0.2 test on the WS sand 共dv/d1兲i= −0.20 and共dv/d1兲f= −0.25 [see Fig. 6(d)].
Conse-quently, 关共dv/d1兲i−共dv/d1兲f兴= 0.05 and strain hardening
be-havior prevails in the pre-failure region of the WS test. However, in thedv/d1= −0.2 test on the MT sand,共dv/d1兲f= −0.12 [see Fig.
6(d)] and关共dv/d1兲i−共dv/d1兲f兴= −0.08. Therefore, pre-failure strain softening is observed for the MT sand. Using the same framework, a stress-strain behavior observed in the dv/di= 0 (undrained) or thedv/di= −0.6 test can be analyzed. A relative
magnitude of the共dv/d1兲f and the 共dv/d1兲imeasured in the
dv/di= 0 (undrained) tests is positive for both MT and WS
speci-mens. As a result, the strain hardening behavior was observed in both tests (Fig. 7). In contrast, a negative relative magnitude of the
共dv/d1兲f and the 共dv/d1兲i was measured in both dv/d1
= −0.6 tests conducted on the MT and the WS specimens. There-fore, strain softening occurred in these two tests (Fig. 9).
Vaid et al. (1999), Frost and Jang (2000), and Frost and Park (2003), the moist-tamped specimens are always more nonuniform in void ratio distribution than the water-pluviated specimens. Work by Yamamuro and Wood (2004) also suggests that moist-tamped specimens might retain more unstable grain contacts than water-pluviated specimens. In other words, an unstable and highly com-pressible particle microstructure is produced by the MT. Therefore, although a direct examination of the sand fabric has not been car-ried out, it can be concluded that the differences in the stress-strain behaviors of the MT and WS specimens observed in this study may be related to the differences in soil fabrics and structures resulting from different specimen preparation methods.
Conclusions
The results ofK0consolidated drained, undrained, and strain path
plane-strain compression tests conducted on medium loose speci-mens prepared by two different preparation methods are presented and compared in this study. Based on the experimental results pre-sented, the following conclusions can be drawn:
1) The plane-strain compression behavior of medium loose
sand underK0, drained, and strain-path controlled
(includ-ing undrained) conditions is affected by the specimen preparation method.
2) The data show that theK0values obtained from the tests on
MT specimens form a relationship with the initial void ratio. However, theK0values obtained from the tests on
WS specimens demonstrate little dependence on the initial void ratio. TheK0values obtained from the MT specimens
are generally lower than those obtained from the WS speci-mens.
3) Under drained conditions, specimens prepared by the MT
method behave more contractively that those prepared by the WS method. As a result, the dilatancy behaviors of the MT and WS specimens are different. Despite the differ-ences in stress-strain and dilatancy behaviors of the MT and the WS specimens, the same failure line is reached in the two tests. This indicates that the effective stress ratio at failure or the effective friction angle of a granular soil should not be affected by the specimen preparation method.
4) Under undrained conditions, the lower peak deviatoric
stress and the higher excess pore water pressure are ob-tained for the MT sand. However, the results presented in this study show that the asymptotic state (Gudehus et al. 1977; Chu and Lo 1994) approached by the effective stress paths of medium loose (or denser) sand is not affected by the specimen preparation method.
5) Although plane-strain compression behavior of medium
loose sand in strain path testing can be affected by the specimen preparation method, the differences in the stress-strain behavior of sand will also depend on the stress-strain incre-ment ratio共dv/1兲imposed on specimens. Therefore, in
order to determine whether contractive or dilative behavior will be observed in a strain path test, the strain increment ratio,共dv/d1兲i, imposed on a specimen and the strain
in-crement ratio at failure obtained from a drained test,
共dv/1兲f, have to be compared, as suggested by Chu et al.
(1992).
6) The difference in the stress-strain behaviors of the WS and MT specimens can be related to the differences in the soil
fabrics and structures resulting from different specimen preparation methods.
Acknowledgments
The experimental data presented in this paper have been obtained during first author’s doctoral study at Nanyang Technological Uni-versity in Singapore. The research scholarship provided by Nan-yang Technological University is gratefully acknowledged.
References
ASTM, Standard D2487, “Standard Practice for Classification of Soils for Engineering Purposes (Unified Soil Classification
Sys-tem),” Annual Book of ASTM Standards, Vol. 04.08, ASTM
International, West Conshohocken, PA, pp. 249–260.
ASTM, Standard D4253, “Standard Test Methods for Maximum Index Density and Unit Weight of Soils Using a Vibratory
Table,” Annual Book of ASTM Standards, Vol. 04.08 ASTM
International, West Conshohocken, PA, pp. 556–570.
ASTM, Standard D4254, “Standard Test Methods for Minimum Index Density and Unit Weight of Soils and Calculation of
Rela-tive Density,” Annual Book of ASTM Standards, Vol. 04.08,
ASTM International, West Conshohocken, PA, pp. 571–579. Been, K., and Jefferies, M. G., 1985, “A State Parameter for Sand,”
Geotechnique, Vol. 35, No. 2, pp. 99–112.
Casagrande, A., 1965, “Role of Calculated Risk in Earthwork and Foundation Engineering,”J. Soil Mech. and Found. Div., Vol.
91, No. SM4, 1–40.
Castro, G., 1969, “Liquefaction of Sands,” Ph.D. Thesis, Harvard University, Cambridge, MA; also Harvard Soil Mechanics Series 81.
Chu, J., and Gan, C. L., 2004, “Effect of Void Ratio onK0of Loose Sand,”Geotechnique, Vol. 54, No. 4, pp. 285–288.
Chu, J., and Leong, W. K., 2003, “Reply to the Discussion on ‘Effect of Undrained Creep on the Instability Behaviour of Loose Sand’,”Can. Geotech. J., 40, pp. 1058–1059.
Chu, J., Leong, W. K., and Loke, W. L., 2003a, “Discussion of ‘Defining An Appropriate Steady State Line for Merriespruit Gold Tailings’,”Can. Geotech. J., Vol. 40, pp. 484–486. Chu, J., Leroueil, S., and Leong, W. K., 2003b, “Unstable
Behav-iour of Sand and its Implication for Slope Stability,”Can. Geo-tech. J., Vol. 40, pp. 873–885.
Chu, J., and Lo, S.-C. R., 1991, “On the Implementation of Strain Path Testing,”Proceedings of the 10th European Conference on Soil Mechanics, Florence, Vol. 1, pp. 53–56.
Chu, J., and Lo, S.-C. R., 1994, “Asymptotic Behaviour of a Granu-lar Soil in Strain Path Testing,”Geotechnique, Vol. 44, No. 1, pp. 65–82.
Chu, J., Lo, S.-C. R., and Lee, I. K., 1992, “Strain Softening Behav-ior of a Granular Soil in Strain Path Testing,”J. Geotech. Engrg., Vol. 118, No. 2, pp. 191–208.
Chu, J., Lo, S.-C. R., and Lee, I. K., 1996, “Strain Softening and Shear Band Formation of Sand in Multi-Axial Testing,” Geo-technicsVol. 46, No. 1, pp. 63–82.
Dafalias, Y. F., Papadimitrou, A. G., and Li., X. S., 2004, “Sand Plasticity Model Accounting for Inherent Fabric Anisotropy,”J. Eng. Mech., Vol. 130, No. 11, pp. 1319–1333.
Dennis, N. D., 1988, “Influence of Specimen Preparation Tech-niques and Testing Procedures on Undrained Steady State Shear Strength,”Advanced Triaxial Testing of Soil and Rock, ASTM STP 977, R. T. Donaghe, R. C. Chaney, and M. L. Silver, Eds., ASTM, Philadelphia, pp. 642–654.
Eliadorani, A., and Vaid., Y. P., 2003, “Discussion of ‘Effect of Undrained Creep on the Instability Behaviour of Loose Sand’,” Can. Geotech. J., Vol. 40, pp. 1056–1057.
Finno, R. J., Alarcon, M. A., Mooney, M., and Viggiani, G., 1997, “Shear Bands in Plane Strain Active Tests of Moist Tamped and Pluviated Sands,”Proceedings of the 14th International Confer-ence on Soil Mechanics and Foundation Engineering, Ham-burg, Vol. 1, pp. 295–298.
Frost, J. D., and Jang, D.-J., 2000, “Evolution of Sand Microstruc-ture During Shear,”J. Geotech. Geoenviron. Eng., Vol. 126, No. 2, pp. 116–130.
Frost, J. D., and Park, J.-Y., 2003, “A Critical Assessment of the Moist Tamping Technique,”Geotech. Test. J., Vol. 26, No. 1, pp. 57–70.
Gilbert, P. A., and Marcuson III W. F., 1988, “Density Variation in Specimens Subjected to Cyclic and Monotonic Loads,”J. Geo-tech. Engrg., Vol. 114, No. 1, pp. 1–20.
Gudehus, G., Goldscheider, M., and Winter, H., 1977, “Mechanical Properties of Sand and Clay and Numerical Integration Meth-ods: Some Sources of Errors and Bounds of Accuracy,”Finite Elements in Geomechanics, G. Gudehus, Ed., Wiley and Sons, London-New York, pp. 121–150.
Hird, C. C., and Hassona, F. A. K., 1990, “Some Factors Affecting the Liquefaction and Flow of Saturated Sands in Laboratory Tests,”Eng. Geol. (Amsterdam), Vol. 28, pp. 149–170. Ishihara, K., 1993, “Liquefaction and Flow Failure During
Earth-quakes,”Geotechnique, Vol. 43, No. 3, pp. 351–415.
Jaky, J., 1944, “The Coefficient of Earth Pressure at Rest,” in Hun-garian (A nyugalmi nyomas tenyezoje),J. Soc. Hung. Eng. Arch. (Magyar Mernok es Epitesz-Egylet Kozlonye), Vol. 25, pp. 355– 358.
Kuo, C.-Y., and Frost, J. D., 1996, “Uniformity Evaluation of
Cohesionless Specimens Using Digital Image Analysis”, J.
Geotech. Engrg., Vol. 122, No. 5, pp. 390–396.
Ladd, R. S., 1974, “Specimen Preparation and Liquefaction of Sand,”J. Geotech. Engrg. Div., Vol. 100, No. GT10, pp. 1180– 1184.
Ladd, R. S., 1977, “Specimen Preparation and Cyclic Stability of Sands,”J. Geotech. Engrg. Div., Vol. 103, No. GT6, pp. 535– 547.
Ladd, R. S., 1978, “Preparing Test Specimens Using Undercom-paction,”Geotech. Test. J., Vol. 1, No. 1, pp. 16–23.
Lancelot, L., Shahrour, I., and Al Mahmoud, M., 2004, “Instability and Static Liquefaction on Proportional Strain Paths for Sand at Low Stresses,”J. Eng. Mech., Vol. 130, No. 11, 1365–1372. Leong, W. K., and Chu, J., 2002, “Effect of Undrained Creep on
Instability Behaviour of Loose Sand,”Can. Geotech. J., Vol. 39, pp. 1399–1405.
Leong, W. K., Chu, J., and Teh, C. I., 2000, “Liquefaction and In-stability of a Granular Fill Material,”Geotech. Test. J., Vol. 23, No. 2, pp. 178–192.
Lo, S.-C. R., and Chu, J., 1991, “The Measurement ofK0by Tri-axial Strain Path Testing,”Soils Found., Vol. 31, No. 2, pp. 181– 187.
Lo, S.-C. R., Chu, J., and Lee, I. K., 1989, “A Technique for Reduc-ing Membrane Penetration and BeddReduc-ing Errors,”Geotech. Test. J., Vol. 12, No. 4, pp. 311–316.
Luong, M. P., 1980, “Stress-Strain Aspects of Cohesionless Soil Under Cyclic and Transient Loading,”Proceedings of the Inter-national Symposium on Soils under Cyclic and Transient Load-ing, Swansea, UK., G. N. Pande and O. C. Zienkiewicz, Eds., Balkema, Rotterdam, pp. 315–324.
Miura, S., and Toki, S., 1982, “A Sample Preparation Method and its Effect on Static and Cyclic Deformation-Strength Properties of Sand,”Soils Found., Vol. 22, No. 1, pp. 61–77.
Mulilis, J. P., Seed, H. B., Chan, C. K., Mitchell, J. K., and Aru-lanandan, K., 1977, “Effects of Sample Preparation on Sand Liquefaction,” J. Geotech. Engrg. Div., Vol. 103, No. GT2, pp. 91–109.
Mulilis, J. P., Townsend, F. C., and Horz, R. C., 1978, “Triaxial Test-ing Techniques and Sand Liquefaction,”Dynamic Geotechnical Testing, ASTM STP 654, ASTM, Philadelphia, pp. 265–279. Oda, M., 1972a, “Initial Fabrics and Their Relation to Mechanical
Properties of Granular Material,”Soils Found., Vol. 12, No. 1, pp. 17–36.
Oda, M., 1972b, “The Mechanism of Fabric Changes During Com-pressional Deformation of Sand,”Soils Found., Vol. 12, No. 2, pp. 1–18.
Olson, S. M., and Stark, T., 2003, “Yield Strength Ratio and
Lique-faction Analysis of Slopes and Embankments,” J. Geotech.
Geoenviron. Eng., Vol. 129, No. 8, pp. 727–737.
Papadimitriou, A. G., Dafalias, Y. F., and Yoshimine, M., 2005, “Plasticity Modelling of the Effect of Sample Preparation
Method on Sand Response,” Soils Found., Vol. 45, No. 2,
pp. 109–123.
Poulos, S. J., 1981, “The Steady State of Deformation,”J. Geotech. Engrg. Div., Vol. 107, No. 5, pp. 553–562.
Rowe, P. W., and Barden, L., 1964, “Importance of Free Ends in Triaxial Testing,”J. Soil Mech. and Found. Div., Vol. 90, No. 1, pp. 1–15.
Silver, M. L., Tatsuoka, F., Phukunhaphan, A., and Avramidis, A. S., 1980, “Cyclic Undrained Strength of Sand by Triaxial Test and Simple Shear Test,”Proceedings of the 7th World Confer-ence on Earthquake Engineering, Istambul, Vol. 3, pp. 281– 288.
Topolnicki, M., Gudehus, G., and Mazurkiewicz, B. K., 1990, “Observed Stress-Strain Behaviour of Remoulded Saturated Clay Under Plane-Strain Conditions,”Geotechnique, Vol. 42, No. 2, pp. 155–187.
Vaid, Y. P., and Eliadorani, A., 1998, “Instability and Liquefaction of Granular Soils Under Undrained and Partially Drained States,”Can. Geotech. J., Vol. 35, pp. 1053–1062.
Vaid, Y. P., and Eliadorani, A., 2000, “Undrained and Drained(?) Stress-Strain Response,”Can. Geotech. J., Vol. 37, pp. 1126– 1130.
Vaid, Y. P., and Negussey, D., 1988, “Preparation of Reconstituted Sand Specimens,”Advanced Triaxial Testing of Soil and Rock, ASTM STP 977, R. T. Donaghe, R. C. Chaney, and M. L. Silver, Eds., ASTM, Philadelphia, pp. 405–417.
Vaid, Y. P., and Sivathayalan, S., 2000, “Fundamental Factors Affecting Liquefaction Susceptibility of Sands,”Can. Geotech. J., Vol. 37, pp. 592–606.
Vaid, Y. P., Sivathayalan, S., and Stedman, D., 1999, “Influence of Specimen-Reconstituting Method on the Undrained Response of Sand,”Geotech. Test. J., Vol. 22, No. 3, pp. 187–195. Verdugo, R., and Ishihara, K., 1996, “The Steady State of Sandy
Soils,”Soils Found., Vol. 36, No. 2, pp. 81−92.
Under Plane-Strain Conditions,” Ph.D Thesis, Nanyang Techno-logical University, Singapore.
Wanatowski, D., and Chu, J., 2006, “Stress-Strain Behaviour of a Granular Fill Measured by a New Plane-Strain Apparatus,” Geotech. Test. J., Vol. 29, No. 2, pp. 149–157.
Wanatowski, D., and Chu, J., 2007, “K0of Sand Measured by a
Plane-Strain Apparatus,”Can. Geotech. J., Vol. 44, pp. 1006– 1012.
Wang, Q., and Lade, P. V., 2001, “Shear Banding in True Triaxial Tests and Its Effect on Failure in Sand,”J. Eng. Mech., Vol. 127, No. 8, pp. 754–761.
Wijewickreme, D., Sriskandakumar, S., and Byrne, P., 2005, “Cyclic Loading Response of Loose Air-Pluviated Fraser River Sand for Validation of Numerical Models Simulating Centrifuge
Tests,”Can. Geotech. J., Vol. 42, pp. 550–561.
Yamamuro, J., and Wood, F. M., 2004, “Effect of Depositional Method on the Undrained Behavior and Microstructure of Sand With Silt,”Soil Dyn. Earthquake Eng., Vol. 24, No. 10, pp. 751– 760.
Zhang, H., and Garga, V. K., 1997, “Quasi-Steady State: A Real Behaviour?,”Can. Geotech. J., Vol. 34, pp. 749–761.
Zlatovic, S., and Ishihara, K., 1997, “Normalized Behaviour of Very Loose Non-Plastic Soils: Effects of Fabric,”Soils Found., Vol. 37, No. 4, pp. 47–56.
Yoshimine, M., and Koike, R., 2005, “Liquefaction of Clean Sand With Stratified Structure due to Segregation of Particle Size,” Soils Found.Vol. 45, No. 4, pp. 89–98.