Effect of Aging Time on Shape Memory Properties of Sputtered Ni rich Ni2MnGa Alloy Films
6
0
0
Full text
(2) 862. M. Suzuki et al.. crostructure. 2.2 Characterization of prepared films X-ray diffraction (XRD) studies for the heat-treated and aged 400 W–1073 K-films were made using Cu–Kα radiation on an X-ray diffractmeter (Rigaku, RAD-C) equipped with a heating stage in a temperature range from 303 to 373 K. The measurements were made while these films were held at. (a). (b). 200 MnO. Intensity, I (arb.unit). 220 L2 1. 400W -1073K-film. T/K. 3. Results and Discussion. 373 343 333 323 313 303. 40. 42. 44 2. 46. 48. 40. given temperatures in heating process. On the other hand, an XRD study for the 50 W–873 K-film was made with a conventional X-ray diffractmeter (Rigaku, RINT2000) at room temperature. Transmission electron microscopy (TEM) studies and composition analyses were carried out using a transmission electron microscope (JEOL, JEM-3010) equipped with an energy dispersive X-ray spectrometer (EDS). Thin foils for the TEM examinations were prepared by twin jet electropolishing in an electrolyte consisting of 20 vol%HNO3 – 80 vol%CH3 OH. The shape memory behavior of the constraint-aged 400 W– 1073 K-films was observed using a digital video camera (Sony, DCR-PC100) in a temperature range from 300 to 330 K. Heating of these films was performed with a lump at <0.04 K·s−1 , and cooling at <0.03 K·s−1 .. 42 2. Fig. 1 XRD profiles of the 400 W–1073 K-film in a temperature range from 303 to 373 K. (a) shows the reversible martensitic transformation in heating prosess and (b) shows the existence of MnO phase.. 3.1 Characteristics of heat-treated films Chemical compositions, martensitic transformation temperatures and Curie temperatures of the heat-treated films were controlled by the sputtering power and heat-treatment conditions.5) Their martensitic transformation temperatures increased with increasing nickel content, that is valence electron concentration (e/a). The valence electron configuration was assumed to be 3d8 4s2 for Ni, 3d5 4s2 for Mn and 4s2 4p1 for Ga. These configurations are commonly used in electronic band calculations for the Heusler alloys. The compositions of the 50 W–873 K-film and 400 W– 1073 K-film were Ni-23.4 mol%Mn–23.0 mol%Ga (e/a = 7.69) and Ni–24.6 mol%Mn–21.7 mol%Ga (e/a = 7.74), respectively.6) Although the martensitic transformation temperature of the 50 W–873 K-film was lower, that of the 400 W– 1073 K-film was higher than room temperature. The reasons why they are rather different in spite of the fact that nickel content (that is e/a) of each film is similar to each other will be that the nickel content in the matrix and the degree of order. A : 200MnO. Fig. 2 (a) selected area diffraction and (b) TEM dark field image using reflection spot A for the 400 W–1073 K-film at room temperature..
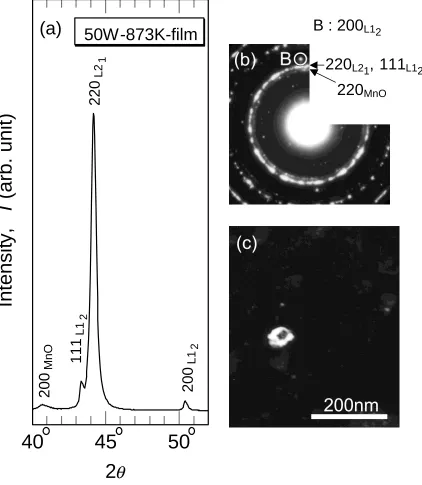
(3) Effect of Aging Time on Shape Memory Properties of Ni-rich Ni2 MnGa Alloy Films. in the film are different. Figures 1(a) and (b) show the XRD profiles of the 400 W– 1073 K-film in a temperature range from 303 to 373 K. Figure 1(b) enlarged intensity of the diffraction patterns in Fig. 1(a) around 2θ of 41◦ . In Fig. 1(a), three diffraction peaks representing the martensitic phase clearly appear in a temperature range from 303 to 323 K and the (220) diffraction peak of the parent phase (L21 structure) from 333 to 373 K. In Fig. 1(b), the (200) peak of the MnO phase appears around 2θ of 40.6◦ at all temperature range. Figures 2(a) and (b) show the serected area diffraction and the TEM dark field image using the (200) reflection spot of the MnO phase exhibited in A circle, respectively, for the 400 W–1073 K-film at room temperature. In Fig. 2(b), it can be confirmed that the MnO particles with the sizes of about 10 nm homogeneously distributed. 50W-873K-film 220 L2 1. (a). 863. in the matrix. These results indicate that the MnO particles always exist in the heat-treated films. Figures 3(a), (b) and (c) show the XRD profile, the selected area diffraction and the TEM dark field image using the reflection spot exhibited in B circle, respectively, for the 50 W– 873 K-film at room temperature. In Figs. 3(a) and (b), in addition to diffraction peaks and reflection spots representing the parent and MnO phase, two peaks and spots representing the phase with the crystal structure of L12 appear, respectively. In Fig. 3(c), it is confirmed that the precipitates with the sizes of about 50–100 nm occur in this film. Also, it was found by the EDS analysis that the composition of the precipitates was Ni–14.7 mol%Mn–13.3 mol%Ga. Consequently, on the heat-treatment at comparatively low temperature, the precipitation of a compound with the approximate compositions of. B : 200L12 220L21, 111L12. 40. 200 L1 2. 111 L1 2. 200 MnO. Intensity, I (arb. unit). 220MnO. 45 2. 50. Fig. 3 (a) XRD profile, (b) selected area diffraction and (c) TEM dark field image using reflection spot B for the 50 W–873 K-film at room temperature..
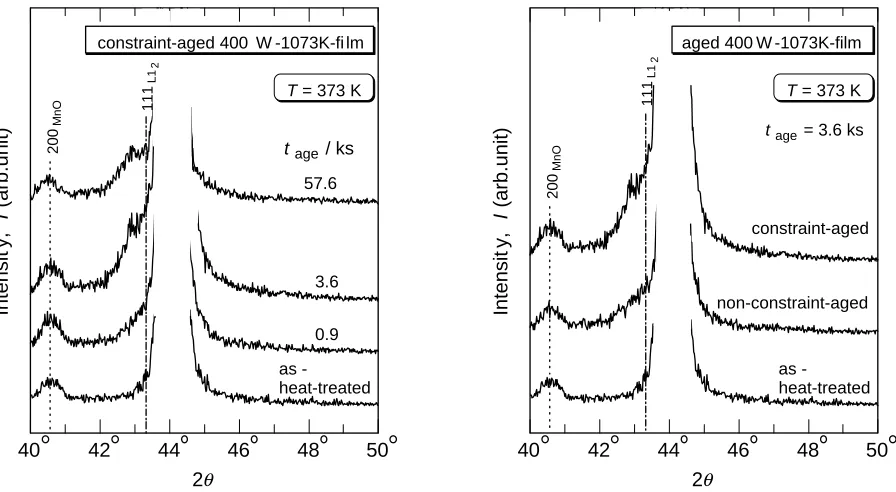
(4) 864. M. Suzuki et al.. Ni3 (Mn0.6 ·Ga0.4 ) with the crystal structure of L12 occurs in the films. On the precipitation of L12 , the nickel content in the matrix decreases, as a result, it is assumed that the martensitic transformation temperatures of this film decrease. 3.2 Characteristics of constraint-aged films Figures 4(a) and (b) show the TEM bright field image and the selected area diffraction of the 400 W–1073 K-films constraint-aged at 673 K for 432 ks. The TEM observation. was made at room temperature. It was observed in Fig. 4(a) that the fine particles with the sizes of about 10 nm homogeneously distributed into this film. Also, in addition to the strong reflection spots of the martensite phase, the (200) spot of the MnO phase and (111) spot of L12 were seen in C and D circles, respectively. Figures 4(c) and (d) show the TEM dark field images taken using the reflection spots in the C and D circles, respectively. Although the number of the precipitates with the crystal structure of L12 is smaller than the. D : 111L12 C : 200MnO. Fig. 4 (a) TEM bright field image, (b) selected area diffraction, (c) TEM dark field image using reflection spot C and (d) TEM dark field image using reflection spot D for the constraint-aged 400 W–1073 K-film (tage = 432.0 ks) at room temperature.. aged 400 W -1073K-film 111 L1 2. T = 373 K. 57.6. 3.6. 200 MnO. t age / ks. T = 373 K t age = 3.6 ks. Intensit y, I (arb.unit). Intensit y, I (arb.unit). 200 MnO. 111 L1 2. constraint-aged 400 W -1073K-fi lm. constraint-aged. non-constraint-aged. 0.9 as heat-treated. as heat-treated. 40. 42. 44. 46 2. 48. 50. 40. 42. 44. 46. 48. 50. 2. Fig. 5 Effect of aging time on XRD profiles for the constraint-aged Fig. 6 Effect of aging method on XRD profiles for the aged 400 W–1073 K-films (tage = 3.6 ks) at 373 K. 400 W–1073 K-films at 373 K..
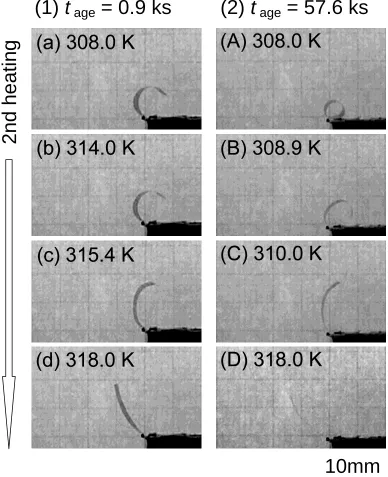
(5) Effect of Aging Time on Shape Memory Properties of Ni-rich Ni2 MnGa Alloy Films. MnO phase, the fine precipitates homogeneously distributed into this film as seen in Figs. 3(c) and (d). Consequently, on constraint-aging at 673 K for 432 ks, the precipitation of L12 takes place in the 400 W–1073 K-film. Figure 5 shows XRD profiles for the 400 W–1073 K-film constraint-aged at 673 K for 0.9 to 57.6 ks. The XRD measurements were made while the films were held at 373 K. In addition to the diffraction peaks representing the parent phase and the MnO phase, a very weak diffraction peak representing the precipitation of L12 appears slightly around 2θ of 43.3◦ in the profiles of the 400 W–1073 K-films constraint-aged for 3.6 and 57.6 ks. Furthermore, a weak diffraction peak appears around 2θ of 43◦ in the profiles of all the constraintaged 400 W–1073 K-film samples. This diffraction peak becomes strong with increasing aging time.. Figure 6 shows XRD profiles for the 400 W–1073 K-films non-constraint-aged and constraint-aged at 673 K for 3.6 ks. The XRD measurements were made while the films were held at 373 K. Although a weak diffraction peak appears around 2θ of 43◦ in the profile of the constraint-aged 400 W–1073 Kfilm, it doesn’t appear in the profile of the non-constraint-aged 400 W–1073 K-film. As a result of the XRD studies, it is considered that the phase corresponding to this peak may be a stress-induced martensitic one. 3.3 Effect of aging time on shape memory properties The 400 W–1073 K-films after constraint-aging at 673 K for 0.9–57.6 ks were taken out of the silica tube and heated or cooled in a temperature range around the martensitic transformation temperatures. Figures 7(1) and (2) show the changes. (2) t age = 57.6 ks. 2nd heating. (1) t age = 0.9 ks. 865. 10mm Fig. 7 Effect of aging time on shape memory behavior for the constraint-aged 400 W–1073 K-films in the 2nd heating stage. (1) tage = 0.9 ks and (2) tage = 57.6 ks..
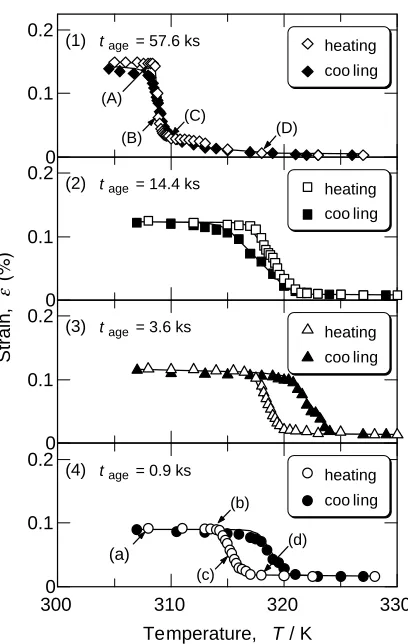
(6) 866. M. Suzuki et al.. 0.2. (1) t age = 57.6 ks. geneous stress fields in the constraint-aged 400 W–1073 Kfilms. When the aging time is short, the stress-induced martensitic phase is considered to be mainly responsible for the TWME of the constraint-aged 400 W–1073 K-films. Also, the precipitates are considered to be responsible for it with increasing aging time. The MnO particles may have no effect on the TWME because they always exist in the 400 W–1073 Kfilms. A further study is needed to clarify its mechanism.. heating coo ling. 0.1. (A) (C). (D). (B). 0 0.2. (2) t age = 14.4 ks. heating coo ling. 4. Summary. Strain,. 0.1 0 0.2. (3) t age = 3.6 ks. heating coo ling. 0.1 0 0.2. (4) t age = 0.9 ks. heating coo ling. (b). 0.1 (d). (a). 0 300. (c). 310. 320. 330. Temperature, T / K Fig. 8 Effect of aging time on temperature-strain curves for the constraint-aged 400 W–1073 K-films in the 2nd heating and cooling stages. (A)–(D) in (1) and (a)–(d) in (4) correspond to (A)–(D) in Fig. 7(2) and (a)–(d) in Fig. 7(1), respectively.. in the shape of 400 W–1073 K-films constraint-aged for 0.9 and 57.6 ks, respectively, in the 2nd heating. Figure 8 shows the temperature-strain curves obtained from the shape change in the 2nd thermal cycling. The strain at the outer surface was given by ε = (dS /2)/r T , where dS is the thickness of films and r T is the radius of a curvature for the bent films at each temperature. It is clear that the constraint-aged 400 W– 1073 K-films show the TWME. The width of thermal hysteresis, which decreases with increasing aging time, is about 2 K when the aging time is 57.6 ks. Also, the reversible strain increases with increasing aging time. Furthermore, the temperatures of the shape change increase with increasing aging time up to 14.4 ks, then, they decrease with increasing aging time. These results suggest that both of the stress-induced martensitic phase and the precipitates exist as the inhomo-. Ni-rich Ni2 MnGa films were deposited on an Al2 O3 substrate with a RF magnetron sputtering apparatus using a Ni52 Mn24 Ga24 target. The occurrence of precipitates and the effect of aging time on shape memory properties were investigated at various constraint-aging method. The obtained results are summarized as follows: (1) The fine precipitates with crystal structure of L12 occured in the constraint-aged 400 W–1073 K-films by aging for a long period. (2) The thermal hystersis on the TWME of the constraintaged 400 W–1073 K-films decreases with increasing aging time. (3) The reversible strain on the TWME of constraint-aged 400 W–1073 K-films increases with increasing aging time. Acknowledgements The authors are grateful to Prof. T. Suzuki, Faculty of Engineering, Tohoku Gakuin University, for the measurement of XRD. This study was supported by Industrial Technology Research Grant Program in ’01 from New Energy and Industrial Technology Development Organization (NEDO) of Japan. REFERENCES 1) P. J. Webster, K. R. A. Ziebeck, S. L. Town and M. S. Peak: Philos. Mag. B 49 (1984) 295–310. 2) J. Pons, V. A. Chernenko, R. Santamarta and E. Cesari: Acta Mater. 48 (2000) 3027–3038. 3) B. Wedel, M. Suzuki, Y. Murakami, C. Wedel, T. Suzuki, D. Shindo and K. Itagaki: J. Alloys Comp. 290 (1999) 137–143. 4) K. Ullakko: J. Mater. Eng. Perform. 5 (1996) 405–409. 5) K. Ohi, S. Isokawa, M. Ohtsuka, M. Matsumoto and K. Itagaki: Trans. Mater. Res. Soc. Japan 26 (2001) 291–294. 6) M. Ohtsuka and K. Itagaki: Int. J. Appl. Electromagn. Mech. 11 (2000) 49–59. 7) M. Ohtsuka, M. Matsumoto and K. Itagaki: Trans. Mater. Res. Soc. Japan 26 (2001) 201–204. 8) S. Isokawa, M. Suzuki, M. Ohtsuka, M. Matsumoto and K. Itagaki: Mater. Trans. 42 (2001) 1886–1889..
(7)
Figure

+2
Related documents
