Article
Post-Modified Polypeptides with UCST-Type
Behavior for Control of Cell Attachment in
Physiological Conditions
Xuan Xue1,†, Lalitha Thiagarajan1,† ID, James E. Dixon1, Brian R. Saunders2,*, Kevin M. Shakesheff1,* and Cameron Alexander1,*
1 School of Pharmacy, the University of Nottingham, University Park, Nottingham NG7 2RD, UK;
[email protected] (X.X.); [email protected] (L.T.); [email protected] (J.E.D.)
2 School of Materials, the University of Manchester, Manchester M13 9PL, UK
* Correspondence: [email protected] (B.R.S.); [email protected] (K.M.S.); [email protected] (C.A.); Tel.: +44-161-306-5944 (B.R.S.); +44-115-951-5104 (K.M.S.); +44-115-846-7678 (C.A.)
† These authors contributed equally to this work.
Received: 29 November 2017; Accepted: 5 January 2018; Published: 9 January 2018
Abstract: Upper Critical Solution Temperature (UCST)-type thermally responsive polypeptides (TRPs) with phase transition temperatures around 37◦C in phosphate-buffered saline (PBS) buffer (pH 7.4, 100 mM) were prepared from poly(L-ornithine) hydrobromide and coated on non-tissue culture-treated plastic plates (nTCP). Cell adhesion was observed at temperatures above the phase transition temperature of the coating polymer (39◦C), while cell release was triggered when the culture temperature was switched to 37◦C. Approximately 65% of the attached cells were released from the surface within 6 h after changing the temperature, and more than 96% of the released cells were viable. Water contact angle measurements performed at 39 and 37◦C demonstrated that the surface hydrophobicity of the new TRP coatings changed in response to applied temperature. The cell attachment varied with the presence of serum in the media, suggesting that the TRP coatings mediated cell attachment and release as the underlying polymer surface changed conformation and consequently the display of adsorbed protein. These new TRP coatings provide an additional means to mediate cell attachment for application in cell-based tissue regeneration and therapies.
Keywords:UCST polymer; thermo-responsive polypeptides; controlled cell attachment
1. Introduction
Controlled delivery of specific cells to correct defective or damaged tissue has become a significant research goal in tissue regenerative therapies. However, design of supports to promote cell attachment is highly complex and the determinants of cell adhesion range from surface charge [1,2], hydrophilic/hydrophobic balance [1,3–7], functional group type and content [1,7–9], to surface roughness and topology [10,11]. For cell culture and delivery applications, it is usually important to generate materials which exhibit high cellular affinity during the cell growth and transport stages, but low affinity when the cells are in their desired site of action or expansion. It is also desirable to be able to switch on or off these cell surface interactions via a simple stimulus, as traditional cell harvesting methods (e.g., high shear or proteases) are not applicable in vivo.
Synthetic polymers have many properties which can be systematically altered, and thus have advantages over natural polymers when tuning of function is required. Certain polymers exhibit changes of solubility in aqueous solutions in response to changes in temperature, and those
materials with Lower Critical Solution Temperature (LCST)-type phase transitions, have been widely studied for tissue engineering [12,13], drug delivery [14,15], and cellular binding [8,9,16]. However, there has been relatively little work focused on polymers with Upper Critical Solution Temperature (UCST)-type phase transition behavior for these applications. The limited evaluation of UCST transitions in practical applications to date is possibly because only a few polymers exhibit UCST behavior in aqueous media [17–21]. PNAGAm (poly(N-acryloyl glycinamide)) and related materials (e.g., poly(N-acryloylasparaginamide), PNAAAm) have been the most studied reversible hydrogen bonding based UCST polymers, as a result of their phase transitions being adjustable to body temperature in ionic solutions [19,20,22,23]. For biomedical applications, examples have been demonstrated for PNAGAm based hydrogels as thermo-responsive drug delivery systems [24], but not for controllable cell culture and delivery. However, we have recently shown that variants of PNAGAm based polymer brushes may be suitable for applications in tissue engineering and regenerative medicine through temperature-controlled cell attachment [25]. On the other hand, of particular note is the controlled UCST-type behavior for ureido-modified polypeptide poly(L-ornithine)-co-poly(L-citrulline) (POC) under physiological conditions, the transition temperature of which can be adjusted up to 31◦C by ureido content [26]. Importantly, modified polypeptides of this type potentially offer the advantages of biocompatibility, biodegradability and cellular affinity, allowing them to be good candidate materials for cell delivery.
Here, we report the synthesis and characterization of polypeptides with UCST-type behavior, utilizing ureido and methyl isocyanate modification of poly(L-ornithine) hydrobromide. The resultant materials showed reversible phase separation from phosphate-buffered saline (PBS) buffer (pH 7.4, 100 mM) at physiological temperatures. The polymer was adsorbed from solution to coat non tissue culture treated plastic plate (nTCP) at its transition temperature (39◦C). The resultant coating gave similar 3T3 cell attachment at 39◦C to uncoated cell culture treated plastic, while cell detachment was triggered by a temperature change to 37◦C. Approximately 65% of attached cells were released within 6 h in response to the temperature change and more than 96% of the released cells were viable at all tested time points.
2. Results
2.1. Synthesis and Characterization of Modified Polypeptides
(NHCHCH2CH2CH2). The actual grafting percentage of methyl urea was calculated by comparing the integral of the methyl signal (peak e to that of polypeptide backbone signal (peak a). The corresponding grafting percentage of ureido functionality was determined through first calculating the total actual ratio of methyl urea and ureido groups via comparing the integral of methylene signal (from both methyl urea and ureido modification, peak d’ and d”) to that of the polypeptide backbone signal, and then subtracting the ratio contributed from the methyl urea modification. The actual percentage of amino residue was difficult to calculate directly from1H-NMR spectra, and therefore was evaluated by subtracting the mol.% of methyl urea and ureido modification from 100% (Table1). The number of amino residues was very small in Polymer3, so that peak (d) assigned to methylenes adjacent to amino groups was difficult to detect clearly in the NMR spectrum. Accordingly, the structure of Polymer3 was further characterized by 2D13C-HSQC spectrum (400 Hz, D2O at 70◦C). (Figure S3)δ(ppm): 57 (polypeptide backbone: NHCHCO), 40 (methyl isocyanate or ureido modification: CH2CH2NHCO), 28 (NHCHCH2CH2CH2) and 26 (NHCHCH2CH2CH2).
In addition, poly(ethylene glycol)-grafted-poly(L-lysine) (PEG-g-PLL) was synthesized by addition of 0.9 eq. (molar ratio to amino groups) of mPEG-NHS to PLL in buffer solution according to the literature [27]. 50 mM of sodium tetraborate buffer solution (pH 8.5) was used to deprotonate the amino groups of lysine. The reaction was completed within 6 h at room temperature. The polymers were purified by dialysis against water and then lyophilized. The PEG-g-PLL product was characterized by1H-NMR spectroscopy (400 Hz, D2O). The actual grafting percentage of PEG was determined from the NMR spectrum (Figure S4 for Polymer4and Table1).
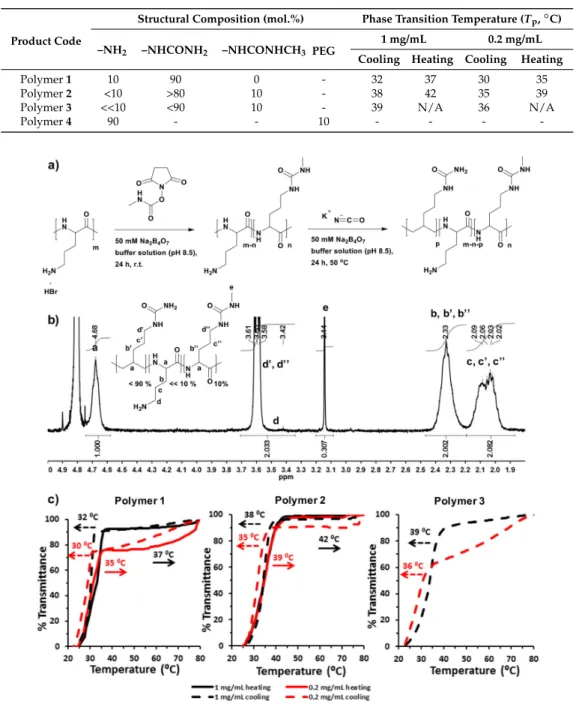
Table 1.Summary of the structural composition of polymers synthesized and their phase transition temperatures in phosphate-buffered saline (PBS) buffer (100 mM, pH 7.4).
Product Code
Structural Composition (mol.%) Phase Transition Temperature (Tp,◦C)
–NH2 –NHCONH2 –NHCONHCH3 PEG
1 mg/mL 0.2 mg/mL Cooling Heating Cooling Heating
Polymer1 10 90 0 - 32 37 30 35
Polymer2 <10 >80 10 - 38 42 35 39
Polymer3 <<10 <90 10 - 39 N/A 36 N/A
Polymer4 90 - - 10 - - -
-Materials 2018, 11, 95 4 of 16
Figure 1. (a) Synthesis route of N-succinimidyl N-methylcarbamate modified poly(L -ornithine)-co-poly(L-citrulline) (POC) produced by a two-step reaction; (b) 1H-NMR (400 Hz, D2O) spectrum of
Polymer 3 recorded at 70 °C; (c) Absorbance curves of Polymer 1, Polymer 2 and Polymer 3 in 100 mM PBS buffer (pH 7.4). Transmittance at 500 nm of thermally responsive polypeptides (TRPs) solutions were measured at a scanning rate of 1 °C from 25 to 80 °C, and reverse experiments from 80 to 25 °C. Two polymer concentrations (1 mg/mL and 0.2 mg/mL) were measured. Please provide a high-resolution figure.
2.2. Preparation and Characterization of Polymer Coated Substrates
The protocol used here to coat polymers onto the non-tissue culture treated plastic plate (nTCP) wells was modified from that used for coating PLO as recommended by the manufacturers. The concentration of all the polymer solution was 1 mg/mL in deionized H2O. Solutions of Polymer 1, 2,
and 3 were heated (~50 °C) until solutions were completely clear, and then filtered through a 0.2 μm membrane to ensure sterility. This solution was added immediately to the wells. For 24-well plates, 300 μL of this solution was added to fully cover the well. The handling time was kept short, and the plate was incubated overnight at 39 °C (all the polymer solutions were transparent at this temperature), in order to avoid phase separation during the coating time. The supernatants were removed from the wells after incubation. The wells were rinsed with PBS to remove the incompletely adsorbed polymers from the surfaces. The coated plate was dried in air in the fume hood, and was stored at room temperature.
To confirm successful coating, polymers were attached onto plastic coverslips using the same protocol. Mass spectral analyses were used to characterize ions specific to coated surface chemistries. Time of Flight Secondary Ion Mass Spectrometry (ToF-SIMS) data demonstrated a clearly
Figure 1. (a) Synthesis route ofN-succinimidyl N-methylcarbamate modified poly(L -ornithine)-co-poly(L-citrulline) (POC) produced by a two-step reaction; (b)1H-NMR (400 Hz, D
2O) spectrum of Polymer3recorded at 70◦C; (c) Absorbance curves of Polymer1, Polymer2and Polymer3in 100 mM PBS buffer (pH 7.4). Transmittance at 500 nm of thermally responsive polypeptides (TRPs) solutions were measured at a scanning rate of 1◦C from 25 to 80◦C, and reverse experiments from 80 to 25◦C. Two polymer concentrations (1 mg/mL and 0.2 mg/mL) were measured.
2.2. Preparation and Characterization of Polymer Coated Substrates
300µL of this solution was added to fully cover the well. The handling time was kept short, and the plate was incubated overnight at 39◦C (all the polymer solutions were transparent at this temperature), in order to avoid phase separation during the coating time. The supernatants were removed from the wells after incubation. The wells were rinsed with PBS to remove the incompletely adsorbed polymers from the surfaces. The coated plate was dried in air in the fume hood, and was stored at room temperature.
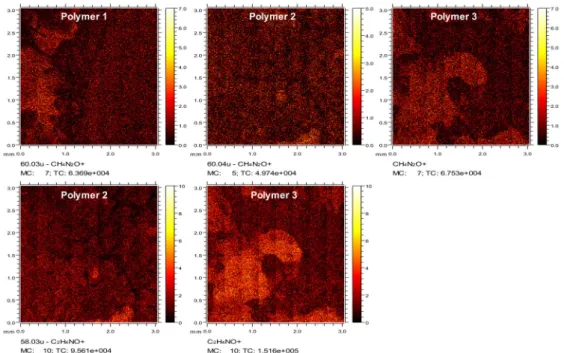
To confirm successful coating, polymers were attached onto plastic coverslips using the same protocol. Mass spectral analyses were used to characterize ions specific to coated surface chemistries. Time of Flight Secondary Ion Mass Spectrometry (ToF-SIMS) data demonstrated a clearly distinguishable CH4N2O+peak due to ureido modification for Polymer1,2and3, which was negligible for uncoated and PLO, PLL or Polymer4-coated surfaces. The thin layer distribution of CH4N2O+ was seen in the ToF-SIMS images. (Figure 2a) Additional secondary ions were identified in the spectra that reinforced the identification of ureido modification, including CH2NO+ and CNO− (Figure S5a). Polymer2and3-coated surfaces showed C2H4NO+and CH6N+peaks from the methyl urea formed byN-succinimidylN-methylcarbamate modification, which was not observed in other surfaces. (Figure2a and Figure S5b). Also, images showed the distribution of the thin layer for ion C2H4NO+in Polymer2and3coated surfaces (Figure2a). Again, the successful coating of Polymer4, with distinct peaks C5H2O2−and C5H3O3−assigned to the PEG modification, was also confirmed by ToF-SIMS (Figure S5c).
Materials 2018, 11, 95 5 of 16
distinguishable CH4N2O+ peak due to ureido modification for Polymer 1, 2 and 3, which was
negligible for uncoated and PLO, PLL or Polymer 4-coated surfaces. The thin layer distribution of CH4N2O+ was seen in the ToF-SIMS images. (Figure 2a) Additional secondary ions were identified in
the spectra that reinforced the identification of ureido modification, including CH2NO+ and CNO−
(Figure S5a). Polymer 2 and 3-coated surfaces showed C2H4NO+ and CH6N+ peaks from the methyl
urea formed by N-succinimidyl N-methylcarbamate modification, which was not observed in other surfaces. (Figures 2a and S5b). Also, images showed the distribution of the thin layer for ion C2H4NO+
in Polymer 2 and 3 coated surfaces (Figure 2a). Again, the successful coating of Polymer 4, with distinct peaks C5H2O2− and C5H3O3− assigned to the PEG modification, was also confirmed by
ToF-SIMS (Figure S5c).
Figure 2. ToF-SIMS of polymer coated plastic coverslips. Images of secondary ion CH4N2O+ of ureido
groups on Polymer 1, 2, and 3-coated surfaces and the secondary ion C2H4NO+ from methyl urea
substitution on Polymer 2 and 3-coated surfaces. Please provide a high-resolution figure.
2.3. Screening Coating Polymers for Cell Attachment
The murine fibroblast cell line NIH-3T3 was used to assess the effect of polymer coated surfaces at various temperatures for cell attachment. As mentioned above, Polymers 1, 2, and 3 showed UCST-type behavior, with indicative Tp values of 32, 38 and 39 °C in PBS, respectively. Non-thermally
responsive polymers such as PLL and PLO was used as controls for temperature dependent cell release. TCP and uncoated nTCP were used as the positive and negative controls for cell attachment. 3T3 cells (1 × 10⁵ cells per well) were seeded onto coated and uncoated wells and incubated at 37 °C
overnight. Maximum cell attachment was observed in TCP followed by PLL, PLO, Polymer 1 and 2 coated nTCP, whereas fewer cells were attached in Polymer 3 coated in nTCP. It was also observed that cells preferred to aggregate before attaching to Polymer 3 coated surfaces at 37 °C. Poor cell attachment was observed in Polymer 4 coated nTCP. (Figure 3a) Floating cell aggregates could be observed in Polymer 4 coated wells, and very few cells were actually attached to the surface. We attribute this to the existence of hydrophilic PEG spacers on the surface, as expected. Therefore, Polymer 3 was the only thermally-responsive polymer that showed cell repulsive properties at body temperature (37 °C). Cell attachment was also observed in uncoated nTCP (negative control) surfaces upon longer incubation, due to the high inherent attachment ability of 3T3 cells.
The initial data suggested that Polymer 3 is the most suitable candidate as a coating material that might repel cells from adhesion at body temperature and promote cell attachment at a different temperature. As the phase transition temperature of Polymer 3 (1 mg/mL) in PBS was 39 °C, we
Figure 2.ToF-SIMS of polymer coated plastic coverslips. Images of secondary ion CH4N2O+of ureido groups on Polymer1,2, and3-coated surfaces and the secondary ion C2H4NO+from methyl urea substitution on Polymer2and3-coated surfaces. Please provide a high-resolution figure.
2.3. Screening Coating Polymers for Cell Attachment
Materials 2018,11, 95 6 of 17
nTCP, whereas fewer cells were attached in Polymer3coated in nTCP. It was also observed that cells preferred to aggregate before attaching to Polymer3coated surfaces at 37◦C. Poor cell attachment was observed in Polymer4coated nTCP. (Figure3a) Floating cell aggregates could be observed in Polymer4coated wells, and very few cells were actually attached to the surface. We attribute this to the existence of hydrophilic PEG spacers on the surface, as expected. Therefore, Polymer3was the only thermally-responsive polymer that showed cell repulsive properties at body temperature (37◦C). Cell attachment was also observed in uncoated nTCP (negative control) surfaces upon longer incubation, due to the high inherent attachment ability of 3T3 cells.
wanted to assess cell attachment at this temperature. It has been shown before that most cell types can survive and maintain a fairly constant growth rate and metabolic activity at 39 °C [28,29]. As shown in Figure 3b microscope images of Phalloidin stained cells, the number of cells adhering onto Polymer 3 coated surface was comparable to that imaged on TCP (positive control) after 24 h of culturing at 39 °C. The metabolic activity, percentage of metabolically active cells and attachment of the 3T3 cells were then further quantified by Presto Blue assays, Trypan Blue assays and manual counts from microscopy images. No significant change in metabolic activity was observed between cells cultured on TCP and on Polymer 3 coated plates. Metabolic activity was slightly higher at 39 °C. It has been shown that metabolic activity of cells increases with temperature until cell-damaging temperatures over 40 °C [30]. Furthermore, the attached cells were trypsinized and counted using Trypan Blue to assess viability. It was found that, for these three parameters, the behaviors of 3T3 cells on Polymer 3 were similar to those on TCP in most of the cases after 24 h incubation at 37 and 39 °C, respectively. However, the cell attachment on Polymer 3 (71 ± 6.2%) was much lower than that on TCP (96 ± 2.8%) after 24 h incubation at 37 °C. (Figure 4c) This was in accord with the observation from microscopy (Figure 3a, Polymer 3) that cells did not properly adhere on Polymer 3 coated surfaces at 37 °C and preferred to aggregate before attaching.
Figure 3. (a) Microscopy images of 3T3 cells taken after 24 h of culture on polymer-coated and -uncoated surfaces at 37 °C. Polymer 3 and Polymer 4-coated nTCP were observed to be cell repellent at this screening temperature; (b) Microscope images of phalloidin-stained 3T3 cells taken after 24 h culture on uncoated TCP (Pos. Ctrl.) and Polymer 3 coated nTCP at 39 °C. Polymer 3-coated surfaces showed a comparable number of cells attached at this temperature to that of Pos. Ctrl. (black scale bar = 100 μm, white scale bar = 150 μm); (c) The metabolic activity (left), percentage of viability (middle) and percentage of attachment of 3T3 cells measured after 24 h culture on either TCP or Polymer 3 -coated nTCP at 37 and 39 °C, respectively (n = 3). Statistical significance was determined using one-way analysis of variance (ANOVA), α = 0.05; * p≤ 0.05; ** p≤ 0.005. Error bars indicate standard deviation (SD).
Figure 3.(a) Microscopy images of 3T3 cells taken after 24 h of culture on polymer-coated and -uncoated surfaces at 37◦C. Polymer3and Polymer4-coated nTCP were observed to be cell repellent at this screening temperature; (b) Microscope images of phalloidin-stained 3T3 cells taken after 24 h culture on uncoated TCP (Pos. Ctrl.) and Polymer3coated nTCP at 39◦C. Polymer3-coated surfaces showed a comparable number of cells attached at this temperature to that of Pos. Ctrl. (black scale bar = 100µm, white scale bar = 150µm); (c) The metabolic activity (left), percentage of viability (middle) and percentage of attachment of 3T3 cells measured after 24 h culture on either TCP or Polymer3-coated nTCP at 37 and 39◦C, respectively (n= 3). Statistical significance was determined using one-way analysis of variance (ANOVA),α= 0.05; *p≤0.05; **p≤0.005. Error bars indicate standard deviation (SD).
coated surface was comparable to that imaged on TCP (positive control) after 24 h of culturing at 39◦C. The metabolic activity, percentage of metabolically active cells and attachment of the 3T3 cells were then further quantified by Presto Blue assays, Trypan Blue assays and manual counts from microscopy images. No significant change in metabolic activity was observed between cells cultured on TCP and on Polymer3coated plates. Metabolic activity was slightly higher at 39◦C. It has been shown that metabolic activity of cells increases with temperature until cell-damaging temperatures over 40◦C [30]. Furthermore, the attached cells were trypsinized and counted using Trypan Blue to assess viability. It was found that, for these three parameters, the behaviors of 3T3 cells on Polymer3 were similar to those on TCP in most of the cases after 24 h incubation at 37 and 39◦C, respectively. However, the cell attachment on Polymer3(71±6.2%) was much lower than that on TCP (96±2.8%) after 24 h incubation at 37◦C. (Figure4c) This was in accord with the observation from microscopy (Figure3a, Polymer3) that cells did not properly adhere on Polymer3coated surfaces at 37◦C and preferred to aggregate before attaching.Materials 2018, 11, 95 7 of 16
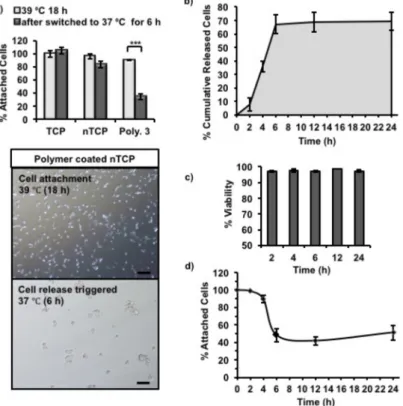
Figure 4. 3T3 cell release from Polymer 3-coated nTCP was triggered by switching incubation temperature from 39 °C to 37 °C. (a) The column graph showed the percentage of attached cells on Polymer 3-coated nTCP, uncoated nTCP (Neg. Ctrl.) and uncoated TCP (Pos. Ctrl.) before and after cell release (6 h). Microscopy images of attached 3T3 cells on Polymer 3 coated nTCP were taken at the same time points (scale bar = 100 μm). Statistical significance was determined using one-way ANOVA, α = 0.05; * p≤ 0.05; ** p≤ 0.005; *** p≤ 0.001. Error bars indicate standard deviation (SD). (b) The percentage of cumulative released cells with time was calculated from the results of CyQUANT assay; (c) The percentage of viable cells in the total number of released cells was calculated with the data obtained from Trypan blue assay; (d) The percentage of remaining attached cells on the surface at fixed intervals was calculated from Presto blue assay data (n = 3 independent experiments were performed in duplicate wells).
2.4. Temperature Triggered Cell Release
Cells cultured on Polymer 1, 2, and 3-coated nTCP at 39 °C were transferred to 37 °C to assess the temperature dependent cell releasing ability of the polymers. Among the three polymers, only Polymer 3 showed the temperature-dependent cell release, and hence it was investigated further. Initially, 3T3 cells were cultured on Polymer 3-coated nTCP at 39 °C for 18 h, which gave sufficient time for cells to attach. The cell release was then triggered by switching the culture temperature from 39 to 37 °C. In Figure 4a, the percentage of attached cells on Polymer 3-coated nTCP was compared to those on uncoated nTCP (Negative control) and TCP (Positive control). The cell attachment on Polymer 3 coated nTCP after incubation at 39 °C for 18 h was 90 ± 1% of the total number of cells seeded, which was slightly lower than the control surfaces (TCP: 100 ± 5%, nTCP: 96 ± 3.8%). After switching the incubation temperature to 37 °C for 6 h, only 34 ± 4% of the initially attached cells remained on the Polymer 3 coated surface. In Figure 4a, the microscope images showed the differences in cell attachment on Polymer 3 coated nTCP at these two time points. It can be seen from the images that right before cell release was triggered (cell attachment at 39 °C for 18 h) most of the cells were attached on the coated surfaces without showing significant cell aggregation. The same can be observed in the Live/Dead stained cells in Figure S6. After cell release was triggered for 6 h at 37 °C, fewer cells were observed to stay on the surface, but the remaining attached cells were spread out. Incorrect citation order.
The cells released from the Polymer 3 surfaces after the temperature change were collected at specific times points (2, 4, 6, 12, and 24 h). As the cells aggregate after detaching from the polymer
Figure 4. 3T3 cell release from Polymer 3-coated nTCP was triggered by switching incubation temperature from 39◦C to 37◦C. (a) The column graph showed the percentage of attached cells on Polymer3-coated nTCP, uncoated nTCP (Neg. Ctrl.) and uncoated TCP (Pos. Ctrl.) before and after cell release (6 h). Microscopy images of attached 3T3 cells on Polymer3coated nTCP were taken at the same time points (scale bar = 100µm). Statistical significance was determined using one-way ANOVA,α= 0.05; *p≤0.05; **p≤0.005; ***p≤0.001. Error bars indicate standard deviation (SD). (b) The percentage of cumulative released cells with time was calculated from the results of CyQUANT assay; (c) The percentage of viable cells in the total number of released cells was calculated with the data obtained from Trypan blue assay; (d) The percentage of remaining attached cells on the surface at fixed intervals was calculated from Presto blue assay data (n= 3 independent experiments were performed in duplicate wells).
2.4. Temperature Triggered Cell Release
only Polymer3showed the temperature-dependent cell release, and hence it was investigated further. Initially, 3T3 cells were cultured on Polymer3-coated nTCP at 39◦C for 18 h, which gave sufficient time for cells to attach. The cell release was then triggered by switching the culture temperature from 39 to 37◦C. In Figure4a, the percentage of attached cells on Polymer3-coated nTCP was compared to those on uncoated nTCP (Negative control) and TCP (Positive control). The cell attachment on Polymer3 coated nTCP after incubation at 39◦C for 18 h was 90 ±1% of the total number of cells seeded, which was slightly lower than the control surfaces (TCP: 100±5%, nTCP: 96±3.8%). After switching the incubation temperature to 37◦C for 6 h, only 34±4% of the initially attached cells remained on the Polymer3coated surface. In Figure4a, the microscope images showed the differences in cell attachment on Polymer3coated nTCP at these two time points. It can be seen from the images that right before cell release was triggered (cell attachment at 39◦C for 18 h) most of the cells were attached on the coated surfaces without showing significant cell aggregation. The same can be observed in the Live/Dead stained cells in Figure S6. After cell release was triggered for 6 h at 37◦C, fewer cells were observed to stay on the surface, but the remaining attached cells were spread out. Incorrect citation order.
The cells released from the Polymer3surfaces after the temperature change were collected at specific times points (2, 4, 6, 12, and 24 h). As the cells aggregate after detaching from the polymer surface, the cells were individualized using trypsin and viability was determined using Trypan blue. To cross validate the exact cell numbers, the released cells were quantified in a plate reader using CyQUANT NF dye. The cumulative number of cells released overtime was quantified using CyQUANT (DNA-based quantification) assay and by manual counting were shown in Figure4b and Figure S7, respectively. As can be seen, it took about 2 h for the cells to sense and respond to the surface change and very few cells were actually released during this period. After 2 h, cells started to release from the surface at a relatively high rate, more than 60% of attached cells were released during the next 4 h. The cell release rate was slower after 6 h and the release rate was insignificant towards the end of the experiment (24 h). It should be noted that the viability of released cells was higher than 96% at all tested time points as quantified by Trypan blue assay (Figure4c), indicating no significant cytotoxicity resulting from the change in Polymer3conformation. In addition, the metabolic activity of remaining attached cells was measured with Presto blue assays, which indirectly quantified the number of remaining attached cells on the coated surface. As shown in Figure4d, the percentage of remaining attached cells decreased with time during the first 6 h at 37◦C, which was in an agreement with the increased number of cumulatively released cells during the same period. However, a small increase of the number of attached cells was observed after incubation at 37◦C for about 10 h. It is likely that the remaining attached cells started to proliferate during this time, which explains the slight increase in Presto blue measurements towards the 24 h time point.
3. Discussion
It was anticipated that the phase transition temperatures of Polymers1and2were lower or just in between the applied temperatures and the solubility of these polymers would not vary much due to such a small temperature change. However, the chains of Polymer3were expected to vary in conformation across the assay as the phase transition temperature of Polymer3was close 39◦C on cooling cycles. Therefore, we believe that this temperature related surface hydrophobicity change of Polymer3was the cause of cell release when altering the culture temperature. As expected, uncoated plastic coverslips used as control surfaces did not show temperature-dependent behavior.Materials 2018, 11, 95 9 of 16
Figure 5. (a) Water contact angle measured on plastic coverslips with and without polymer coatings on top at 37 and 39 °C. Column graphic comparison of static water contact angles between differently coated samples measured with at least 4 repeats. (b) The percentage of Polymer 3 remained on the surface after culturing for 6 h at 37 and 39 °C compared to the amount of Polymer 3 right after coating at 39 °C overnight (name: coated) which was set to be 100% in this experiment (n = 3). Statistical significance was determined using one way ANOVA, α = 0.05. Error bars indicate standard deviation (SD).
To evaluate protein adsorption on polymer coated surfaces, nTCPs were used as the substrates for polymer coating and as a negative control. TCPs were used as positive control to compare the effect of polymer coating investigated. Polymer 4 was used as a non thermoresponsive control coating polymer. The protein resistance of Polymer 4 is from the low fouling non-ionic polyethylene glycol (PEG) at its surface. A relatively high concentration of (Monomeric red fluorescent protein1) mRFP1 solution (200 μg/mL) was used in this experiment in order to give readable fluorescent intensities of mRFP1 as its surface adsorption was low. Proteins were allowed to adsorb on surfaces over 24 h to ensure that the adsorption reached a maximum [33]. In order to evaluate the correlation between protein adsorption and its charge, two variant mRFP1s, with both positive (pI = 9.66) and negative (pI = 5.65) net overall charges in deionized H2O solution at pH 7, were incubated in coated wells at
37 °C for 24 h, and handling time thereafter was reduced as short as possible. The supernatants from each well were therefore removed after incubation. The plates were rinsed with copious amount of PBS twice and deionized water once to remove all the improperly adsorbed protein. The emission collection band width in our assay spanned the excitation wavelength, therefore the excitation wavelength was set up to be 620 nm, instead of 607 nm as reported elsewhere [34].
As shown in Figure 6a, the fluorescence intensities from adsorbed protein were normalized and therefore giving the same readings of negative control between different experiments. Poly(L -ornithine) (PLO)-coated surfaces showed the highest fluorescence intensities from adsorbed mRFP1, and therefore indicated significant enhancement of protein adhesion compared to uncoated nTCP (negative control). The fluorescence intensities from adsorbed mRFP1 with either charge on Polymer 1 coated surfaces were higher than those with Polymer 2 coatings which were higher than those coated with Polymer 3. These results suggest that the chemical modification, to some extent, conferred protein resistance to Polymers 1–3 compared to unmodified PLO. The more hydrophobic polymers with fewer primary amines demonstrated reduced protein attachment. The fluorescence intensities of Polymer 3 and 4 coated surfaces were significantly lower than those of uncoated nTCP (negative control) and TCP (positive control), indicating detectable protein resistance capability. However, this effect was less significant on negatively charged mRFP1. In all cases, lower fluorescence intensities were observed from adsorbed positively charged mRFP1 than that from negatively charged mRFP1. We expected that the amino residues in the polymers were partially protonated at this experimental condition (pH 7.4), and the charge-to-charge repellence between coating polymers and positively charged protein would enhance the overall effect of protein resistance. The temperature response experiment was performed by using negatively charged mRFP1 at the two practical temperatures. Although the fluorescence intensities were apparently lower, meaning less proteins were adsorbed, when the temperature was decreased from 39 to 37 °C, only Polymer 4 showed significant differences in fluorescence (Figure 6b).
Figure 5.(a) Water contact angle measured on plastic coverslips with and without polymer coatings on top at 37 and 39◦C. Column graphic comparison of static water contact angles between differently coated samples measured with at least 4 repeats. (b) The percentage of Polymer3remained on the surface after culturing for 6 h at 37 and 39◦C compared to the amount of Polymer3right after coating at 39◦C overnight (name: coated) which was set to be 100% in this experiment (n= 3). Statistical significance was determined using one way ANOVA,α= 0.05. Error bars indicate standard deviation (SD).
To understand better the mechanism of temperature triggered cell release from Polymer3coated nTCP, the amount of Polymer3on each well after incubation at different temperatures was quantified by using a Pierce Quantitative Colorimetric Peptide Assay. In this experiment, the amount of Polymer3 on each well immediately after coating was approximately 0.70µg/cm2. Two coated plates were then incubated with 500µL of deionised H2O in each well for 6 h at 37◦C and 39◦C, respectively. The remaining amount of Polymer3after this was quantified and compared to that of the initially coatings (0.70µg/cm2 set to be 100%). As shown in Figure5b, more than 99% of initially coated Polymer3remained on the surfaces after incubation at both temperatures, indicating that this polymer did not detach from the surface in aqueous media at both tested temperatures. The standard curve made to quantify the adsorbed polymers can be found in Figure S8.
As shown in Figure6a, the fluorescence intensities from adsorbed protein were normalized and therefore giving the same readings of negative control between different experiments. Poly(L-ornithine) (PLO)-coated surfaces showed the highest fluorescence intensities from adsorbed mRFP1, and therefore indicated significant enhancement of protein adhesion compared to uncoated nTCP (negative control). The fluorescence intensities from adsorbed mRFP1 with either charge on Polymer1coated surfaces were higher than those with Polymer2coatings which were higher than those coated with Polymer3. These results suggest that the chemical modification, to some extent, conferred protein resistance to Polymers1–3compared to unmodified PLO. The more hydrophobic polymers with fewer primary amines demonstrated reduced protein attachment. The fluorescence intensities of Polymer3and4 coated surfaces were significantly lower than those of uncoated nTCP (negative control) and TCP (positive control), indicating detectable protein resistance capability. However, this effect was less significant on negatively charged mRFP1. In all cases, lower fluorescence intensities were observed from adsorbed positively charged mRFP1 than that from negatively charged mRFP1. We expected that the amino residues in the polymers were partially protonated at this experimental condition (pH 7.4), and the charge-to-charge repellence between coating polymers and positively charged protein would enhance the overall effect of protein resistance. The temperature response experiment was performed by using negatively charged mRFP1 at the two practical temperatures. Although the fluorescence intensities were apparently lower, meaning less proteins were adsorbed, when the temperature was decreased from 39 to 37◦C, only Polymer4showed significant differences in fluorescence (Figure6b).
Materials 2018, 11, 95 10 of 16
Figure 6. (a) Normalized fluorescence intensity of different polymer coated nTCP surfaces, uncoated nTCP (Neg. Ctrl.) and TCP (Pos. Ctrl.) surfaces adsorbed with mRFP1 (negative charge, pI = 5.65 and positive charge, pI = 9.66) after incubated at 37 °C for 24 h and (b) adsorbed with mRFP1 (negative charge, pI = 5.65) after incubation at 39 and 37 °C, respectively, for 24 h. A student t-test was used to compare the difference between the coatings and the uncoated nTCP (Neg. Ctrl.), or between the measurements at 39 and 37 °C (n = 3, * p൏ 0.05, ** p൏ 0.01, *** p ൏ 0.001).
Serum plays an important role in cell attachment as the adhesion proteins can be adsorbed onto appropriate plastic surfaces and facilitate attachment [35]. To further understand the mechanism of the cell attachment on Polymer 3 coated nTCP, a serum depletion experiment was carried out with 3T3 cells cultured at 39 °C for 5 h. The cell attaching time was shortened to be 5 h rather than 18 h in this experiment. This is because the cells may start to die in the absence of serum in the culture media for long incubation time. As shown in microscopy images in Figure 7a, a large cell aggregate was observed on Polymer 3 coated nTCP with no serum in the media, while individual cell attachments were observed with 10% serum in the media on the same surface during this incubation time. Interestingly, more regular cell attachment was shown on both uncoated nTCP and TCP even in the absence of serum in the media as shown in Figure 7a. Further experiments were performed with 3T3 cells in the same condition with different concentrations of serum in the media, the results of which are shown in Figure 7b. These data indicate that the percentage of attached cells was reduced with diluted serum concentration in the media. In all cases, more than 94% of the cells were viable during this experiment (Figure 7c).
We found overall that the cell attachment was serum concentration-dependent and considerable cell aggregation was observed in the absence of serum in the media. Therefore, we believe that serum adsorption to the polymer surfaces was important in the increase in 3T3 cell attachment. Although the results of protein adsorption experiments (Figure 6) showed that fewer proteins were adsorbed on the Polymer 3 coated nTCP compared to the uncoated nTCP, there were still quantifiable proteins adsorbed on the coated surface, especially the negatively charged proteins which established electrostatic interaction with positively charged coating Polymer 3. A key example of such a protein is bovine serum albumin (BSA) which is a major component of fetal calf serum (FCS) and exhibits a net negative charge at physiological pH [36]. Additionally, different types of proteins respond to the surface hydrophobicity differently as reported previously [32], and thus we intend to test the adsorption behavior of more specific examples of proteins in future experiments. However, from the results presented so far, we believe that the rich variety of proteins in FCS is essential to successful cell attachment on the proposed coated surfaces.
Figure 6.(a) Normalized fluorescence intensity of different polymer coated nTCP surfaces, uncoated nTCP (Neg. Ctrl.) and TCP (Pos. Ctrl.) surfaces adsorbed with mRFP1 (negative charge, pI = 5.65 and positive charge, pI = 9.66) after incubated at 37◦C for 24 h and (b) adsorbed with mRFP1 (negative charge, pI = 5.65) after incubation at 39 and 37◦C, respectively, for 24 h. A student t-test was used to compare the difference between the coatings and the uncoated nTCP (Neg. Ctrl.), or between the measurements at 39 and 37◦C (n= 3, *p<0.05, **p<0.01, ***p<0.001).
with diluted serum concentration in the media. In all cases, more than 94% of the cells were viable during this experiment (Figure7c).
We found overall that the cell attachment was serum concentration-dependent and considerable cell aggregation was observed in the absence of serum in the media. Therefore, we believe that serum adsorption to the polymer surfaces was important in the increase in 3T3 cell attachment. Although the results of protein adsorption experiments (Figure6) showed that fewer proteins were adsorbed on the Polymer3coated nTCP compared to the uncoated nTCP, there were still quantifiable proteins adsorbed on the coated surface, especially the negatively charged proteins which established electrostatic interaction with positively charged coating Polymer3. A key example of such a protein is bovine serum albumin (BSA) which is a major component of fetal calf serum (FCS) and exhibits a net negative charge at physiological pH [36]. Additionally, different types of proteins respond to the surface hydrophobicity differently as reported previously [32], and thus we intend to test the adsorption behavior of more specific examples of proteins in future experiments. However, from the results presented so far, we believe that the rich variety of proteins in FCS is essential to successful cell attachment on the proposed coated surfaces.Materials 2018, 11, 95 11 of 16
Figure 7. (a) Microscope images of 3T3 cells taken on Polymer 3 coated nTCP cultured at 39 °C for 5 h in the absence and presence of serum (10%) in the media, and on uncoated nTCP and TCP in the absence of serum in the media. Big cell aggregate was observed on Polymer 3-coated nTCP without serum in the media, while cell attachments were recorded in all the other three circumstances (scale bar = 100 μm). (b) The column graph of the percentage of attached cell with different concentrations of serum in the media indicates serum concentration related cell attachment on Polymer 3 coated nTCP. (c) The viability of the cells through this experiment with tested serum concentrations was measured by counting the dead number of cells dyed with Trypan blue (n = 3).
4. Materials and Methods
4.1. Materials
Poly(L-ornithine) hydrobromide (Mw: ˃ 100,000), Poly(L-lysine) hydrobromide (Mw: 15,000–
30,000), methoxypolyethylene glycol succinate N-hydroxysuccinimide (mPEG-NHS, Mw: 5000, 90%),
N-succinimidyl N-methylcarbamate (97.0%), used as a safe methyl isocyanate substitute, and potassium cyanate (96%), sodium tetraborate (99%), imidazole buffer (1 M, pH 9–10), trifluoroacetic acid (TFA, 99%), phosphate buffered saline tablets and deuterium oxide (D2O; 99.9 atom% D) were
purchased from Sigma Aldrich (Dorset, UK) and used as received. Solvents were obtained from Fisher Scientific (Loughborough, UK) and used as received. Deionized water was obtained from an Elga Pure Nanopore 18.2 MΩ water purification system (High Wycombe, UK). Aqueous HCl and NaOH solutions were used to adjust the solution pH as desired. Dialysis membrane with 1000 MWCO and 6000–8000 MWCO were purchased from Spectrumlabs (Rancho Dominguez, CA, USA).
Dulbecco’s modified Eagle media (DMEM), 10% fetal calf serum (FCS), 1% antibiotic/antimycotic solution and 1% L-glutamine (2 mM) were purchased from Sigma Aldrich (Dorset, UK). Presto blue cell viability reagent was obtained from Invitrogen (Hemel Hempstead, UK). Trypan blue solution (0.4%, prepared in 0.81% sodium chloride and 0.06% potassium phosphate, dibasic) was purchased from Sigma Aldrich (Dorset, UK). CyQUANT™ NF cell proliferation assay kit (Invitrogen) was purchased from Fisher Scientific (Loughborough, UK). Monomeric red fluorescent protein1 (mRFP1) with either negative (pI: 5.65, Mw: 25.4 kDa) or positive
(pI: 9.66, Mw: 29.4 kDa) charges at physiological pH were kindly provided by Dr. James Dixon from
the same group. Pierce quantitative colorimetric peptide assay kit was purchased from ThermoFisher Scientific (Hemel Hempstead, UK).
4.2. Synthesis of Poly(L-ornithine)-co-poly(L-citrulline)(POC)—Polymer 1
Poly(L-ornithine) hydrobromide (Mw: ˃ 100,000, 84.0 mg, 0.43 mmol of L-ornithine) and potassium cyanate (43.7 mg, 0.52 mmol) was weighed in a glass vial, and dissolved in imidazole buffer solution (1 M, pH 7.0, 4 mL). The reaction was started by placing the sealed glass vial an oil bath at 50 °C and then kept stirring for 24 h. The reaction was stopped by cooling down to room temperature. The crude product was purified by dialysis against deionized H2O (0.1% trifluoroacetic
Figure 7.(a) Microscope images of 3T3 cells taken on Polymer3coated nTCP cultured at 39◦C for 5 h in the absence and presence of serum (10%) in the media, and on uncoated nTCP and TCP in the absence of serum in the media. Big cell aggregate was observed on Polymer3-coated nTCP without serum in the media, while cell attachments were recorded in all the other three circumstances (scale bar = 100µm). (b) The column graph of the percentage of attached cell with different concentrations of serum in the media indicates serum concentration related cell attachment on Polymer3coated nTCP. (c) The viability of the cells through this experiment with tested serum concentrations was measured by counting the dead number of cells dyed with Trypan blue (n= 3).
4. Materials and Methods
4.1. Materials
Dulbecco’s modified Eagle media (DMEM), 10% fetal calf serum (FCS), 1% antibiotic/antimycotic solution and 1%L-glutamine (2 mM) were purchased from Sigma Aldrich (Dorset, UK). Presto blue cell viability reagent was obtained from Invitrogen (Hemel Hempstead, UK). Trypan blue solution (0.4%, prepared in 0.81% sodium chloride and 0.06% potassium phosphate, dibasic) was purchased from Sigma Aldrich (Dorset, UK). CyQUANT™ NF cell proliferation assay kit (Invitrogen) was purchased from Fisher Scientific (Loughborough, UK). Monomeric red fluorescent protein1 (mRFP1) with either negative (pI: 5.65,Mw: 25.4 kDa) or positive (pI: 9.66,Mw: 29.4 kDa) charges at physiological pH were kindly provided by Dr. James Dixon from the same group. Pierce quantitative colorimetric peptide assay kit was purchased from ThermoFisher Scientific (Hemel Hempstead, UK).
4.2. Synthesis of Poly(L-ornithine)-co-poly(L-citrulline)(POC)—Polymer1
Poly(L-ornithine) hydrobromide (Mw: > 100,000, 84.0 mg, 0.43 mmol ofL-ornithine) and potassium cyanate (43.7 mg, 0.52 mmol) was weighed in a glass vial, and dissolved in imidazole buffer solution (1 M, pH 7.0, 4 mL). The reaction was started by placing the sealed glass vial an oil bath at 50◦C and then kept stirring for 24 h. The reaction was stopped by cooling down to room temperature. The crude product was purified by dialysis against deionized H2O (0.1% trifluoroacetic acid, TFA) with 1000 MWCO dialysis membrane for 2 days. Then, water was removed by freeze-drying. The product was stored at−80◦C [26].
4.3. Synthesis of Methyl Isocyanate Modified Poly(L-ornithine)-co-Poly(L-citrulline) (Methyl Isocyanate Modified POC)—Polymer2and3
Typically, poly(L-ornithine) hydrobromide (Mw: > 100,000, 84.0 mg, 0.43 mmol ofL-ornithine) and N-succinimidylN-methylcarbamate (7.6 mg, 0.043 mmol) was weighed in a glass vial, and dissolved in sodium tetraborate buffer solution (50 mM, pH 8.5, 4 mL) with continuous stirring at room temperature for 24 h. Potassium cyanate (43.7 mg, 0.52 mmol) was then added in the reaction solution. The sealed glass vial was placed in an oil bath at 50◦C and kept stirring for another 24 h. The reaction was stopped by cooling down to room temperature. The crude product was purified by dialysis against deionized H2O (0.1% trifluoroacetic acid, TFA) with 6000–8000 MWCO dialysis membrane for 2 days. Then, water was removed by freeze-drying. The product was stored at−80◦C.
4.4. Synthesis of PEG Grafted Poly(L-lysine) (PEG-g-PLL)—Polymer4
Poly(L-lysine) hydrobromide (Mw: 20,000, 21.0 mg, 0.10 mmol ofL-lysine) and methoxypolyethylene glycol succinate N-hydroxysuccinimide (mPEG-NHS,Mw: 5000, 55.8 mg, 0.01 mmol) was weighed in a glass vial, and dissolved in sodium tetraborate buffer solution (50 mM, pH 8.5, 1 mL) with continuously stirring at room temperature for 6 h. The reaction was stopped by adding a large volume of deionized H2O, and purified by dialysis against deionized H2O with 6000–8000 MWCO dialysis membrane for 2 days. Then, water was removed by freeze-drying. The product was stored at−80◦C [27].
4.5. Nuclear Magnetic Resonance (NMR) Spectroscopy
1H-NMR and13C-Heteronuclear Single Quantum Correlation (13C-HSQC) spectroscopies were
recorded with an average of 64 scans per spectrum at 70◦C in D2O using a Bruker AV400 spectrometer (Coventry, UK) fitted with a 5 mm auto-tunable broad-band (BBFO) probe. Spectra were analyzed with MestReNova 6.2 software (Mestrelab, Santiago de Compostela, Spain). Chemical shifts were recorded in ppm (δ).
4.6. Cloud Point Measurements by Ultraviolet-Visible (UV-Vis) Spectroscopy
solutions in a 10 mm quartz cell were recorded on Shimadzu UV-1650PC UV-visible spectrophotometer (Milton Keynes, UK) equipped with a Peltier temperature controller (Southampton, UK) at scanning rate of 1◦C/min either from 20◦C to 80◦C or reversely from 80◦C to 20◦C.
4.7. Preparation of Thermal Responsive Polypeptides Coated Non-Tissue Culture Plates
Polymers (1 mg/mL) in deionized H2O were ultra-sonicated at 70◦C for 15 min to give transparent solutions. Warm polymer solutions were sterilized by filtering through 0.22µm membranes, and then transferred into 24-well non-tissue culture plate (300µL for each well) immediately. The plate was then incubated at 39◦C overnight. The solutions were then removed. The coated wells were rinsed with PBS buffer once, and dried in the fume hood before use.
4.8. Time of Flight Secondary Ion Mass Spectrometry (ToF-SIMS)
ToF-SIMS data were collected using a ToF-SIMS IV instrument (ION-TOF GmbH., Münster, Germany) equipped with a bismuth liquid metal ion gun and a single-stage reflectron analyzer. Bi3+primary ion energy of 25 kV and a pulsed target current of approximately 1.3 pA were used in this measurement. Low-energy electrons (20 eV) were used to compensate for surface charging due to the positively charged primary ion beam on the insulating surfaces. Rastered areas of 3×3 mm2 were analyzed at a resolution of 100 pixels per mm and 15 frames per patch. The total primary ion beam dose for each analyzed area was kept below 1 × 10¹² ions per cm2, ensuring static conditions. Data acquisition and analysis were performed using IONTOF SurfaceLab6 software (IONTOF, Munster, Germany).
4.9. Cell Adhesion for Screening Coating Polymers
NIH-3T3 fibroblast cells were grown in DMEM with 10% FCS, 1% antibiotic/antimycotic solution and 1%L-glutamine (2 mM). Tissue culture-treated plates, non-tissue culture-treated plates, and either poly(L-lysine) or poly(L-ornithine) coated wells were used as controls. 3T3 cells were added (1×10⁵cells per well), and incubated at 37◦C overnight to allow cells to attach. Microscope images were taken after incubation for 24 h. Alexa Fluor 488 Phalloidin (ThermoFisher Scientific, UK) that binds intracellular F-actin, was used to visualize the attached cells, and the microscope images were recorded again. After cell attachment in the polymer coated plates, Live/Dead®Viability/Cytotoxity kit (Invitrogen) was used to differentiate live cells which take up the green fluorescent Calcein AM and dead cells which take up Ethidium homodimer-1. The cells were treated with the stain at 39◦C for 15 min and imaged using fluorescence microscope. The culture temperature was changed to 37◦C and the Live/Dead stained cells were imaged after 2 h.
4.10. In Vitro Cell Release Studies
given as a schematic in Figure S9. These steps were repeated at determined time points (e.g., 2 h, 4 h, 6 h, 12 h and 24 h) until no more cells were released into the supernatant.
4.11. Contact Angle (CA) Measurement
Static water contact angle measurements were made on each polymer coated surface using a CAM 200 Optical Contact Angle Meter (KSV Instruments Ltd., Helsinki, Finland). This instrument was fitted with a thermostated mental cell, connected to a refrigerated/heated bath circulator (Fisherbrand, UK) to maintain the temperature of the sample.
4.12. Quantification of Polymers Adsorbed on nTCP
Polymer3 was coated on three non-tissue culture treated 24-well plates as described above. In one plate, the amount of coated Polymercon each well was quantified by using a Pierce quantitative colorimetric peptide assay kit. The other two plates were then incubated with freshly added deionized H2O (500µL per well) for 6 h at 37◦C and 39◦C, respectively. The remaining amount of Polymercon each well in these two plates was then quantified.
4.13. Adsorption of Proteins to Polymer Coated Surfaces
The method to prepare red fluorescent mRFP1 protein was adapted from Campbell et al. [34]. To determine the protein adsorption to surfaces, mRFP1 was diluted to 200µg/mL with PBS buffer (100 nM, pH 7.4). This protein solution was added to the polymer-coated 24-well plates (300µL per well). The plates were then incubated at 39◦C, 37◦C or room temperature for 24 h. The wells were rinsed with PBS buffer (300µL) twice and then deionized water (300µL) once. The adsorption of mRFP1 on surfaces was quantified by the reading of fluorescent intensity (excitation wavelength 584 nm, emission wavelength 620 nm) on a Tecan (Theale, UK) plate reader (infinite M200).
4.14. Serum Depletion Experiment
3T3 cells were seeded (1×10⁵cells per well) into Polymer3-coated non-tissue culture treated 24-well plates with 500µL of cell culture media (containing 20%, 10%, 5%, 2.5% and 0%,v/vFCS, respectively) in each well, and incubated at 39 ◦C for 5 h. Microscope images were then taken. The number and viability of the cells in the supernatant was then counted using a Haemocytometer combined with Trypan blue assays.
4.15. Statistical Analysis
Statistical comparisons were carried out using GraphPad Prism (6.01, GraphPad Software, Inc. San Diego, CA, USA). The statistical significance was determined using a one-way analysis of variance (ANOVA) followed by Dunnet’s test for viability and cell release experiments; Student’s t test was carried out for protein adsorption experiments. Results were considered significant atp< 0.05. 5. Conclusions
the surface hydrophobicity change of Polymer3in response to the applied temperatures, which we believe is the reason for the cell release. Also, the amount of polymers on the surfaces after culturing at different temperatures was quantified to be the same as that measured immediately after the coating process, which means that the cell release was not due to the loss of coating polymers. In addition, serum depletion experiments demonstrated that cell adhesion on TRPs coated nTCP was strongly related to the concentration of serum, which improved the cell adhesion on the coated surfaces. The new TRP coatings therefore were likely to have acted via a ‘hybrid’, protein to surface interaction, which mediated cell attachment and release, as the underlying polymer surface changed conformation and accordingly displayed any surface-adsorbed proteins differently. The 3T3 cells were released with high viability by the temperature changes used (around body temperature), and therefore we suggest these surfaces should have potential applications in cell-based therapies where ‘switching’ of cell attachment is required.
Supplementary Materials: The following are available online at www.mdpi.com/1996-1944/11/1/95/s1. Figure S1:1H-NMR(400 Hz, D2O) spectrum for Polymer1at 70◦C, Figure S2:1H-NMR(400 Hz, D2O) spectrum for Polymer2 at 70◦C, Figure S3: 13C-HSQC (400 Hz, D2O) spectrum for Polymer 3at 70 ◦C, Figure S4: 1H-NMR(400 Hz, D
2O) spectrum for Polymer4at room temperature, Figure S5: ToF SIMS spectra and image of signals from specific chemical structures for Polymer1,2,3,4, PLO, PLL coated plastic surface and Blank control, Figure S6: Live/Dead staining of cells on Polymer 3. Figure S7: Percentage of cells, in relation to the total number of cells seeded, which were released over differential times (2, 4, 6, 12, 24 h) from the polymer-coated surface at the polymer phase-transition temperature of 37◦C, determined using manual counting with Trypan blue, Figure S8: Standard curve for Pierce Quantitative Colorimetric Peptide Assay, Figure S9: Schematics of cell release study experimental design.
Acknowledgments: We would like to thank UK Regenerative Medicine Platform (UKRMP) and European Biodesign grant (Project No. 262948) for funding this work. Cameron Alexander thanks the Royal Society for a Wolfson Research Merit Award (WM150086). We also thank David Scurr for the useful discussion on ToF SIMS data analysis.
Author Contributions:Xuan Xue, Cameron Alexander and Kevin M. Shakesheff conceived and designed the experiments; Xuan Xue and Lalitha Thiagarajan performed the experiments and analyzed the data; James E. Dixon contributed red fluorescent protein; Xuan Xue and Lalitha Thiagarajan wrote the paper; Brian R. Saunders, Cameron Alexander and Kevin M. Shakesheff discussed the results and Cameron Alexander reviewed and revised the final manuscript.
Conflicts of Interest:The authors declare no conflict of interest.
References
1. Lee, J.H.; Lee, J.W.; Khang, G.; Lee, H.B. Interaction of cells on chargeable functional group gradient surfaces. Biomaterials1997,18, 351–358. [CrossRef]
2. Schneider, G.B.; English, A.; Abraham, M.; Zaharias, R.; Stanford, C.; Keller, J. The effect of hydrogel charge density on cell attachment.Biomaterials2004,25, 3023–3028. [CrossRef] [PubMed]
3. Van Oss, C.J. Hydrophobicity of biosurfaces—Origin, quantitative-determination and interaction energies. Colloids Surf. B Biointerfaces1995,5, 91–110. [CrossRef]
4. Harnett, E.M.; Alderman, J.; Wood, T. The surface energy of various biomaterials coated with adhesion molecules used in cell culture.Colloids Surf. B-Biointerfaces2007,55, 90–97. [CrossRef] [PubMed]
5. De Bartolo, L.; Morelli, S.; Bader, A.; Drioli, E. Evaluation of cell behaviour related to physico-chemical properties of polymeric membranes to be used in bioartificial organs. Biomaterials2002,23, 2485–2497. [CrossRef]
6. Lee, J.H.; Khang, G.; Lee, J.W.; Lee, H.B. Interaction of different types of cells on polymer surfaces with wettability gradient.J. Colloid Interface Sci.1998,205, 323–330. [CrossRef] [PubMed]
7. Arima, Y.; Iwata, H. Effect of wettability and surface functional groups on protein adsorption and cell adhesion using well-defined mixed self-assembled monolayers.Biomaterials2007,28, 3074–3082. [CrossRef] [PubMed]
9. Idota, N.; Ebara, M.; Kotsuchibashi, Y.; Narain, R.; Aoyagi, T. Novel temperature-responsive polymer brushes with carbohydrate residues facilitate selective adhesion and collection of hepatocytes.Sci. Technol. Adv. Mater. 2012,13, 064206. [CrossRef] [PubMed]
10. Deligianni, D.D.; Katsala, N.D.; Koutsoukos, P.G.; Missirlis, Y.F. Effect of surface roughness of hydroxyapatite on human bone marrow cell adhesion, proliferation, differentiation and detachment strength.Biomaterials 2001,22, 87–96. [CrossRef]
11. Biazar, E.; Heidari, M.; Asefnezhad, A.; Montazeri, N. The relationship between cellular adhesion and surface roughness in polystyrene modified by microwave plasma radiation.Int. J. Nanomed.2011,6, 631–639. [CrossRef] [PubMed]
12. Ohashi, K.; Yokoyama, T.; Yamato, M.; Kuge, H.; Kanehiro, H.; Tsutsumi, M.; Amanuma, T.; Iwata, H.; Yang, J.; Okano, T.; et al. Engineering functional two- and three-dimensional liver systems in vivo using hepatic tissue sheets.Nat. Med.2007,13, 880–885. [CrossRef] [PubMed]
13. Jun, I.; Lee, Y.B.; Choi, Y.S.; Engler, A.J.; Park, H.; Shin, H. Transfer stamping of human mesenchymal stem cell patches using thermally expandable hydrogels with tunable cell-adhesive properties.Biomaterials2015, 54, 44–54. [CrossRef] [PubMed]
14. Sun, J.; Yu, Z.; Hong, C.; Pan, C. Biocompatible zwitterionic sulfobetaine copolymer-coated mesoporous silica nanoparticles for temperature-responsive drug release.Macromol. Rapid Commun.2012,33, 811–818. [CrossRef] [PubMed]
15. Ma, C.; Shi, Y.; Pena, D.A.; Peng, L.; Yu, G. Thermally responsive hydrogel blends: A general drug carrier model for controlled drug release.Angew. Chem.-Int. Ed.2015,54, 7376–7380. [CrossRef] [PubMed] 16. Zhang, R.; Liberski, A.; Sanchez-Martin, R.; Bradley, M. Microarrays of over 2000 hydrogels—Identification of
substrates for cellular trapping and thermally triggered release.Biomaterials2009,30, 6193–6201. [CrossRef] [PubMed]
17. Seuring, J.; Agarwal, S. Polymers with upper critical solution temperature in aqueous solution.Macromol. Rapid Commun.2012,33, 1898–1920. [CrossRef] [PubMed]
18. Seunng, J.; Agarwal, S. First example of a universal and cost-effective approach: Polymers with tunable upper critical solution temperature in water and electrolyte solution.Macromolecules2012,45, 3910–3918. 19. Seuring, J.; Bayer, F.M.; Huber, K.; Agarwal, S. Upper critical solution remperature of poly(N-acryloyl
glycinamide) in water: A Concealed Property.Macromolecules2012,45, 374–384. [CrossRef]
20. Liu, F.; Seuring, J.; Agarwal, S. Controlled radical polymerization ofN-acryloylglycinamide and UCST-type phase transition of the polymers.J. Polym. Sci. Part A-Polym. Chem.2012,50, 4920–4928. [CrossRef] 21. Shimada, N.; Nakayama, M.; Kano, A.; Maruyama, A. Design of UCST polymers for chilling capture of
proteins.Biomacromolecules2013,14, 1452–1457. [CrossRef] [PubMed]
22. Glatzel, S.; Badi, N.; Paech, M.; Laschewsky, A.; Lutz, J.-F. Well-defined synthetic polymers with a protein-like gelation behavior in water.Chem. Commun.2010,46, 4517–4519. [CrossRef] [PubMed]
23. Glatzel, S.; Laschewsky, A.; Lutz, J.-F. Well-defined uncharged polymers with a sharp UCST in water and in physiological milieu.Macromolecules2011,44, 413–415. [CrossRef]
24. Boustta, M.; Colombo, P.-E.; Lenglet, S.; Poujol, S.; Vert, M. Versatile UCST-based thermoresponsive hydrogels for loco-regional sustained drug delivery.J. Control. Release2014,174, 1–6. [CrossRef] [PubMed]
25. Xue, X.; Thiagarajan, L.; Braim, S.; Saunders, B.R.; Shakesheff, K.M.; Alexander, C. Upper critical solution temperature thermo-responsive polymer brushes and a mechanism for controlled cell attachment.J. Mater. Chem. B2017,5, 4926–4933. [CrossRef]
27. Pasche, S.; de Paul, S.M.; Voros, J.; Spencer, N.D.; Textor, M. Poly(L-lysine)-graft-poly(ethylene glycol) assembled monolayers on niobium oxide surfaces: A quantitative study of the influence of polymer interfacial architecture on resistance to protein adsorption by ToF-SIMS and in situ OWLS.Langmuir2003,19, 9216–9225. [CrossRef]
28. Freshney, R.I.Culture of Animal Cells: A Manual of basic Technique; A.R. Liss: Michigan, MI, US, 1983. 29. Thurston, G.; Palcic, B. 3T3 cell motility in the temperature-range 33◦C to 39◦C.Cell Motil. Cytoskelet.1987,
7, 361–367. [CrossRef] [PubMed]
30. Hou, C.H.; Lin, F.L.; Hou, S.M.; Liu, J.F. Hyperthermia induces apoptosis through endoplasmic reticulum and reactive oxygen species in human osteosarcoma cells.Int. J. Mol. Sci.2014,15, 17380–17395. [CrossRef] [PubMed]
31. Tamada, Y.; Ikada, Y. Effect of preadsorbed proteins on cell-adhesion to polymer surfaces. J. Colloid Interface Sci.1993,155, 334–339. [CrossRef]
32. Wei, J.H.; Igarashi, T.; Okumori, N.; Igarashi, T.; Maetani, T.; Liu, B.L.; Yoshinari, M. Influence of surface wettability on competitive protein adsorption and initial attachment of osteoblasts.Biomed. Mater.2009,4, 045002. [CrossRef] [PubMed]
33. Cunliffe, D.; Smart, C.A.; Alexander, C.; Vulfson, E.N. Bacterial adhesion at synthetic surfaces.Appl. Environ. Microbiol.1999,65, 4995–5002. [PubMed]
34. Campbell, R.E.; Tour, O.; Palmer, A.E.; Steinbach, P.A.; Baird, G.S.; Zacharias, D.A.; Tsien, R.Y. A monomeric red fluorescent protein.Proc. Natl. Acad. Sci. USA2002,99, 7877–7882. [CrossRef] [PubMed]
35. Yildirim, A. The role of serum on the adhesion of cultured Chinese Hamster Lung (CHL) cells.Turk. J. Med. Sci. 1998,28, 383–387.
36. Barbosa, L.R.S.; Ortore, M.G.; Spinozzi, F.; Mariani, P.; Bernstorff, S.; Itri, R. The importance of protein-protein interactions on the pH-induced conformational changes of bovine serum albumin: A small-angle X-ray scattering study.Biophys. J.2010,98, 147–157. [CrossRef] [PubMed]