Systems/Circuits
Spatial Processing Is Frequency Specific in Auditory Cortex
But Not in the Midbrain
X
Joseph Sollini,
X
Robert Mill, and
X
Christian J. Sumner
Medical Research Council Institute of Hearing Research, University of Nottingham, Nottingham NG7 2RD, United Kingdom
The cochlea behaves like a bank of band-pass filters, segregating information into different frequency channels. Some aspects of
percep-tion reflect processing within individual channels, but others involve the integrapercep-tion of informapercep-tion across them. One instance of this is
sound localization, which improves with increasing bandwidth. The processing of binaural cues for sound location has been studied
extensively. However, although the advantage conferred by bandwidth is clear, we currently know little about how this additional
information is combined to form our percept of space. We investigated the ability of cells in the auditory system of guinea pigs to compare
interaural level differences (ILDs), a key localization cue, between tones of disparate frequencies in each ear. Cells in auditory cortex
believed to be integral to ILD processing (excitatory from one ear, inhibitory from the other: EI cells) compare ILDs separately over
restricted frequency ranges which are not consistent with their monaural tuning. In contrast, cells that are excitatory from both ears (EE
cells) show no evidence of frequency-specific processing. Both cell types are explained by a model in which ILDs are computed within
separate frequency channels and subsequently combined in a single cortical cell. Interestingly, ILD processing in all inferior colliculus cell
types (EE and EI) is largely consistent with processing within single, matched-frequency channels from each ear. Our data suggest a clear
constraint on the way that localization cues are integrated: cortical ILD tuning to broadband sounds is a composite of separate,
frequency-specific, binaurally sensitive channels. This frequency-specific processing appears after the level of the midbrain.
Key words:
auditory cortex; frequency specificity; inferior colliculus; sound localization
Introduction
Our perception of sounds in space relies on the integration of
mul-tiple physical cues. The dominant cue for high-frequency sound
lo-calization is the interaural level difference (ILD) (Rayleigh, 1907,
Wightman and Kistler, 1992,
Macpherson and Middlebrooks, 2002).
ILD-based localization is enhanced by adding other localization
cues (interaural timing differences, spectral cues) or by providing
additional ILD information at a wider range of frequencies
(But-ler, 1986,
Wightman and Kistler, 1992,
Hartmann and Constan,
2002). Little is known about how additional frequency content is
synthesized.
For a given spatial position in azimuth, the transfer function
of the head imposes different ILDs at different frequencies
(Fed-dersen et al., 1957,
Shaw, 1974); ILD cues are frequency specific.
If any across-frequency integration process led to ILD
computa-Received Sept. 28, 2016; revised Feb. 28, 2017; accepted March 16, 2017.Author contributions: J.S., R.M., and C.S. designed research; J.S., R.M., and C.S. performed research; J.S., R.M., and C.S. analyzed data; J.S., R.M., and C.S. wrote the paper.
This work was supported by the Medical Research Council (Intramural Grant U135097127). We thank two anon-ymous reviewers for highly constructive advice,Stephen Town and Alan Palmer for comments on earlier versions of the manuscript, and Angie Killoran for clerical assistance.
The authors declare no competing financial interests.
Correspondence should be addressed to either of the following: Christian Sumner, Medical Research Council Institute of Hearing Research, University of Nottingham, University Park, Nottingham NG7 2RD, UK, E-mail:
[email protected]; or Joseph Sollini, University College London Ear Institute, 332 Grays Inn Road, London WC1X 8EE, UK, E-mail:[email protected].
DOI:10.1523/JNEUROSCI.3034-16.2017 Copyright © 2017 Sollini et al.
This is an open-access article distributed under the terms of the Creative Commons Attribution License Creative Commons Attribution 4.0 International, which permits unrestricted use, distribution and reproduction in any medium provided that the original work is properly attributed.
Significance Statement
tion across broad frequency regions, this would “blur” the ILD
cues and presumably reduce acuity. The situation would be worse
for multiple sound sources, in which different frequency regions
might contain energy from either (or both) sound sources. This
leads to the prediction that across-frequency integration should
preserve the frequency specificity of ILD cues. Consistent with
this, psychophysical thresholds for detecting ILDs increase when
there is a frequency mismatch between the ears (Francart and
Wouters, 2007,
Goupell et al., 2013).
Evidence suggests that ILD computation and across-frequency
integration are partially segregated in the auditory pathway. ILD
sensitivity is created in the lateral superior olive (LSO) (Galambos
et al., 1959) and also the inferior colliculus (IC) (Adams and
Mugnaini, 1984,
Faingold et al., 1991,
Smith, 1992,
Yang and
Pollak, 1994,
1998,
Orton et al., 2016). Thereafter, there is little
evidence of new interaural comparisons (Malmierca et al., 2005,
Kyweriga et al., 2014). In contrast, cortical across-frequency
integra-tion is supported by extensive thalamocortical and intracortical
connectivity (Kaur et al., 2005,
Intskirveli et al., 2016). Therefore,
the auditory pathway may first extract frequency-specific ILD
cues and then integrate across frequency.
In a linear computation, order is not important and models of
auditory cortex (AC) responses suggest that linear integration of
spectral energy from each ear can predict spatial receptive fields
(Schnupp et al., 2001,
Mrsic-Flogel et al., 2005). Importantly,
they also predict that the frequency specificity of ILD processing
will be lost if a cell is integrating information from different
fre-quency regions.
Currently, it is not clear how to reconcile physiological spatial
receptive field properties, the architecture of ILD processing, and
perception. Here, we tested the ability of the auditory system to make
binaural comparisons across frequency. Using a stimulus design in
which pure tones can differ in frequency, level or both between the
ears, we sought to determine whether ILD sensitivity depends on the
absolute frequencies of the tones in each ear, as predicted by linear
models, or the difference in frequency across the ears. We show that
neurons in primary AC integrate binaural information in a
frequency-specific manner. In contrast, neurons in the IC are
insen-sitive to spectral differences across the ears.
Materials and Methods
Animal preparation. Subjects were tricolor pigmented guinea pigs (Cavia porcellus) of both sexes. Anesthesia was induced with an intraperitoneal injection of urethane (4.5 ml/kg of a 20% solution) supplemented with intramuscular injections of 0.2 ml of Hypnorm (fentanyl citrate 0.315 mg/ml, fluanisone 10 mg/ml) when necessary. Bronchial secretions were suppressed with a subcutaneous injection of 0.2 ml of atropine sulfate (600 mg/ml). Animals were tracheotomized and breathing and temper-ature were maintained artificially using a respirator and heating blanket (38°C). The soft tissue around the ear canal was surgically removed and the animal placed in a stereotaxic frame with hollow plastic specula for ear bars. The frame was located inside a sound-attenuating room. Pres-sure across the tympanic membrane was equalized bilaterally by sealing a small polythene tube into a small hole in the bulla. The foramen magnum was opened to release the pressure of the CSF.
For the cortical recordings, primary AC was exposed by making a craniotomy of about 7 mm2(Wallace et al., 2000). For the IC recordings, a rectangular craniotomy was made on the top of the skull 10 –14 mm behind bregma and 0 –2.5 mm lateral from midline. This allowed access to the right IC from directly above through the overlying cerebral cortex (Palmer et al., 2013). In both cases, the dura was removed and the brain was covered with a layer of agar to promote recording stability and to prevent desiccation. All experiments were performed in accordance with UK Home Office regulations.
Neurophysiological recordings. Neurophysiological recordings were conducted using in-house-manufactured multielectrode arrays (Bullock et al., 1988). Each multielectrode array held 1– 6 glass-insulated tungsten electrodes (8 –12m tip size to ensure good unit isolation) and was advanced into AC or IC with a piezoelectric motor (Burleigh Inchworm IW-700/710). Signals from the multielectrode array were band-pass fil-tered (0.16 – 6000 Hz) using a high-impedance headstage (Tucker-Davis Technologies RA16AC) and digitized using a preamplifier (Tucker-Davis Technologies RA16PA). This signal was then passed to a digital signal pro-cessor (RX7), where the signal was again filtered under the control of Brain-Ware (Tucker-Davis Technologies; 400 –3000 Hz). Recordings were monitored online using BrainWare.
Stimulus presentation. All stimuli were generated online using a Tucker-Davis Technologies RX6 and presented binaurally via a pair of custom-modified RadioShack 40 –1377 tweeters (M. Ravicz, Eaton Peabody Laboratory). After surgery, the sound system was calibrated using a probe microphone close to the tympanic membrane to determine the frequency response of the presentation system. This was used to create flat spectrum output for subsequent sound presentation (⫾2dB, 0.1–25 kHz). Gaussian white noise was used as a search stimulus for cells (0.01– 48 kHz, 100 ms dura-tion, 2 ms cos2on– off ramp, 70 dB SPL). For each cell, the pure tone frequency response area (FRA) for sounds presented to the contralateral ear was measured (100 ms duration, 6 ms cos2on– off ramp, 1 s inter-stimulus interval, 20 – 80 dB SPL, 3–5 repeats of each frequency level combination). Contralateral FRAs were plotted in real time and used to determine the frequencies to be used for ILD presentation.
For the binaural stimulus protocol, contralateral pure tones were se-lected to be evenly spaced in frequency (on an octave scale) and matched for excitability by varying sound level. Two frequencies within the con-tralateral FRA were selected, generally centered around characteristic frequency (CF), contraLand contraH(seeFig. 1C, left and right, respec-tively) with a frequency spacing of 0.25, 0.5, or 1 octave (seeFig. 3). To ensure that firing rates at the two frequencies were matched, a rate-level function was collected at each frequency and appropriate sound levels selected. ILD functions were measured using the “excitatory-monaural intensity” constant method in which contralateral tone sound levels were held constant while varying the ipsilateral sound level. Most ILDs ranged from⫺20 to⫹20 dB in 5 dB increments, which is well matched to the physiological range of ILDs for a guinea pig (Greene et al., 2014). Across-frequency binaural level sensitivity was tested by varying the interaural frequency difference (IFD). For each contralateral tone condition, three corresponding ipsilateral tone frequencies were used: one at each con-tralateral tone frequency (ipsiLand ipsiH, respectively, one matched to a given contralateral tone, one mismatched) and one halfway in between on an octave spacing (ipsiM; seeFig. 1C). This meant that, for each contralateral tone condition, there were three IFDs. The same ipsilateral frequencies were used across the 2 tone contralateral conditions, making 2⫻3⫽6 ILD functions. Therefore, the IFDs were symmetrical and of the same frequency difference but of opposite sign for the two contralateral tone frequencies. Stimulus conditions were repeated between 10 and 50 times (usually⬎25 repeats) in AC and IC recordings. Across all the recordings, there were 5 possible IFD values in total: 0, 0.125, 0.25, 0.5, and 1 octave.
Data analysis. Spike data were sorted offline using Plexon version 2.8.8 and processed in MATLAB (The MathWorks). Spikes within a window spanning the duration of the stimulus (0 –100 ms) were used for all analyses. Monaural and binaural responses were calculated by counting the total number of spikes per presentation. To test for significant bin-aural interactions in each condition, the firing rates for each presentation were randomly resampled with replacement 500 times to produce a boot-strapped distribution of possible mean firing rates. This was then used to test for significant modulations of firing rate (p⬍0.05) compared with the bootstrapped distribution of the response to the corresponding con-tralateral tone alone. ILD functions that did not modulate their firing rates significantly at one or more ipsilateral levels were not used for subsequent analysis.
classification purposes. Different types of binaural interaction (excit-atory, inhibitory, and numerous variations) have been reported for ILD functions. Here, ILD functions were classified using an objective method. First, ILD functions were normalized by subtracting the contralateral alone response and dividing by the absolute maximum change in firing rate (across all presented conditions). Then, a principle component anal-ysis (PCA) was performed on these data. The Euclidean distance between ILD functions in PCA space (first three components) was used to calcu-late a dissimilarity matrix. Agglomerative clustering (using Ward’s link-age method) was then performed on this matrix to provide a quantitative basis for dividing cells into different classes (seeFig. 2E). This resulted in two separate classes: one binaurally inhibitory and one binaurally facilitatory.
To quantify changes in ILD function produced by changing the IFD, a contrast sensitivity measure was adopted similar to that used to quantify frequency specificity in studies of stimulus-specific adaptation (Ulanovsky et al., 2003). For a given ILD function, we computed the magnitude of the integral over all ILDs,兩冱ILD兩, of the increase (facilitatory functions) or decrease (inhibitory functions) in the firing rates compared with the responses to the corresponding contralateral tone alone condition. For each extreme contralateral tone condition (low or high), we contrasted this integral when the ipsilateral and contralateral tone frequencies were matched,兩冱ILDIFD⫽0兩with when they were mismatched,兩冱ILDIFD⫽⌬兩.
The interaural frequency specificity index (IFSI) was calculated as follows:
IFSI⫽共兩¥ILDIFD⫽0兩⫺兩¥ILDIFD⫽⌬兩兲 共兩¥ILDIFD⫽0兩⫹兩¥ILDIFD⫽⌬兩兲
The IFSI was calculated for both the low-frequency (IFSIL) and high-frequency (IFSIH) contralateral tones (e.g., seeFig. 3).
In addition, the overall direction of change in firing for a neuron (IFSIneuron) was quantified by summing the numerators and denomina-tors for the IFSIHand IFSIL(again, followingUlanovsky et al., 2003) as follows:
IFSIneuron⫽
共兩¥ILDL,IFD⫽0兩⫺兩¥ILDL,IFD⫽⌬兩⫹兩¥ILDH,IFD⫽0兩⫺兩¥ILDH,IFD⫽⌬兩兲 共兩¥ILDL,IFD⫽0兩⫹兩¥ILDL,IFD⫽⌬兩⫹兩¥ILDH,IFD⫽0兩⫹兩¥ILDH,IFD⫽⌬兩兲
IFSIneuronwas positive if, overall, there was a decrease in the magnitude of inhibition or facilitation when IFD was not zero. Neuron IFSI was nega-tive if, overall, there was an increase in inhibition or facilitation when IFD was not zero. IFSIneuronwas zero if no change was observed or if the effect of IFD was of opposing direction for the high- and low-contralateral conditions.
Modeling. A simple firing rate model was used to produce the re-sponses shown inFigure 7, which is intended to demonstrate processing principles rather than being an accurate model of all ILD processing. This model did not include any time dimension; inputs and outputs were assumed to be static during the period of a stimulus. The auditory pe-riphery on each side was modeled as a bank of gammatone filters ( Pat-terson, 1994) implemented in the frequency domain and set to model the bandwidth of guinea pig auditory nerve fibers (Evans et al., 1992). Each pure tone stimulus was defined by a single component in the frequency domain in units of microPascals.
Auditory nerve fibers differ in their threshold and dynamic range (Liberman, 1978) and are integrated centrally in some way which is poorly understood (e.g.,Lai et al., 1994). Here, we used a very simple model of transduction that is assumed to represent the result of this integration. Noting that nerve fibers display linear increases in firing rate with sound pressure level within their dynamic range (i.e., dB SPL), the energy at the output of the filters was log transformed. To approximate the threshold of the auditory periphery and to prevent unrealistically low sound levels being represented in the model, a softmax threshold func-tion was applied. For each channel in the filterbank, the output of the peripheral model is as follows:
p共i兲⫽s⫻ln
冉
1⫹exp共log10共f共i兲兲⫺th兲s
冊
Wheref(i) is the energy at the output of the filter in channeli,p(i)is the response of the peripheral model,thdetermines the threshold of the model, and the parametersgoverns the abruptness of the thresholding (fors⬍⬍1, this approximates a simple threshold i.e.,y⫽(x⫺th) forx⬎ th, andy⫽0 otherwise). The value ofthwas set such that the threshold at the center frequency of each filter corresponded to 20 dB SPL in the model.
Binaural computation in each frequency channel was modeled as sim-ple linear combination of the output from the corresponding filterbank channel from each ear by either adding or subtracting the right (eral) from the left (contralat(eral). To model the observation that ipsilat-eral inhibitory contributions are weaker than the excitatory contribution from the contralateral side (Yu and Young, 2013), inhibitory inputs are weighted by 0.25 as follows:
q共i兲⫽pcontra共i兲⫺0.25pipsi共i兲
In the case of a nonlinear model, any negative values were set to zero to model the fact that neurons cannot fire at negative firing rates and there-fore cannot pass this information on to downstream neurons. In the case of the linear model, these values were carried forward to the next stage unaltered; that is, unrealistic negative firing rates.
Across-frequency integration of information was modeled as a linear sum of the inputs from the binaural computation stage as follows:
r共i兲⫽
冘
jw共i⫺j兲q共j兲
wherer(i) is the output of a neuron, andw(.) is a Gaussian weighting function centered on channeli. Therefore, at this level, neuronimay have broad-frequency tuning, but will still have a CF corresponding to that of peripheral channeli. To model the restricted firing rate of this neuron, any negative values were set to zero and the maximum firing rate was restricted to one (for all models). Responses of the model were cal-culated for the sets of stimuli, either contralateral pure tones to generate FRAs or the binaural stimulus paradigm exactly as described for the data.
Results
We assessed the ability of IC and primary AC to make ILD
com-parisons across different frequency ranges. Pure tones of different
frequency and level combinations were presented synchronously
to each ear (Fig. 1
A
). The tones in each ear could differ in sound
level, creating an ILD across the ears, by fixing the contralateral
and varying the ipsilateral sound level (Fig. 1
C
). In addition, the
frequency presented to each ear could differ to create an IFD.
Analysis of these conditions allowed us to distinguish between the
frequency-specific hypothesis and the linear hypothesis.
Recordings were made from cells extracellularly either in
pri-mary AC (
n
⫽
198) or IC (
n
⫽
118). Cells responded to binaural
stimuli with an adapting response that was sensitive to the level of
the ipsilateral tones (Fig. 2
A
,
C
). Latency was proportional to the
firing rate and there was no evidence that the effect of the
ipsilat-eral tone was delayed relative to the contralatipsilat-eral tone. Therefore,
all subsequent data analysis was conducted on the total number
of spikes in response to each stimulus (Fig. 2
B
,
D
).
Cells were classified by clustering their ILD functions
A range of ILD function shapes were encountered in both IC and
AC, which is consistent with previous reports (Rutkowski et al.,
2000,
Nakamoto et al., 2004,
Campbell et al., 2006). Qualitatively,
it was clear that cells in our dataset exhibited the two main types
of binaural interaction described previously: binaural inhibition
(EI;
Fig. 2
A
,
B
) and binaural facilitation (EE;
Fig. 2
C
,
D
). For this
reason, we sought to subdivide cells quantitatively based on their
spiking responses to different ILDs.
binaural stimulation (see Materials and Methods). We found that
the first three PCs explained
⬎95% of the variance, so these were
used for clustering.
Figure 2
E
shows the first two PCs of the ILD
functions collected. Agglomerative clustering (using Ward’s
link-age method) revealed two distinct clusters of ILD functions
cor-responding to EI (red) or EE (black) types. These labels were
given to the clusters after inspection of the individual and mean
ILD functions (Fig. 2
F
, black and red lines). Both AC and IC cells
demonstrate qualitatively similar shapes of individual and mean ILD
functions (Fig. 2
E
,
F
). Note that we found no basis for further
sub-division of ILD functions in our data and those distinct clusters
were not evident if all functions with no significant ILD
sensitiv-ity were included in this analysis. Thus the data were consistent
with a continuum of binaural interaction types (Campbell et al.,
2006).
Multiple ILD functions (seven) were collected for each unit.
Most previous descriptions of binaural properties rely on
classi-fication of ILD functions where the IFD
⫽
0. Recent work has
demonstrated that, in a given cell, ILD functions generally remain
of a consistent type (i.e., facilitatory or inhibitory) when
fre-quency is varied but IFD
⫽
0 (Kitzes, 2008). Therefore, our
clas-sifications of each cell were based on ILD functions in which the
interaural frequency was matched in both ears (i.e., IFD
⫽
0, 3
⫻
ILD functions: contra
Lipsi
L, contra
Mipsi
M, andcontra
Hipsi
H) and
a majority rule vote determined the overall classification of a
given cell from these ILD functions. Classified this way, we found
a large bias toward EI cells in our populations (70% of cortical
cells and 81% of IC cells;
Fig. 2
G
).
Binaurally inhibitory cells compare ILDs over a restricted
frequency range in AC but not in IC
A total of 163 cells were classified as being binaurally inhibitory
and, of these, 91 were cortical and 72 were in IC.
Figure 3
shows
two example units from the IC and AC. For each cell, a
contralat-eral FRA was collected (Fig. 3
A
) and two contralateral frequency
values were then selected at different sound levels to match the
contralateral-alone spike counts (Fig. 3
A
,
left top and bottom).
Figure 3
B
shows the
ILD functions collected for the example
units, with three IFDs for each
contralat-eral tone frequency as illustrated in
Figure
1
C
.
Whether the ILD sensitivity depends
on the absolute frequency of the
ipsilat-eral tone or the difference in frequency
relative to the contralateral tone (i.e., the
IFD) allows us to distinguish two
hypoth-eses. If, in both contralateral tone
condi-tions, the ILD interactions are weaker
when
兩
IFD
兩
⬎
0, then ILD processing is
fre-quency specific within a single neuron.
This indicates that ILDs are processed in
distinct processing channels that are
cen-tered on different frequencies.
How-ever, if the sensitivity to ILD is largely
dependent on the absolute frequency of
the ipsilateral tone, then cells behave as
if comparing inputs from a single,
frequency-tuned, channel from each ear
(linear hypothesis).
In AC, we found that binaurally
inhib-itory
cells
demonstrated
frequency-specific changes to their ILD functions
(Fig. 3
B
, bottom left and right). In the example shown, the
sen-sitivity to ILD was greatest when the frequencies were matched
across the ears for both contralateral tone frequencies. This is
equivalent to the frequency tuning to ipsilateral sound shifting
with the contralateral tone frequency. In contrast, IC cells did not
demonstrate these changes (Fig. 3
B
, top left and right). This cell
demonstrated stronger inhibition of rate for high-frequency
ip-silateral tones regardless of the contralateral tone frequency,
sug-gesting a preference in the ipsilateral tuning that is not affected by
contralateral tone frequency.
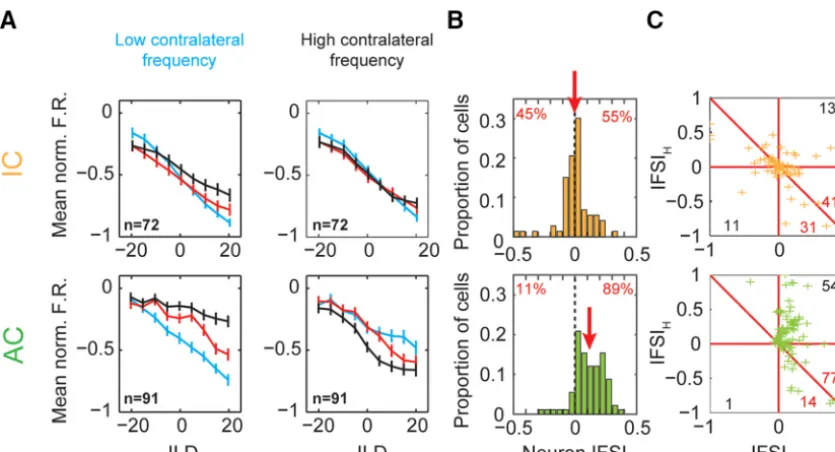
To confirm this result across our sample of units, we
calcu-lated the normalized population mean firing rates for cortical and
collicular ILD functions (Fig. 4
A
). In AC, we found large changes
in the population ILD functions when a frequency difference was
introduced (Fig. 4
A
, bottom). In addition, we found that, at each
contralateral frequency, a matching ipsilateral frequency
pro-duced the most inhibition, demonstrating the frequency
specific-ity of the interaction. However, in IC, we found that IFD had little
systematic effect on ILD functions (Fig. 4
A
, top).
To quantify the amount of frequency specificity in each unit,
two metrics were used: the IFSI and IFSI
neuron(see Materials and
Methods). Both are contrast sensitivity measures that quantify
the similarity of the ILD functions in the matched (IFD
⫽
0) and
mismatched interaural frequency (
兩
IFD
兩
⬎0) conditions. For the
neuron IFSI (Fig. 4
B
), positive values indicate that, considering
both contralateral tone frequencies, there is, on average, a
de-crease in sensitivity to ILD when interaural frequencies were
mis-matched, suggesting frequency-specific binaural interactions. In
IC, the distribution of IFSI
neuronwas centered on zero (mean
⫽
⫺0.0026) with a relatively even distribution of values above and
below zero (45% and 54%, respectively;
Fig. 4
B
). There was no
significant difference between the number of cells above and
be-low zero, so there was no evidence for frequency specificity in IC
(sign test,
p
⫽
0.48). In contrast, AC cells were distributed
asym-metrically and centered above zero (mean
⫽
0.12, sign test,
p
⬍⬍
.01)
where the vast majority of values were positive (89% vs 11%).
This demonstrated that, across both contralateral tone
condi-tions, cells demonstrated frequency-specific decreases in
inhibi-tion when there was a nonzero IFD.
The IFSI quantified this effect at low and high contralateral
frequencies separately and these are plotted against one another
in
Figure 4
C
(IFSI
Land IFSI
H, respectively). Here, a positive value
indicates that, for a single contralateral tone condition, inhibition
is stronger when the ipsilateral tone frequency matches the
con-tralateral than when it does not. Note that a positive effect of
absolute ipsilateral frequency at a single contralateral tone
fre-quency does not by itself indicate frefre-quency specificity. This can
arise simply due to normal ipsilateral frequency tuning.
How-ever, in the absence of frequency specificity, these effects oppose
each other for the two contralateral tone conditions. Therefore,
frequency specificity is indicated by points above the descending
diagonal line, IFSI
H⫽ ⫺
IFSI
L. Quantified in this way, cortical
cells were again found to be overwhelmingly frequency specific
(Fig. 4
C
, bottom, crosses falling above diagonal
⫽
77 vs below
⫽
14, sign test,
p
⬍⬍
0.01). In addition, for the majority of cortical
cells, IFSI was positive at both contralateral frequencies (Fig. 4
C
,
bottom, top right quadrant
⫽
54 vs bottom left
⫽
1), indicating
that inhibition was strongest when frequencies were matched
across the ears in both contralateral conditions. Conversely, there
was little evidence of frequency specificity in IC (Fig. 4
C
, top,
crosses falling above diagonal
⫽
41 vs below
⫽
31, sign test,
p
⫽
0.3). Our data reveal that binaurally inhibitory cells in cortex process
ILD cues in a frequency-specific manner not found in IC.
Larger IFDs produce more interaural frequency specificity
in AC
The effect of the size of the IFD on frequency specificity was
assessed. Cells were grouped based on the IFD presented and the
distribution of IFSI
neuronin the IC and AC were compared (Fig. 5).
In IC, IFSIs were relatively evenly distributed above and below
zero IFSI at all IFDs (where
n
⬎
2): 0.25 (38.5% vs 61.5%, below
and above zero) and 0.5 octaves (44.2% vs 55.8%). A sign test
revealed that this was not significant at any of the IFDs included
(
p
⫽
0.33,
p
⫽
0.54 for 0.25 and 0.5 octave IFD, respectively). In
Figure 2. ILD functions with significant binaural interactions could be classified into two separate categories, inhibitory and facilitatory.A, PSTHs from an example inhibitory unit in AC for a single contralateral tone condition and three different ipsilateral frequencies (left to right: ipsiL, ipsiaM, ipspH: blue, red, and black lines, respectively). Shading indicates ILD for each PSTH.B, Number of
addition, mean IFSIs were also approximately zero for all IFDs
(
⫺
0.005 and 0.02, respectively), with no significant difference
between them (ANOVA,
F
⫽
0.29,
p
⫽
0.59). In AC, increasing
IFD produced increasing IFSI values. A 0.125 octave IFD
pro-duced a slightly positive bias in the distribution of IFSI values
(28.6% vs 71.4%, below and above zero IFSI), although this was
not significant (sign test,
p
⫽
0.08). At 0.25 and 0.5 octaves, IFSIs
were largely positive (0 vs 100% and 7.3 vs 92.7%) and highly
significant (sign test,
p
⬍⬍
0.01 for both). Increasing IFD values
led to larger mean IFSIs (
⫽
0.002, 0.09, and 0.17, respectively),
demonstrating a significant increase in IFSI with increasing IFD
(ANOVA,
F
⫽
20.26,
p
⬍⬍
0.01). Overall, the lack of evidence for
frequency specificity in IC cells was maintained because even the
largest IFDs did not produce a frequency-specific effect.
Con-versely, AC cells demonstrated increasing frequency specificity
with increasing IFD.
Binaurally facilitatory cells demonstrate no evidence of
frequency specificity
[image:6.594.85.503.323.549.2]We also recorded from a smaller number (44) of binaurally
fa-cilitatory cells (29 in AC and 15 in IC). In contrast to binaurally
inhibitory cells, IFD had little effect on ILD functions of
facili-tatory AC cells; matched-frequency conditions were similar to
mismatched conditions (Fig. 6
B
, bottom). Similarly, IC cells
dem-onstrated little change in ILD functions either by changing IFD or
contralateral tone frequency (Fig. 6
B
, top). Mean ILD functions
Figure 3. Single-cell examples demonstrating binaurally inhibitory cells compare ILDs over a restricted frequency range in AC ( top row), but not in IC (bottom row).A, FRAs of the monaural contralateral ear. Color represents the number of spikes (per presentation) at each frequency (x-axis) and level (y-axis) combination. Numbers indicate the contralateral frequencies chosen for further investigation.B, ILD functions were collected using a low-frequency (1) and high-frequency (2) contralateral tone and different ipsilateral tone frequencies (low, middle, and high; exact frequencies are shown above panels).
Figure 4. Binaurally inhibitory cells compare ILDs over a restricted frequency range in AC (top row) but not in IC (bottom row) populations.A, Mean population ILD functions for IC and cortical cells (color scheme as inFig. 3B).B, IFSIneuronfor IC and AC cells. Positive values indicate reduced suppression and thus a decreased ability to encode ILD. Numbers indicate percentage of population above
and below zreo.C, IFSI for IC and AC. Positive values indicate reduced suppression at either the low or high contralateral tone frequency (IFSILor IFSIH, respectively). Number of cells in the bottom
were comparable across IFD and contralateral frequency for both
AC and IC (Fig. 6
C
). As before, specificity indices were calculated
for each cell (Fig. 6
D
,
E
). In both IC and AC, the distributions of
neuron IFSIs were centered on 0 (mean
⫽
0.0076 and 0.02,
re-spectively) and were evenly distributed around the mean, with no
significant difference (Fig. 6
D
, IC: 52% vs 48%, sign test:
p
⫽
1,
AC: 47% vs 53%, sign test:
p
⫽
1). Binaurally facilitatory AC cells
did not demonstrate evidence of frequency specificity in IFSI
(Fig. 6
E
, bottom, above diagonal
⫽
7 vs below
⫽
8, sign test,
p
⫽
1) and neither did IC cells (Fig. 6
E
, top, above diagonal
⫽
12 vs
below
⫽
17, sign test,
p
⫽
0.45). Overall, we found no evidence
for frequency specificity in either AC or IC in binaurally
facili-tatory cells.
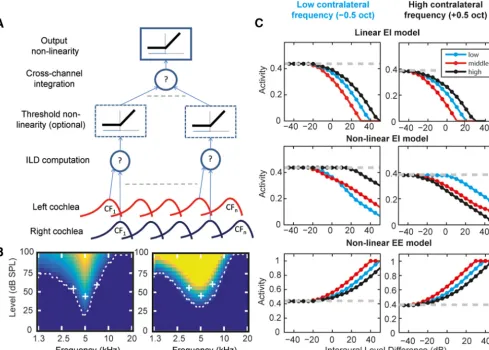
Conceptual model of across-frequency binaural integration
Previous work has suggested that broadband spatial responses are
a linear weighted sum of inhibitory and/or excitatory frequency
channels from either ear (Schnupp et al., 2001,
Mrsic-Flogel et al.,
2005). Our results suggest that the integration of level information
across ears and across frequency is nonlinear. We implemented a
simple model to test how a plausible circuit, and variations in it,
might in principle account for our results (Fig. 7
A
). In this model,
inputs from the left and right cochlea are first compared,
individ-ually for each frequency channel (ILD computation layer). This
can be either an excitatory (⫹) or inhibitory (⫺) interaction. At a
subsequent layer, inputs from these binaurally sensitive neurons
are combined (cross-channel integration layer). The model is
configured such that the integration can in total be linear,
con-sistent with previous findings, or we introduce a threshold
(non-linearity) before across-frequency integration. Therefore, models
can differ in the nature of the binaural interaction (excitatory or
inhibitory), and whether they integrate across frequency linearly
or nonlinearly.
The outputs for simulations of our experimental paradigm
using these different model variations are shown in
Figure 7
C
.
The linear EI model (Fig. 7
C
, top row), in which the binaural
interaction is inhibitory (⫺) and there is no threshold
nonlinear-ity between layers, does not display frequency specificnonlinear-ity; that is,
the effect of ipsilateral sound does not depend on the
contralat-eral condition. However, simply adding a threshold nonlinearity
between layers (the nonlinear EI model;
Fig. 7
C
, middle row)
changes the model behavior radically. This nonlinearity creates
frequency specificity that is not observed in the linear model. The
difference in these models (the nonlinearity) is akin to one model
combining frequency and binaural information in the same cells
(linear EI) and the other calculating ILD computations in one
population of cells and then integrating across frequency in
an-other because subthreshold information is naturally not
con-veyed between neurons. In contrast, the nonlinearity does not
affect processing in the EE model (the nonlinear EE model is
shown in
Fig. 7
C
, bottom row). Performance is identical with or
without this nonlinearity (linear version not shown).
These models suggest that our cortical data are consistent with
a nonlinear model in which interactions across the ear, whether
excitatory or inhibitory, occur in one population of neurons and
that across-frequency integration of binaural information occurs
at a later stage. Our IC data, in contrast, are consistent with either
a linear model with no clear separation between integration
between ears and across frequency or simply a lack of
across-frequency integration.
Discussion
The ability to integrate information across-frequency is
impor-tant for accurate sound localization. We demonstrate that ILD
cues are processed differently at different stages in the ascending
auditory system and by different subpopulations of cells.
ILD processing between the midbrain and cortex
We observed a frequency-specific reduction in binaural
inhibi-tion in AC that is not present in the IC. This raises the quesinhibi-tion:
how does cortex demonstrate frequency-specific ILD sensitivity
not present in IC?
Our midbrain recordings targeted the central IC, which forms
part of the lemniscal pathway projecting to primary AC via the
ventral medial geniculate body (vMGB,
Shneiderman et al.,
1988,
Huang and Winer, 2000,
Hu, 2003). One possibility is that
frequency-specific ILD sensitivity in cortex is inherited from
out-side the lemniscal pathway. However, AI only receives a minority
of its inputs from non-lemniscal divisions of MGB (Huang and
Winer, 2000,
Hu, 2003,
Winer and Schreiner, 2005,
Storace et al.,
2012) and evidence suggests that cortical ILD sensitivity is
inher-ited from vMGB (Middlebrooks and Zook, 1983,
McMullen and
de Venecia, 1993) via the CIC (Yao et al., 2015).
A second possibility is that cortical frequency-specific ILD
sensitivity is not inherited from the ILD sensitivity in the
mid-brain.
De novo
creation of ILD functions in MGB is not supported
by the anatomical literature (Malmierca et al., 2003) because
there is little across-hemisphere interaction (Williams, 1995,
Olry and Haines, 2005) and local inhibition via ipsilaterally tuned
cells is unlikely due to the paucity of inhibitory interneurons
(Winer and Larue, 1996,
Winer et al., 1998). In contrast, the
corpus callosum provides (disynaptic) inhibitory input via
excit-atory connections between each cortical hemisphere (Rock and
Apicella, 2015). However, recent work has shown that cortical
inhibition does not create ILD sensitivity in cortical EI cells
(Ky-weriga et al., 2014). Therefore, there is insufficient evidence to
support significant
de novo
computation of ILDs beyond the
midbrain.
A third possibility, suggested by our simple model (Fig. 7), is
that frequency specificity arises because binaural interactions
precede across-frequency integration. Although frequency
tun-ing in IC neurons varies (Palmer et al., 2013), across-frequency
integration is less evident in IC than in cortex (Mc Laughlin et al.,
2007,
Chen et al., 2012). In contrast, tectothalamic projections
into MGB suggest large frequency convergence (Lee and
Sher-man, 2010) and there is extensive thalamocortical and
intracor-tical convergence of inputs (Miller et al., 2001,
Kaur et al., 2005,
Winer and Schreiner, 2005,
Intskirveli et al., 2016). Therefore,
ILD is largely processed in the LSO and IC, whereas frequency
integration is more evident in the subsequent projections to
Figure 6. No evidence was found to suggest excitatory cells in either AC or IC demonstrate frequency specificity.A, FRAs of the monaural contralateral ear. Color represents the number of spikes (per presentation) at each frequency (x-axis) and level (y-axis) combination. Numbers indicate the contralateral frequencies chosen for further investigation.B, ILD functions were collected using a low-frequency (1) and high-frequency (2) contralateral tone and different ipsilateral tone frequencies (low, middle, and high; exact frequencies are shown above panels).C, Mean normalized ILD functions from AC (top row) and IC (bottom row) measured at low (left) and high (right) contralateral frequencies. Line color indicates low, middle, and high ipsilateral tone frequency (blue, red, and black, respectively).D, IFSIneuronfor IC and AC cells. Positive values indicate reduced suppression. Numbers indicate percentage of population above and below zero.E, IFSI AC (top) and IC (bottom)
MGB and AC, suggesting a partial dissociation of these circuits
and in agreement with the model.
Naturally, our model does not represent the full complexity of
known ILD computations. In the AC (Kyweriga et al., 2014,
Sollini and Chadderton, 2016) and IC (Li and Pollak, 2013,
Xiong
et al., 2013,
Ono and Oliver, 2014), there is ample evidence of
local inhibition and excitation shaping responses of all types and
in IC and even the cochlear nucleus (Park et al., 1997,
Sanes et al.,
1998,
Burger and Pollak, 2001,
Shore et al., 2003,
Pecka et al.,
2007,
Dahmen et al., 2010,
Pollak, 2012,
Yao et al., 2015,
Orton et
al., 2016). In addition, recent evidence in the rat suggests
sharp-ening of ILD tuning between IC and MGB (Yao et al., 2015).
However, these findings do not explain changes in frequency
specificity between IC and AC. The model used here
demon-strates how frequency specificity of ILD processing could be a
logical consequence of the order with which ILD cues are created
and integrated.
Implications for broadband spatial processing
Unlike our results,
Schnupp et al. (2001)
found that cortical
spa-tial processing was linear for broadband sounds. Our stimuli
were designed to test explicitly for a particular nonlinearity.
Model-based characterizations of neural responses typically leave
a significant portion of the variance unaccounted for, some of
which is due to uncharacterized nonlinearities (Yu and Young,
2013;
Machens et al., 2004). This suggests that nonlinear effects
are influential, but also that they can be difficult to characterize
(Rieke et al., 1999,
Bar-Yosef et al., 2002). Our work
demon-strates that cortical spatial processing is not linear and highlights
the value of testing for specific nonlinearities where they are
hy-pothesized to exist.
[image:9.594.51.541.64.414.2]It is not certain why the auditory system might process ILD
information in a frequency-specific manner, but there are
poten-tial advantages.
Schnupp et al. (2001)
highlight that linear
oper-ations have the advantage of preserving information, whereas
nonlinear operations select out information, which can be
bene-ficial. The thresholding nonlinearity has the effect of removing
information that weakly drives the network; in the case of sound
localization in cortex, ipsilateral sounds. Take the example of two
competing sounds: a target (broadband/contralateral) and a
masker (high-frequency/ipsilateral). In the nonlinear model, the
effect of the masker will be limited by the additional threshold
and, after frequency integration, a neuron would reflect only
those frequencies dominated by the contralateral signal. In
con-trast, a linear system will still encode both sound sources after
across-frequency integration despite the spatial separation. Therefore,
the mechanisms that likely lead to frequency specificity could
influence the robustness of representation for multiple sources
(Keller and Takahashi, 2005) and thus affect the detectability and
localizability of sounds in noisy environments.
Another potential advantage of processing ILD in a
frequency-specific manner is in the straightforward weighting of cues. ILD
cues are frequency specific, the size of the ILD varies with
fre-quency, and, due to the Head Related Transfer Function, often in
a nonmonotonic manner (Shaw, 1974,
Sabin et al., 2005). ILDs
being computed first in narrow-frequency bands means that they
can be weighted separately, allowing the most useful frequency
ranges regions to be strongly weighted and the weakest to be
weakly weighted before being synthesized.
The fact that EI cells have broad hemispheric tuning
(Naka-moto et al., 2004,
Zhang et al., 2004) suggests that a
straightfor-ward rate code of ILD is insufficiently precise to underlie the
⬃
1
dB ILD discrimination thresholds observed in humans (Colburn
and Durlach, 1978). This has led to the suggestion that opponent
(hemispheric) channels could explain high-frequency sound
lo-calization behavior (Stecker et al., 2005). This implies EI cells are
more suited to computing sound location because they demonstrate
hemispheric tuning, whereas EE cells are tuned to the midline (Rajan
et al., 1990,
Zhang et al., 2004). Our data further support this because
we found that EI cells process ILD in a frequency-specific manner
consistent with human behavior (Francart and Wouters, 2007,
Goupell et al., 2013), whereas EE cells do not.
Impact of frequency-specific processing on spatial perception
Across-frequency integration is clearly important for sound
localization. Increasing sound bandwidth improves sound
local-ization performance by adding information and resolving
ambi-guities in narrowband localization cues (Terhune, 1974,
Butler,
1986,
Wightman and Kistler, 1992). Our results imply that
corti-cal EI processing allows the necessary combination of cues while
limiting interactions of binaural cues between different
fre-quency regions that could otherwise lead to errors in ILD
com-putation. Qualitatively consistent with this, perceptual sensitivity
to ILD decreases with increasing IFD (Francart and Wouters,
2007,
Goupell et al., 2013). In addition, it suggests that, for
bilat-eral cochlear implants, a physiological constraint exists:
stimulat-ing electrodes need to be well matched for position/frequency to
yield good ILD lateralization, again consistent with the literature
(Kan et al., 2013).
Generalizability of frequency specificity
Frequency specificity of binaural interaction bears a striking
sim-ilarity to frequency-specific adaptation (more generally,
stimulus-specific adaptation, SSA), which has been reported in the IC
(Malmierca et al., 2009,
Duque et al., 2012,
Ayala et al., 2015),
thalamus (Anderson et al., 2009,
Antunes et al., 2010), and AC
(Ulanovsky et al., 2003,
2004,
von der Behrens et al., 2009,
Scholes
et al., 2011).
SSA generally increases in strength along the auditory
path-way and there is variation between subdivisions at each stage. In
the IC and thalamus, it is largely restricted to non-lemniscal
re-gions (Anderson et al., 2009,
Antunes et al., 2010,
Ayala et al.,
2015) and SSA is strongest in the AC (Nieto-Diego and
Malm-ierca, 2016) in non-lemniscal regions. Although we only targeted
lemniscal regions of IC and AC, it is reasonable to hypothesize
that more broadly tuned non-lemniscal regions of IC and AC,
which also tend to show improved spatial acuity (Recanzone,
2000,
Harrington et al., 2008), might show strong
frequency-specific binaural interactions.
The findings in SSA may also offer clues to the underlying
mechanisms of binaural frequency specificity. Many (though
not all:
Taaseh et al., 2011) of these data are also consistent with a
constructive inheritance model (Miller et al., 2001,
Winer and
Schreiner, 2005). Both our data and SSA can be explained by a
convergence of information with either comparisons across
the ears or adaptation occurring independently within separate
frequency-specific channels (Mill et al., 2011,
Duque et al., 2016).
Manipulations of GABAergic, glutamatergic, and cholinergic synapses
(Ayala et al., 2016) and descending control from AC (Malmierca
et al., 2015) also suggest that SSA in IC is influenced by changes in
overall excitability or adaptation rather than being crucially
de-pendent on them, again supporting the model of constructive
convergence. Other similarities between the phenomena include
larger effects with increased frequency difference (Ulanovsky et
al., 2003; cf.
Fig. 5) and a stronger effect above CF than below it
(Duque et al., 2012; cf.
Fig. 4). Therefore, there is evidence across
disparate phenomena for this form of integration, which may
be a common architectural feature in the auditory pathway
(Williamson et al., 2016).
Summary
We have demonstrated that the cortical integration of ILD cues
across frequency nevertheless preserves the frequency-specific
nature of the physical cue. This frequency specificity is similar to
stimulus-specific adaptation in its action and the location where
the specificity develops. It places distinct constraints on the way
that the auditory system processes location and suggests that
nonlinear, within-channel computation of interaural level cues
subcortically precedes a process of constructive integration in
primary AC or thalamus.
References
Adams JC, Mugnaini E (1984) Dorsal nucleus of the lateral lemniscus: a nucleus of GABAergic projection neurons. Brain Res Bull 13:585–590.
CrossRef Medline
Anderson LA, Christianson GB, Linden JF (2009) Stimulus-specific adapta-tion occurs in the auditory thalamus. J Neurosci 29:7359 –7363.CrossRef Medline
Antunes FM, Nelken I, Covey E, Malmierca MS (2010) Stimulus-specific adaptation in the auditory thalamus of the anesthetized rat. PLoS One 5:e14071.CrossRef Medline
Ayala YA, Udeh A, Dutta K, Bishop D, Malmierca MS, Oliver DL (2015) Differences in the strength of cortical and brainstem inputs to SSA and non-SSA neurons in the inferior colliculus. Sci Rep 5:10383.CrossRef Medline
Ayala YA, Pe´rez-Gonza´lez D, Malmierca MS (2016) Stimulus-specific adap-tation in the inferior colliculus: The role of excitatory, inhibitory and modulatory inputs. Biol Psychol 116:10 –22.CrossRef Medline
Bar-Yosef O, Rotman Y, Nelken I (2002) Responses of neurons in cat pri-mary auditory cortex to bird chirps: effects of temporal and spectral con-text. J Neurosci 22:8619 – 8632.Medline
Bullock DC, Palmer AR, Rees A (1988) Compact and easy-to-use tungsten-in-glass microelectrode manufacturing workstation. Med Biol Eng Com-put 26:669 – 672.CrossRef Medline
Burger RM, Pollak GD (2001) Reversible inactivation of the dorsal nucleus of the lateral lemniscus reveals its role in the processing of multiple sound sources in the inferior colliculus of bats. J Neurosci 21:4830 – 4843.
Medline
Butler RA (1986) The bandwidth effect on monaural and binaural localiza-tion. Hear Res 21:67–73.CrossRef Medline
Campbell RA, Schnupp JW, Shial A, King AJ (2006) Binaural-level func-tions in ferret auditory cortex: evidence for a continuous distribution of response properties. J Neurophysiol 95:3742–3755.CrossRef Medline
Chen C, Rodriguez FC, Read HL, Escabí MA (2012) Spectrotemporal sound preferences of neighboring inferior colliculus neurons: implications for local circuitry and processing. Front Neural Circuits 6:62.Medline
Hand-book of perception (Carterette EC, Friedman MP, eds), pp 467–518. New York: Academic.
Dahmen JC, Keating P, Nodal FR, Schulz AL, King AJ (2010) Adaptation to stimulus statistics in the perception and neural representation of auditory space. Neuron 66:937–948.CrossRef Medline
Duque D, Pe´rez-Gonza´lez D, Ayala YA, Palmer AR, Malmierca MS (2012) Topographic distribution, frequency, and intensity dependence of stimulus-specific adaptation in the inferior colliculus of the rat. J Neuro-sci 32:17762–17774.CrossRef Medline
Duque D, Wang X, Nieto-Diego J, Krumbholz K, Malmierca MS (2016) Neurons in the inferior colliculus of the rat show stimulus-specific adap-tation for frequency, but not for intensity. Sci Rep 6:24114.CrossRef Medline
Evans EF, Pratt SR, Spenner H, Cooper NP (1992) Comparisons of physio-logical and behavioural properties: auditory frequency selectivity. In: Au-ditory physiology and perception: Proceedings of the 9th International Symposium on Hearing Held in Carcens, France, on 9 –14 June 1991 (Cazals Y, Horner K, Demany L, eds), pp 159 –170. Burlington: Elsevier Science.
Faingold CL, Boersma Anderson CA, Caspary DM (1991) Involvement of GABA in acoustically-evoked inhibition in inferior colliculus neurons. Hear Res 52:201–216.CrossRef Medline
Feddersen W, Sandel T, Teas D, Jeffress L (1957) Localization of high fre-quency tones. J Acoust Soc Am 29:988.CrossRef
Francart T, Wouters J (2007) Perception of across-frequency interaural level differences. J Acoust Soc Am 122:2826 –2831.CrossRef Medline
Galambos R, Schwartzkopff J, Rupert A (1959) Microelectrode study of su-perior olivary nuclei. Am J Physiol 197:527–536.Medline
Goupell MJ, Stoelb C, Kan A, Litovsky RY (2013) Effect of mismatched place-of-stimulation on the salience of binaural cues in conditions that simulate bilateral cochlear-implant listening. J Acoust Soc Am 133:2272– 2287.CrossRef Medline
Greene NT, Anbuhl KL, Williams W, Tollin DJ (2014) The acoustical cues to sound location in the guinea pig (Cavia porcellus). Hear Res 316:1–15.
CrossRef Medline
Harrington IA, Stecker GC, Macpherson EA, Middlebrooks JC (2008) Spa-tial sensitivity of neurons in the anterior, posterior, and primary fields of cat auditory cortex. Hear Res 240:22– 41.CrossRef Medline
Hartmann WM, Constan ZA (2002) Interaural level differences and the level-meter model. J Acoust Soc Am 112:1037–1045.CrossRef Medline
Hu B (2003) Functional organization of lemniscal and non-lemniscal audi-tory thalamus. Exp Brain Res 153:543–549.CrossRef Medline
Huang CL, Winer JA (2000) Auditory thalamocortical projections in the cat: laminar and areal patterns of input. J Comp Neurol 427:302–331.
CrossRef Medline
Intskirveli I, Joshi A, Vizcarra-Chaco´n BJ, Metherate R (2016) Spectral breadth and laminar distribution of thalamocortical inputs to A1. J Neu-rophysiol 115:2083–2094.CrossRef Medline
Kan A, Stoelb C, Litovsky RY, Goupell MJ (2013) Effect of mismatched place-of-stimulation on binaural fusion and lateralization in bilateral cochlear-implant users. J Acoust Soc Am 134:2923–2936.CrossRef Medline
Kaur S, Rose HJ, Lazar R, Liang K, Metherate R (2005) Spectral integration in primary auditory cortex: laminar processing of afferent input, in vivo and in vitro. Neuroscience 134:1033–1045.CrossRef Medline
Keller CH, Takahashi TT (2005) Localization and identification of concur-rent sounds in the owl’s auditory space map. J Neurosci 25:10446 –10461.
CrossRef Medline
Kitzes L (2008) Binaural interactions shape binaural response structures and frequency response functions in primary auditory cortex. Hear Res 238:68 –76.CrossRef Medline
Kyweriga M, Stewart W, Cahill C, Wehr M (2014) Synaptic mechanisms underlying interaural level difference selectivity in rat auditory cortex. J Neurophysiol 112:2561–2571.CrossRef Medline
Lai YC, Winslow RL, Sachs MB (1994) A model of selective processing of auditory-nerve inputs by stellate cells of the antero-ventral cochlear nu-cleus. J Comput Neurosci 1:167–194.CrossRef Medline
Lee CC, Sherman SM (2010) Topography and physiology of ascending streams in the auditory tectothalamic pathway. Proc Natl Acad Sci U S A 107:372–377.CrossRef Medline
Li N, Pollak GD (2013) Circuits that innervate excitatory-inhibitory cells in the inferior colliculus obtained with in vivo whole cell recordings. J Neu-rosci 33:6367– 6379.CrossRef Medline
Liberman MC (1978) Auditory-nerve response from cats raised in a low-noise chamber. J Acoust Soc Am 63:442– 455.CrossRef Medline
Machens CK, Wehr MS, Zador AM (2004) Linearity of cortical receptive fields measured with natural sounds. J Neurosci 24:1089 –1100.CrossRef Medline
Macpherson EA, Middlebrooks JC (2002) Listener weighting of cues for lateral angle: the duplex theory of sound localization revisited. J Acoust Soc Am 111:2219 –2236.CrossRef Medline
Malmierca MS, Herna´ndez O, Falconi A, Lopez-Poveda EA, Mercha´n M, Rees A (2003) The commissure of the inferior colliculus shapes frequency response areas in rat: an in vivo study using reversible blockade with microinjection of kynurenic acid. Exp Brain Res 153:522–529.CrossRef Medline
Malmierca MS, Herna´ndez O, Rees A (2005) Intercollicular commissural projections modulate neuronal responses in the inferior colliculus. Eur J Neurosci 21:2701–2710.CrossRef Medline
Malmierca MS, Cristaudo S, Pe´rez-Gonza´lez D, Covey E (2009) Stimulus-specific adaptation in the inferior colliculus of the anesthetized rat. J Neu-rosci 29:5483–5493.CrossRef Medline
Malmierca MS, Anderson LA, Antunes FM (2015) The cortical modulation of stimulus-specific adaptation in the auditory midbrain and thalamus: a potential neuronal correlate for predictive coding. Front Syst Neurosci 9:19.CrossRef Medline
Mc Laughlin M, Van de Sande B, van der Heijden M, Joris PX (2007) Com-parison of bandwidths in the inferior colliculus and the auditory nerve. I. Measurement using a spectrally manipulated stimulus. J Neurophysiol 98:2566 –2579.CrossRef Medline
McMullen NT, de Venecia RK (1993) Thalamocortical patches in auditory neocortex. Brain Res 620:317–322.CrossRef Medline
Middlebrooks JC, Zook JM (1983) Intrinsic organization of the cat’s medial geniculate body identified by projections to binaural response-specific bands in the primary auditory cortex. J Neurosci 3:203–224.Medline
Mill R, Coath M, Wennekers T, Denham SL (2011) A neurocomputational model of stimulus-specific adaptation to oddball and Markov sequences. PLoS Comput Biol 7:e1002117.CrossRef Medline
Miller LM, Escabí MA, Read HL, Schreiner CE (2001) Functional conver-gence of response properties in the auditory thalamocortical system. Neu-ron 32:151–160.CrossRef Medline
Mrsic-Flogel TD, King AJ, Schnupp JW (2005) Encoding of virtual acoustic space stimuli by neurons in ferret primary auditory cortex. J Neuro-physiol 93:3489 –3503.CrossRef Medline
Nakamoto KT, Zhang J, Kitzes LM (2004) Response patterns along an isof-requency contour in cat primary auditory cortex (AI) to stimuli varying in average and interaural levels. J Neurophysiol 91:118 –135.Medline
Nieto-Diego J, Malmierca MS (2016) Topographic distribution of stimulus-specific adaptation across auditory cortical fields in the anesthetized rat. PLoS Biol 14:e1002397.CrossRef Medline
Olry R, Haines DE (2005) NEUROwords: interthalamic adhesion: scruples about calling a spade a spade? J Hist Neurosci 14:116 –118.CrossRef Medline
Ono M, Oliver DL (2014) The balance of excitatory and inhibitory synaptic inputs for coding sound location. J Neurosci 34:3779 –3792.CrossRef Medline
Orton LD, Papasavvas CA, Rees A (2016) Commissural gain control en-hances the midbrain representation of sound location. J Neurosci 36: 4470 – 4481.CrossRef Medline
Palmer AR, Shackleton TM, Sumner CJ, Zobay O, Rees A (2013) Classifica-tion of frequency response areas in the inferior colliculus reveals continua not discrete classes. J Physiol 591:4003– 4025.CrossRef Medline
Park TJ, Monsivais P, Pollak GD (1997) Processing of interaural intensity differences in the LSO: role of interaural threshold differences. J Neuro-physiol 77:2863–2878.Medline
Patterson RD (1994) The sound of a sinusoid: spectral models. J Acoust Soc Am 96:1409 –1418.CrossRef
Pecka M, Zahn TP, Saunier-Rebori B, Siveke I, Felmy F, Wiegrebe L, Klug A, Pollak GD, Grothe B (2007) Inhibiting the inhibition: a neuronal net-work for sound localization in reverberant environments. J Neurosci 27: 1782–1790.CrossRef Medline
Pollak GD (2012) Circuits for processing dynamic interaural intensity dis-parities in the inferior colliculus. Hear Res 288:47–57.CrossRef Medline
effects of variations in stimulus parameters. J Neurophysiol 64:872– 887.
Medline
Rayleigh L (1907) On our perception of sound direction. Philos Mag 13: 214 –232.CrossRef
Recanzone GH (2000) Spatial processing in the auditory cortex of the ma-caque monkey. Proc Natl Acad Sci U S A 97:11829 –11835.CrossRef Medline
Rieke F, Warland D, de Ruyter van Steveninck R, Bialek W (1999) Spikes: exploring the neural code (computational neuroscience). Cambridge, MA: MIT.
Rock C, Apicella AJ (2015) Callosal projections drive neuronal-specific re-sponses in the mouse auditory cortex. J Neurosci 35:6703– 6713.CrossRef Medline
Rutkowski RG, Wallace MN, Shackleton TM, Palmer AR (2000) Organisa-tion of binaural interacOrganisa-tions in the primary and dorsocaudal fields of the guinea pig auditory cortex. Hear Res 145:177–189.CrossRef Medline
Sabin AT, Macpherson EA, Middlebrooks JC (2005) Human sound local-ization at near-threshold levels. Hear Res 199:124 –134.CrossRef Medline
Sanes DH, Malone BJ, Semple MN (1998) Role of synaptic inhibition in processing of dynamic binaural level stimuli. J Neurosci 18:794 – 803.
Medline
Schnupp JW, Mrsic-Flogel TD, King AJ (2001) Linear processing of spatial cues in primary auditory cortex. Nature 414:200 –204.CrossRef Medline
Scholes C, Palmer AR, Sumner CJ (2011) Forward suppression in the audi-tory cortex is frequency-specific. Eur J Neurosci 33:1240 –1251.CrossRef Medline
Shaw EA (1974) Transformation of sound pressure level from the free field to the eardrum in the horizontal plane. J Acoust Soc Am 56:1848 –1861.
CrossRef Medline
Shneiderman A, Oliver DL, Henkel CK (1988) Connections of the dorsal nu-cleus of the lateral lemniscus: an inhibitory parallel pathway in the ascending auditory system? J Comp Neurol 276:188 –208.CrossRef Medline
Shore SE, El Kashlan H, Lu J (2003) Effects of trigeminal ganglion stimula-tion on unit activity of ventral cochlear nucleus neurons. Neuroscience 119:1085–1101.CrossRef Medline
Smith PH (1992) Anatomy and physiology of multipolar cells in the rat inferior collicular cortex using the in vitro brain slice technique. J Neuro-sci 12:3700 –3715.Medline
Sollini J, Chadderton P (2016) Comodulation enhances signal detection via priming of auditory cortical circuits. J Neurosci 36:12299 –12311.CrossRef Medline
Sollini J, Alves-Pinto A, Sumner CJ (2016) Relating approach-to-target and detection tasks in animal psychoacoustics. Behav Neurosci 130:393– 405.
CrossRef Medline
Stecker GC, Harrington IA, Middlebrooks JC (2005) Location coding by opponent neural populations in the auditory cortex. PLoS Biol 3:e78.
CrossRef Medline
Storace DA, Higgins NC, Chikar JA, Oliver DL, Read HL (2012) Gene
expres-sion identifies distinct ascending glutamatergic pathways to frequency-organized auditory cortex in the rat brain. J Neurosci 32:15759 –15768.
CrossRef Medline
Taaseh N, Yaron A, Nelken I (2011) Stimulus-specific adaptation and devi-ance detection in the rat auditory cortex. PLoS One 6:e23369.CrossRef Medline
Terhune J (1974) Sound localization abilities of untrained humans using complex and sinusoidal sounds. Scand Aud 3:115–120.CrossRef
Ulanovsky N, Las L, Nelken I (2003) Processing of low-probability sounds by cortical neurons. Nat Neurosci 6:391–398.CrossRef Medline
Ulanovsky N, Las L, Farkas D, Nelken I (2004) Multiple time scales of adapta-tion in auditory cortex neurons. J Neurosci 24:10440 –10453.CrossRef Medline
von der Behrens W, Ba¨uerle P, Ko¨ssl M, Gaese BH (2009) Correlating stimulus-specific adaptation of cortical neurons and local field potentials in the awake rat. J Neurosci 29:13837–13849.CrossRef Medline
Wallace MN, Rutkowski RG, Palmer AR (2000) Identification and localisa-tion of auditory areas in guinea pig cortex. Exp Brain Res 132:445– 456.
CrossRef Medline
Wightman FL, Kistler DJ (1992) The dominant role of low-frequency inter-aural time differences in sound localization. J Acoust Soc Am.
Williams P (1995) Gray’s anatomy: the anatomical basis of medicine and surgery. New York: Churchill Livingstone.
Williamson RS, Ahrens MB, Linden JF, Sahani M (2016) Input-specific gain modulation by local sensory context shapes cortical and thalamic re-sponses to complex sounds. Neuron 91:467– 481.CrossRef Medline
Winer JA, Larue DT (1996) Evolution of GABAergic circuitry in the mam-malian medial geniculate body. Proc Natl Acad Sci U S A 93:3083–3087.
CrossRef Medline
Winer JA, Schreiner C (2005) The inferior colliculus. New York: Springer. Xiong XR, Liang F, Li H, Mesik L, Zhang KK, Polley DB, Tao HW, Xiao Z,
Zhang LI (2013) Interaural level difference-dependent gain control and synaptic scaling underlying binaural computation. Neuron 79:738 –753.
CrossRef Medline
Yang L, Pollak GD (1994) The roles of GABAergic and glycinergic inhibi-tion on binaural processing in the dorsal nucleus of the lateral lemniscus of the mustache bat. J Neurophysiol 71:1999 –2013.Medline
Yang L, Pollak GD (1998) Features of ipsilaterally evoked inhibition in the dorsal nucleus of the lateral lemniscus. Hear Res 122:125–141.CrossRef Medline
Yao JD, Bremen P, Middlebrooks JC (2015) Emergence of spatial stream segregation in the ascending auditory pathway. J Neurosci 35:16199 – 16212.CrossRef Medline
Yu JJ, Young ED (2013) Frequency response areas in the inferior colliculus: nonlinearity and binaural interaction. Front Neural Circuits 7:90.CrossRef Medline