1
Development of a comprehensive method to analyse
glazing systems with Parallel Slat Transparent Insulation
Material (PS-TIM)
Yanyi Sun, Runqi Liang, Yupeng Wu*, Robin Wilson and Peter Rutherford
Department of Architecture and Built Environment, Faculty of Engineering, The University of Nottingham, University Park, Nottingham, NG7 2RD, UK
*Corresponding author: Tel: +44 (0) 115 74 84011; emails: [email protected], [email protected]
Abstract
In order to provide enhanced levels of indoor comfort and building energy
conservation, significant improvements have been made in the design of glazed facades and
window systems, yielding increases in thermal resistance while simultaneously maintaining
access to daylight. Some of these approaches result in glazing systems with relatively
complex structures and it is difficult to characterise their optical and thermal properties for
use in building simulation. In this research, a comprehensive model has been developed to
accurately predict the thermal and optical properties of complex glazing systems, and a
workflow developed to yield detailed daylight and energy performance (heating, cooling and
lighting) predictions of these systems when applied in buildings. Through this approach, the
thermal characteristics of complex fenestration systems are obtained from validated
Computational Fluid Dynamics model, and a ray-tracing technique is used to obtain
Bidirectional Scattering Distribution Function (BSDF) data to represent their optical
characteristics. These characterises may be used in building simulation software (in this case
2
incorporating complex glazing systems. Detailed visual comfort predictions including useful
daylight illuminance, daylight uniformity and glare may also be made, using a
complementary optical model run using RADIANCE simulation. This workflow is
implemented to investigate a room served by different Parallel Slat Transparent Insulation
Materials (PS-TIM), which represents an example of a complex fenestration system. The
workflow is used to explore the effect of slat pitch (i.e. the distance between neighbouring
slats) on predicted performance and was found to provide reasonable daylight and energy
performance prediction. The results indicate that use of glazing systems with PS-TIM can
provide homogenous daylight distribution and up to 33.6 % energy reduction when the
simulation is run using weather data for London.
Keywords: Building Simulation; Transparent Insulation Materials; Dynamic Thermal
Conductivities; Bidirectional Scattering Distribution Functions (BSDF); Thermal and
3
Nomenclature
Symbols
𝐴 aspect ratio -
𝑎 − 𝑓 coefficients for polynomial regression -
D daylight matrix -
Ee exterior IR incident on window plane W/m2
Ei interior IR incident on window plane W/m2
Ev vertical illuminance lux
ℎ heat transfer coefficient W/m2· K
i illuminance at point of interest for a single time step -
I illuminance at point of interest for a time series -
𝑘 thermal conductivity W/m·K
𝐿 height of the window air cavity m
𝑠 width M
- also sky vector in equation (6) -
S radiation (short-wave, and long-wave from zone internal sources) absorbed by surface
W/m2
- also sky matrix in equation (7) -
T transmission matrix -
𝑡 temperature K/℃
tm mean temperature ℃
∆𝑡 temperature difference ℃
V view matrix -
𝜀 emissivity -
𝜎 Stefan-Boltzmann constant W/m2·K4
Gr Grashof number -
Nu Nusselt number -
Pr Prandtl number -
Subscripts
e external
g gap
i internal
m mean
s interstitial structure/ slat v vertical
4
1. Introduction
Buildings currently account for 30-40% of total energy consumption worldwide [1-4].
The design and specification of the building envelope is a major determining factor of
building energy use during operation [5-7]. Windows in building envelopes play a critical
role by determining the penetration of solar energy and daylight, controlling the view into
and out of a building and influencing the overall building energy consumption [8-10].
Innovative window systems, where interstitial structures, such as horizontal Venetian blinds,
pleated blinds, and Parallel Slat Transparent Insulation Materials (PS-TIM), are sandwiched
between the panes of double glazed window are proposed as strategies to effectively reduce
heat transfer, while maintaining access to daylight [11-21]. When exploring the performance
of these complicated building elements in buildings, numerical simulation methods are
indispensable in helping to create a detailed hour by hour picture of performance or to
identify optimal design solutions using parametric analysis. Various building simulation tools,
such as EnergyPlus, ESP-r, IES, TRNSYS, TAS and RADIANCE can be used to explore the
energy, thermal and daylight performance for buildings with complex fenestration systems [1,
20, 22-26]. The challenges related to representing complex window systems in these
simulation tools include: 1) precise characterisation of the thermal and optical characteristics
of fenestration systems, in which two- or three-dimensional heat transfer and/or light
transmittance might exist due to the presence of complex structural geometries; 2) the
potential need to model adaptive features associated with the operation of complex
fenestration systems (e.g. switchable glazing, moveable shading, etc.), that may affect a
number of properties (e.g. thermal, visual) simultaneously.
Building energy simulation programs are not currently well set up for accurate
5
optical models used to solve heat transfer and light transmission. i.e. one dimensional
methods are used for both heat transfer and light transmitted through fenestration systems
[27]. Glazing systems with complex configurations are often represented using pre-computed
solar heat gain coefficients and visible transmittances, which despite being determined using
radiosity methods are none the less lacking in terms of representing the highly complex,
angle-dependent interaction implicit when they are subject to realistic patterns of incident
radiation [28, 29]. In addition, analysis is currently restricted to the geometric forms
associated with blinds, shades and screens, and it is challenging to characterise less common
structures (e.g. tubular shading structures, nonlinear shading systems, etc.). The launch of
EnergyPlus V7.2 provided the capability to include Bidirectional Scattering Distribution
Functions (BSDF) in the modelling process, and this has significantly enhanced the
software’s capability to predict building energy and daylighting performance of buildings
with complex fenestration systems [27]. Published articles relating to the use of BSDFs in
EnergyPlus are not common. This is, in large part, due to the challenge of obtaining the
specific BSDF data for window systems under prediction [28, 30]. For the purpose of
precisely modelling optical performance of complex fenestration systems in EnergyPlus,
RADIANCE provides a ray-tracing tool to numerically calculate BSDFs and a software
utility, WINDOW, establishes a bridge for its implementation in EnergyPlus [29]. Femandes
et al. [31] have undertaken modelling using BSDFs to represent complex fenestration systems
in order to quantify the potential of energy saving and peak demand reduction in a space
served by an angular selective window system (i.e. expanded metal mesh, tubular shading
structures, and micro-perforated screens). The results revealed that energy savings of between
28 ~ 47% may be achieved in the perimeter zone when applying the angular selective
window system under the climates of Chicago and Houston. Hoffmann et al. [32]
6
performance under the moderate San Francisco climate and a hot and dry Southern California
climate. They used their study to develop optimised strategies to balance solar gain with glare
and daylight levels. The optical properties of the shading systems were defined using the
BSDF method and hourly scheduled surface gains. The results showed that shading geometry
and slat material characteristics significantly affected the amount of heat gain from solar
radiation and distribution of transmitted daylight.
When dealing with adaptive fenestration systems, models need to accommodate the
changes in window thermo-optical properties that occur in response to changes in energy flux
incident on the building. Firlag, et al. [33] investigated the use of dynamic control algorithms
(using the Energy Management System (EMS) feature in EnergyPlus) to control an external
roller blind mounted onto a double-glazed window, as well as an inter-pane cellular shading
device within a triple-glazed window. Both systems were applied to a typical residential
building and simulated under four different climates (i.e. Atlanta, Minneapolis, Phoenix and
Washington DC), respectively. They also used BSDF data to represent the window systems
and linked these to algorithms that simulated dynamic controls. It was concluded that using
automated shading devices with the proposed control algorithms can reduce solar heat gain,
resulting in a 11.6 ~ 13.0% reduction in building energy consumption.
In practice, the integration of an interstitial structure within the air cavity of a double
glazing unit not only influences solar gain, it also has a significant effect on the free
convection and long-wave radiative heat transfer between the two panes of glass. Although,
efforts have been made to combine BSDFs with building energy simulation [26, 32, 33] to
achieve a more accurate representation of solar gains (as well as daylight distribution) within
the analysis of building employing complex fenestration systems, the effect of these
7
glazing cavity has not been considered. In practice, these greatly affect thermal and energy
predictions [11, 12].
This paper proposes a method that offers a comprehensive representation of complex
fenestration systems applied buildings. The approach differs from previous studies through
the inclusion of a comprehensive model to represent thermal behaviour and its combination
with an effective method for representing optical performance within existing building
energy performance software. Computational Fluid Dynamics modelling is used to determine
the thermal characteristics and a ray-tracing technique is used to predict the optical
characteristics what are then converted into a BSDF format. All of these were input into
building simulation software, EnergyPlus, to obtain building heating, cooling and lighting
energy estimates, when complex fenestration systems are applied within the window of a
typical office. The luminous environment is explored through the use of useful daylight
illuminance (UDI), daylightuniformity and daylight glare probability [1, 34-37], based on a
8
2. Analysis method
This paper presents a workflow that incorporates the thermal and optical
characteristics of complex fenestration system within EnergyPlus and RADIANCE using a
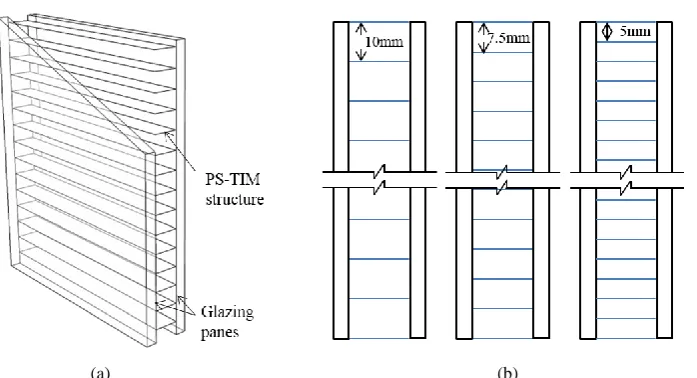
typical office space as a case study to explore its implementation. Three glazing systems with
Parallel Slat Transparent Insulation Material (PS-TIM), shown in Figure 1, are used to
illustrate how the model might be used. The material that forms the parallel slats is assumed
to be a Lambertian diffuser with 50% transmittance, as it can provide homogeneous daylight
distribution within a space. For more information on this PS-TIM system, refer to the authors’
previous publications [12, 20].
Figure 1 (a) PS-TIM structure in a double-glazing unit; (b) 2D schematic illustrating the geometry of the glazing system integrating PS-TIM with 10mm, 7.5mm and 5mm slat pitches
2.1
Overview of the analysis method
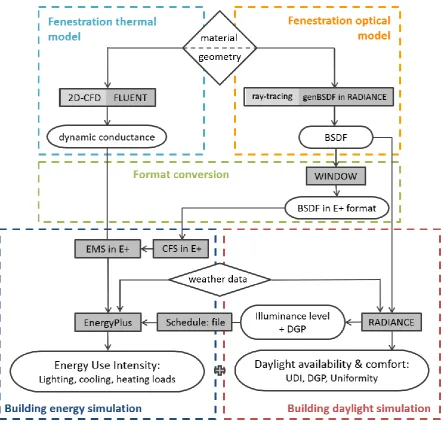
The workflow that sits behind the holistic analysis method consists of four major
blocks as shown in Figure 2:
1) a fenestration thermal model where a two-dimensional Computational Fluid Dynamics
(CFD) simulation has been used to investigate the dynamic thermal conductance across
[image:8.595.128.477.331.520.2]9
the glazing system driven by variation in environmental conditions (i.e. different glazing
average temperature and temperature difference across the glazing panes);
2) a fenestration optical model where a ray-tracing technique has been used to obtain
Bidirectional Scattering Distribution Functions (BSDFs) based on the geometry and
optical properties of the glazing system;
3) a building energy simulation where the optical and thermal characteristics of the glazing
system obtained from the previous thermal and optical models are applied within
EnergyPlus to obtain building energy performance under imposed climatic conditions;
4) a complementary building daylight simulation where the BSDFs for the glazing system
are used in an annual analysis that uses hourly solar irradiance data in RADIANCE to
provide a detailed picture of daylight performance.
This analysis method will yield a building energy performance prediction (i.e.
heating, cooling and lighting energy consumption) and detailed picture of daylight
performance (i.e. useful daylight illuminance, daylight glare probability, etc.). More
information on each of the blocks within the workflow shown in Figure 2 are provided in the
10
Figure 2: Flow chart of the workflow for modelling complex fenestration*
2.2
Fenestration thermal model
Through understanding the default algorithm within EnergyPlus that is used to
predict the energy performance of glazing systems in buildings, the concept of characterising
the dynamic thermal behaviour of complex glazing systems is proposed in this section to
expand the capability of EnergyPlus. This section also describes how CFD (in this case
ANSYS FLUENT 15.0) is used to generate the dynamic thermal characteristics of a PS-TIM
11
glazing unit so that it can be represented in an EnergyPlus simulation.
2.2.1 Glazing heat transfer equations in building performance simulation (EnergyPlus)
EnergyPlus, which has been widely adopted for the prediction of building energy
performance [1], is a heat balance based simulation program that yields space heating and
cooling loads [38]. When solving for heat transfer through fenestration systems within
EnergyPlus, the heat flow is assumed to be one dimensional and perpendicular to the glazing
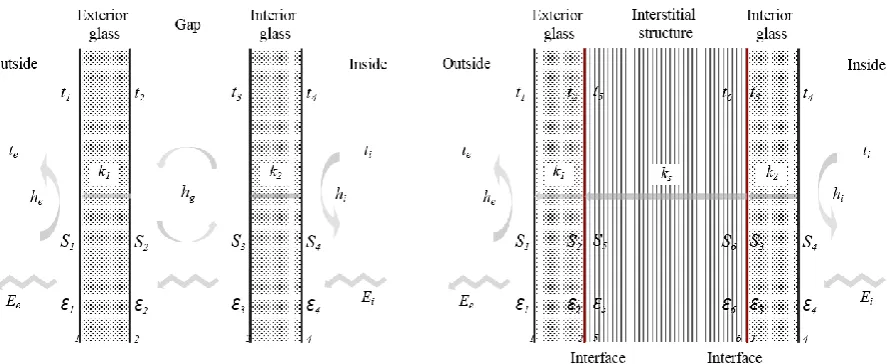
panes. A schematic diagram detailing the heat transfer in a double glazing system is
presented in Figure 3 (a). The heat balance equation for each of the glazing unit’s surfaces
can be written as:
Figure 3: Demonstration of heat transfer and the variables used in heat balance equations for (a) double-glazed window (b) double glazed window system with an interstitial structure.
𝐸𝑒𝜀1− 𝜀1𝜎𝑡14+ 𝑘
1(𝑡2− 𝑡1) + ℎ𝑒(𝑡𝑒− 𝑡1) + 𝑆1 = 0 (1)
𝑘1(𝑡1− 𝑡2) + ℎ𝑔(𝑡3 − 𝑡2) + 𝜎 𝜀3𝜀2
1−(1−𝜀2)(1−𝜀3)(𝑡3 4− 𝑡
24) + 𝑆2 = 0 (2)
𝑘1(𝑡4− 𝑡3) + ℎ𝑔(𝑡2− 𝑡3) + 𝜎1−(1−𝜀𝜀2𝜀33)(1−𝜀2)(𝑡24− 𝑡34) + 𝑆3 = 0 (3)
𝐸𝑖𝜀4− 𝜀4𝜎𝑡44 + 𝑘
2(𝑡3− 𝑡4) + ℎ𝑖(𝑡𝑖 − 𝑡4) + 𝑆4 = 0 (4)
The convective heat transfer coefficient (hg) for the gas cavity between two glazing
panes is represented by the non-dimensional Nusselt number (ℎ𝑔 = 𝑁𝑢𝑘𝑠𝑔), while the strength
[image:11.595.79.523.347.529.2]12
of radiative heat transfer across the gas cavity is determined by the emissivity of the two
glazing surfaces that enclose it and the view factors between them.
However, when a complex structure such as PS-TIM is present within the gas cavity,
it provides additional resistance to convection and interferes the radiative heat transfer
between the two glazing panes. The strength of the heat transfer depends on the geometry and
thermophysical properties of the interstitial structure. EnergyPlus simplifies the heat transfer
process by assuming the two-dimensional characteristics of the interstitial structure may be
represented by a single solid layer, similar to a glazing pane (illustrated in Figure 3 (b)). It
achieves this by applying an equivalent thermal conductivity (ks) to represent the combined
convective and radiative heat transfer through the complex gas/structural element.
Normally, the equivalent thermal conductivity of the interstitial layer (𝑘𝑠in Figure 3
(b)) is obtained by following the method described in ISO 15099 [39]. In this, radiative heat
transfer is calculated using a radiosity method based on the thermal radiation properties of
structure and natural convection within the interstitial structure is calculated using a simple
model. However, previous researchers [11, 12, 40-44] have shown that natural convection
within the geometry of a complex interstitial shading device can vary significantly under
dynamic boundary conditions (e.g. internal and external glazing pane temperature, average
temperature of the interstitial structure), and these significantly affect the overall thermal
conductance of the interstitial gas/structural layer.
Thus, neither the standard method, which does not consider the effect of gas
movement within the interstitial structure on heat transfer, nor using a single equivalent
conductivity, which does not reflect dynamic boundary condition, would result in an accurate
prediction of the heat transfer. CFD calculation, as presented in section 2.2.2, is a recognised
13
systems. Equivalent thermal conductivities under different thermal conditions can be
obtained by varying the boundary conditions in the CFD calculation. Thus, a series of
individual values can be employed to represent the dynamic thermal conductivity in building
simulation.
2.2.2 Dynamic thermal properties acquiring method (CFD)
A validated two-dimensional finite volume model [11, 12] developed using the CFD
software, FLUENT, was used to determine the conductive, convective and radiative heat
transfer through the complex fenestration systems shown in Figure 1. These contain PS-TIM
with slat pitches of 5mm, 7.5mm and 10mm that and are explored later in this paper to
illustrate implementation of the workflow illustrated in Figure 2.
To simplify the CFD simulation process, the following assumptions were made: 1) the
internal surfaces of the left and right glazing panes were set as two isothermal walls with
different temperatures (i.e. interface of surface 5 and 2, and interface of surface 6 and 3
highlighted in red in Figure 3 (b)), while the top and bottom boundaries were assumed to be
adiabatic; 2) the enclosure was filled with air with Pr = 0.71 and all thermophysical
properties (e.g. specific heat capacity, thermal conductivity) of the fluid were assumed to be
constant [40, 42, 44], except for the fluid density and viscosity, which vary with temperature.
For the condition commonly encountered in buildings, the flows in the gas cavity and cells
formed between neighbouring PS-TIM slats that sit within it remain laminar, because the
Grashof Numbers (Gr) never reach the related critical value [41]. Radiative heat transfer was
determined using the Surface to Surface (S2S) radiation model in FLUENT.
In order to account for the boundary layer effect, the mesh size was defined as smaller
near the boundaries and the slats (0.025 mm × 0.025 mm), and then gradually increased
14
with these settings, and iterative convergence was assumed to be achieved when the
normalized residuals were less than 10-3 for the continuity, and 10-7 for the energy and
momentum equations. More details may be obtained in the authors’ previous publication [12].
The simulation was run with a given combination of glazing pane temperatures (which
determined the temperature gradient across the glazing unit) and mean glazing unit
temperature. The estimated results of local convective heat flux and combined convective and
radiative heat flux were calculated from the converged temperature field, from which the
thermal conductivity of the PS-TIM layer was determined.
This process was repeated for representative combinations of temperature gradient
and mean temperature and polynomial regression of the resulting conductivities was used to
determine the equivalent dynamic thermal conductivity of the PS-TIM layer.
𝑘𝑃𝑆−𝑇𝐼𝑀 = 𝑎 + 𝑏𝑡𝑚+ 𝑐∆ + 𝑑𝑡𝑚∆𝑡 + 𝑒∆𝑡2+ 𝑓𝑡
𝑚2 (5)
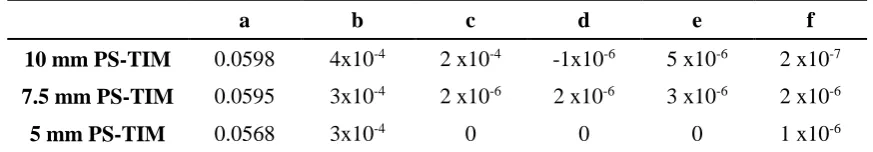
The constants for the fits made with 10 mm, 7.5 mm and 5 mm pitch PS-TIMs
(labelled as ‘10 mm PS-TIM’, ‘7.5 mm PS-TIM’ and ‘5 mm PS-TIM’ respectively in
[image:14.595.63.500.538.614.2]preceding discussions) are given in Table 1.
Table 1: Coefficients for the polynomial regression predicting equivalent thermal conductivities of different PS-TIM configurations for Equation (5)
a b c d e f
10 mm PS-TIM 0.0598 4x10⁻⁴ 2 x10⁻⁴ -1x10⁻⁶ 5 x10⁻⁶ 2 x10⁻⁷
7.5 mm PS-TIM 0.0595 3x10⁻⁴ 2 x10⁻⁶ 2 x10⁻⁶ 3 x10⁻⁶ 2 x10⁻⁶
5 mm PS-TIM 0.0568 3x10⁻⁴ 0 0 0 1 x10⁻⁶
The polynomial may be used in EnergyPlus to represent PS-TIM glazing units by
using the ‘Energy Management System’ (EMS) function. This will generate initial estimates
of 𝑡𝑚 and ∆𝑡 and then update these within the simulation time step until the solution
15
2.3
Optical modelling
This section describes how RADIANCE may be used to predict the daylight
performance of a space employing a complex glazing system.
2.3.1 Daylight modelling in building performance simulation using RADIANCE
Daylight distribution in a space may be modelled using RADIANCE, which employs
backward ray-tracing method. For a space illuminated via a complex fenestration system,
such as PS-TIM, only use the total amount of transmitted/reflected flux is not sufficient for an
accurate prediction of daylight performance. Representing magnitude and the directional
qualities of reflected or transmitted flux, especially the multiple inter-reflections that occur
within the system present a challenge for a dynamic annual simulation. Swapping these
complex interactions with a pre-calculated transmission matrix (T), which may be expressed
by a Bidirectional Scattering Distribution Function (BSDF) as explained in section 2.3.2,
provides an effective description of complex fenestration systems allowing them to be
represented in RADIANCE [45]. In addition to the transmission matrix (T), a daylight matrix
(D) and a view matrix (V), which describe the external and internal conditions respectively,
should also be calculated using a modified daylight coefficient method in advance of annual
daylight simulation [46]. Flux transfer represented by these three matrices forms a
“Three-phase method”, where the matrices are used in a multiple inner time-step loop with an
assigned value for the sky condition (sky vector (s) or sky matrix (S)). This is proposed as a
means of effectively and accurately performing annual daylight simulations of systems where
complex fenestration systems are applied [45-47]. The results, which can be illuminance or
luminance at any point of interest for a single time step (i) or for a time series (I), are
computed using the following equations:
i=VTDs (6)
16
The sky vector (s) is generated by dividing the whole sky into discrete patches, with each
patch being assigned an average radiance value for a given time and sky condition, while the
sky matrix (S) is a time series of sky vectors.
In this research, the daylight matrix, (D), and view matrix, (V), are obtained based on
the model’s orientation, surrounding environment, geometry and surface properties of the
indoor space using embedded commands in RADIANCE. Sky matrices were obtained from
EnergyPlus weather files (in *.epw format) and this paper presents result based on the file for
London.
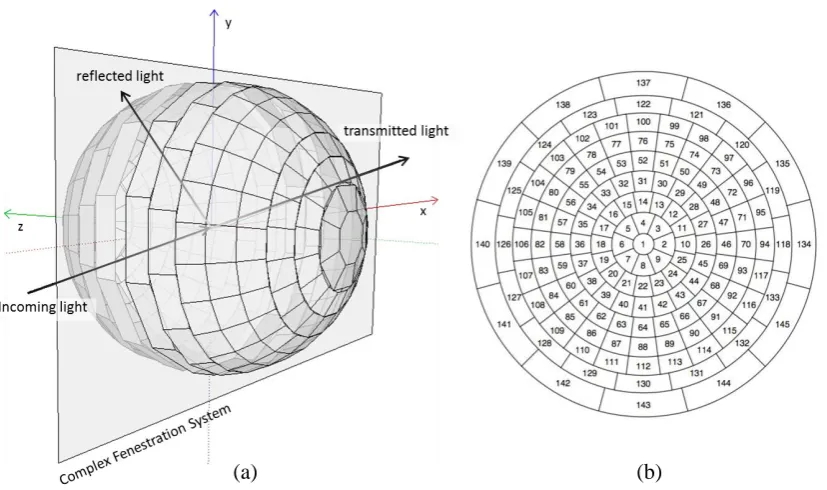
2.3.2 Bidirectional optical properties acquiring method (ray-tracing)
Using BSDFs for characterising complex glazing systems allows them to be
represented with precision in daylight and thermal simulations. The BSDF comprises a
matrix of coefficients that for light from any given incident direction quantifies the
proportion transmitted in all outgoing directions. The use of this approach to represent
complex glazing systems has been validated and proven to overcome the limitations of the
radiosity method [29, 48, 49]. BSDFs may be generated from the geometrical and material
properties of a PS-TIMs using the genBSDF function within RADIANCE [50]. This
sub-divides the space from which light is incident and into which it is transmitted into 145
segments as indicated in Figure 4 (b) [51, 52]. This is formulation proposed by Klems on the
basis that each segment approximately represents an equal cosine-weighted solid angle. The
resulting 145 x 145 matrices may then be used in RADIANCE to enable daylight simulation
17
Figure 4: (a) Schematic diagram of BSDF for one incident angle and (b) Klems 145-patch hemispherical division of space with numbered subdivisions
[image:17.595.78.492.68.313.2]18
3. Integrating
PS-TIM
into
building
performance
simulation
Use of the workflow shown in Figure 2, to explore the behaviour of PS-TIM was
investigated by simulating a single room, based on an office in the Energy Technologies
Building, University of Nottingham in the UK.
3.1
Weather data
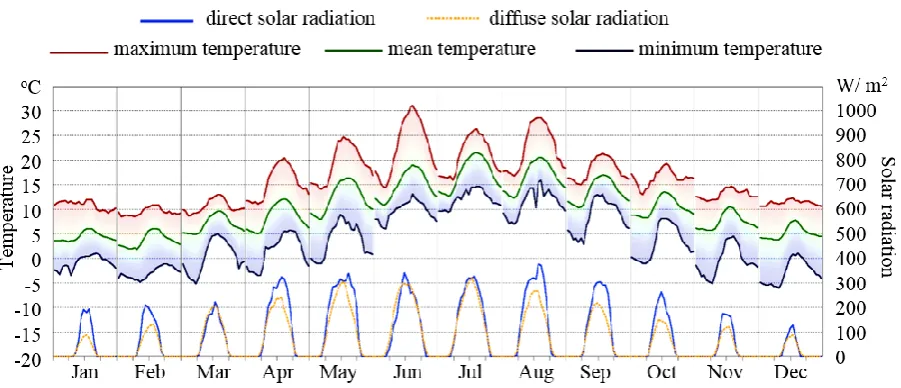
The study was performed over one hour time steps for an average year using IWEC
(International Weather for Energy Calculation) weather file for London (latitude 51.5° N and
the longitude 0° W). The diurnal average temperature and direct and diffuse solar radiation
[image:18.595.75.526.395.589.2]taken from the weather file are presented in Figure 5.
Figure 5: The diurnal average temperature and direct and diffuse solar radiation for London
3.2
Prototype office geometry and modelling
The office glazing was assumed to be south facing and the room considered as part of
a larger building where only the south wall is exposed to external conditions. The remaining
surfaces of the room were assumed to be buffered by mechanically conditioned spaces and
19
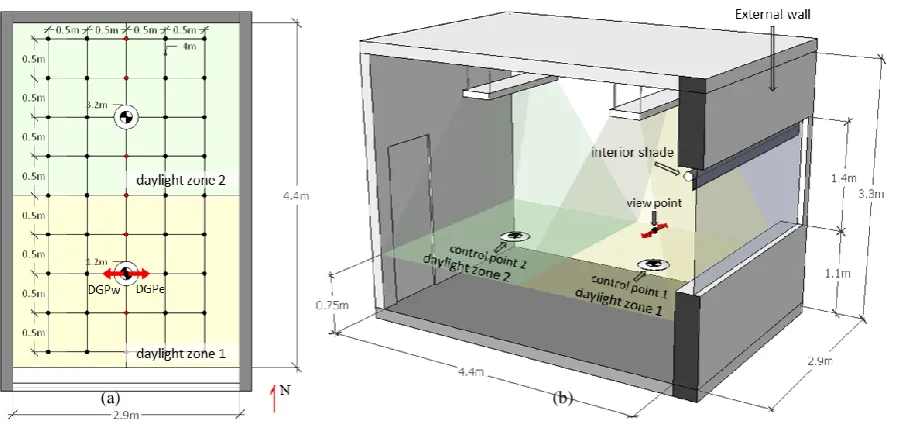
obstructions were not considered in this model. The geometry and settings in building
simulation of the prototype office are shown in Figure 6 and Table 2.
[image:19.595.73.524.127.339.2]Figure 6: (a) Plan view and (b) section view of the simulated office room
Table 2: Settings for building simulation:
General information
Orientation south
Office demissions (m) 2.9 (width) × 4.4 (depth) × 3.3(height)
Window demissions (m) 1.4 (height) × 2.9 (width)
Window height above the floor (m) 1.1
Window to wall ratio 0.42
Number of occupants 2
Number of daylight zone 2
Height of working plane (m) 0.75
Occupancy hours 8:00 – 17:00
Settings used in RADIANCE simulation
Visible reflectance of floor (%) 30
Visible reflectance of wall (%) 80
Visible reflectance of ceiling (%) 80
Visible transmission of double glazed window (%) 78
Number of daylight calculation points 45
Number of view point 1
Height of view point (m) 1.2
View direction east and west
Settings used in EnergyPlus simulations
U-value of exterior wall (W/m2K) 0.43
Equipment load (W/m2) 13
Lighting load (W/m2) 16
Number of lighting control points 2
Illuminance set point for artificial lighting (lux) 500
Temperature setpoint for HVAC system (°C) 21
[image:19.595.63.531.156.745.2]20
3.3
Modelling of building daylight simulation
Three-Phase-Method in RADIANCE [53], which is based on hourly daylight weather
data, was used for annual dynamic simulation of the luminous environment within the office.
As shown in Figure 6 (a) and Table 2, a total of 45 calculation points arranged in a grid over
the working plane were used in the model to determine the illuminance distribution. The
room was assumed to be used by two people, with one positioned near the window and the
second at the back of the room. In order to evaluate the glare, only the occupant position near
window was considered.
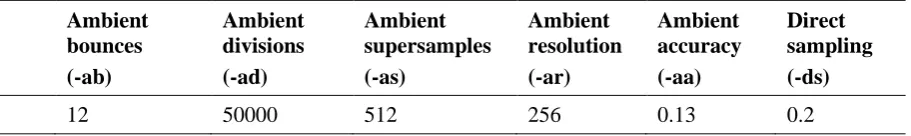
Within this daylight study, the rendering parameters for RADIANCE presented in Table
[image:20.595.67.523.381.449.2]3 were used.
Table 3: RADIANCE simulation parameters
Ambient bounces (-ab) Ambient divisions (-ad) Ambient supersamples (-as) Ambient resolution (-ar) Ambient accuracy (-aa) Direct sampling (-ds)
12 50000 512 256 0.13 0.2
According to investigations undertaken by Wienold and McNeil [36, 47], these settings
seem to deliver reliable values for the given scenes.
Daylight autonomy was quantified using useful daylight illuminance (UDI), which is
based on investigations of occupant response to varying daylight illumination [9, 34]. This
metric adopts lower and upper thresholds to divide the illuminance level during the working
hours of a year into three bins: an undersupply bin (UDI<100 lux), which suggests that the
daylight illuminances are insufficient as a sole source of light; an oversupply bin (UDI>2000
lux), which indicates that the daylight illuminances are very likely to lead to visual and/or
thermal discomfort; and a useful bin (UDI100-2000 lux), which is considered to provide useful
levels of illuminance. Illuminance uniformity ratio (UR) and daylight glare probability (DGP)
21 ratio (UR) is the ratio between maximum and minimum illuminance inside a space [54].
CIBSE [55] recommends that uniformity should not exceed 1:5 for a naturally lit space and
the BREEAM [56] assessment method specifies the daylight ratio between average
illuminance of a given task area and its immediate surrounds of 1:2.5. Considering both
compulsory standard and advanced rating system, the thresholds of UR in this research has
been set from 1.5 to 4.5 with an interval of 1. DGP, which was introduced and validated by
Wienold and Christofferen [57], is the selected metric for assessing discomfort glare. A quick
and simplified calculation method to obtain DGP over a period of a year is based on the
vertical illuminance at the observer (Ev) during each time-step through the following equation
[36, 57]:
𝐷𝐺𝑃 = 6.22 × 10⁻⁵𝐸
𝑣+ 0.184 (8)
Thresholds of 0.35, 0.40 and 0.45 can be used to divide the DGP results calculated for
occupied hours of a year into four bins: lower than 0.35 is ‘imperceptible’ glare sensation,
between 0.35 and 0.40 is ‘perceptible’ between 0.40 and 0.45 is ‘disturbing’, while higher
than 0.45 is deemed ‘intolerable’ [35, 36, 57].
3.4
Inclusion of PS-TIM in building energy simulation
As shown in Figure 6 and Table 2, the room is divided into two daylighting zones
with two control sensors located at the centre of each daylighting zone at a height of working
plane. The daylight illuminance level at these two sensors determines the switching on/off of
two lights for these two halves of the room. The HVAC was assumed to be a unitary system
with direct expansion cooling and gas heating. To simplify the analysis, a single comfort set
point temperature of 21 °C was used all year round. Two scenarios of HVAC operation were
applied: one that assumed the HVAC only operates during occupancy hours and a second that
22
In practise, if the occupants in an office are subject to direct sunlight, they are likely
to respond by lowering an interior shade or blind. To represent this, thresholds for the
horizontal daylight illuminance level on working plane, (E), and a threshold for the daylight
glare probability (DGP) were set. When the DGP at the east or west facing view points, or
the illuminance level at point 1, (E1), exceeded 0.35 or 2000 Lux, respectively [36, 58], an
interior shade was assumed to control the daylight and the artificial lighting was assumed to
be the main source of illumination. Hourly DGP and E1 data were calculated using
RADIANCE and these were then used to generate a schedule in EnergyPlus to control the
shading device. This was assumed to have a reflectance of 0.5 and transmittance of 0.1,
representing a typical medium reflective and low transparency shading device.
3.5
Importing thermal and optical characteristics of PS-TIM into
EnergyPlus
The optical properties of the glazing systems investigated, which were obtained using the
genBSDF utility within RADIANCE, were imported into EnergyPlus using the utility,
WINDOW. This generates a unified file of the complete system that contains the effects of
both the PS-TIM and glazing layers [29], and replaces the traditional radiosity optical model.
The dynamic thermal properties of the PS-TIM, which were calculated under various
temperature conditions using CFD, are in the form of a polynomial describing a series of
equivalent thermal conductivities. The polynomial describing the dynamic equivalent thermal
conductivities of the glazing integrated PS-TIMs at different slat pitches (i.e. 10 mm, 7.5 mm
and 5 mm) were input into EnergyPlus using its built-in ‘Energy Management System’
(EMS) function. This was fed with data from two virtual temperature sensors – one
23
window surface temperatures, a corresponding thermal conductivity was selected from the
dataset in EMS at the beginning of each time-step in the building simulation [59].
3.6
Model verification
EnergyPlus contains a default model for multi-pane windows that estimates the
thermal conductivity of the gas layer based on Nusselt number (Nu) [27, 39]. This was used
to generate heat gain/loss data for comparison with results obtained for a standard double
glazing unit using a CFD generated polynomial accessed by EnergyPlus using EMS. Figure 7
shows heat losses through window for the coldest 3 day period in winter and the heat gains
through window for the warmest 3 days in summer. It can be seen that there is no significant
difference in the heat flows obtained using these two methods. The annual total heating load
from the EMS and Nu methods are 51.95 kWh/m2·yr and 52.71 kWh/m2·yr, respectively and
the cooling loads are 56.05 kWh/m2·yr and 55.50 kWh/m2·yr, respectively. The deviation is
less than 2% in each case. The comparison between these two methods provides a degree of
confidence in the EMS method to represent glazing integrated PS-TIM.
24
Figure 7: (a) Window heat loss under cold weather conditions—3 coldest days; (b) window heat gain under hot weather conditions—3 hottest days. In these plots, EMS-method relates to predictions made using the EMS function in
EnergyPlus and Nu-method relates to predictions made using the default Nusselt number method in EnergyPlus.
[image:24.595.127.474.69.308.2]25
4. Building simulation results and discussion
4.1
Optical performance of the PS-TIM
Detailed daylight predictions for the double glazing unit with and without PS-TIM
obtained using RADIANCE were used to explore its effects on daylight availability and
daylight comfort. The predicted illuminances during working hours were analysed using
useful daylight illuminance (UDI), daylight glare probability (DGP) and illuminance
uniformity ratio (UR).
4.1.1 Daylight availability after applying PS-TIM
Useful daylight illuminance (UDI) was used to evaluate daylight availability for the
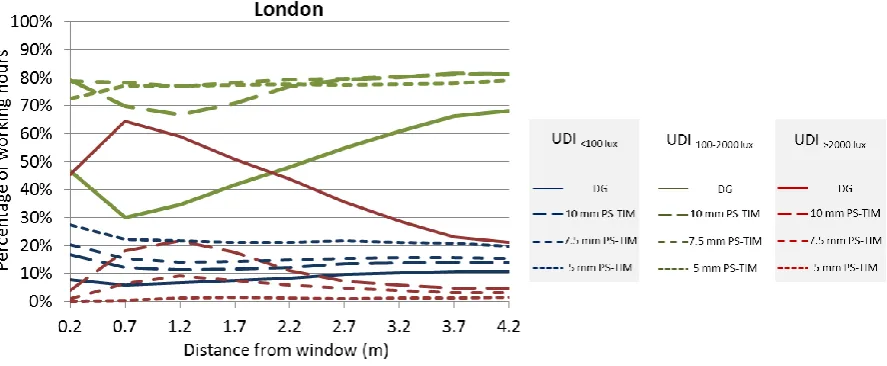
glazing system with and without integrated PS-TIMs. Figure 8 shows the predicted UDI
along the central line of the office between the window to the end wall. The blue, green and
red lines represent undersupply UDI, usefulUDI and oversupply UDI conditions, respectively.
Overall, when a normal double glazed window is used (DG on Figure 8), periods when the
illuminance exceeds 2000 lux account for over 50% hours of the year for the zone next to the
window. This gradually reduces for points further from the window. The use of 5 mm
PS-TIM can eliminate the oversupply of daylight, however in so doing, the undersupplied
daylight hours increase from less than 10% when the original DG is used to more than 20%.
The percentage of hours where the UDI is in the useful range increase from 30% for the
conventional DG to 68% for the 10mm PS-TIM and rise to 80 % for the PS-TIMs with 7.5
mm and 5 mm slat pitches. The data in the useful range also imply that the daylight is
relatively evenly distributed throughout the room, especially for the PS-TIMs with slat
pitches of 7.5 mm and 5 mm. Thus, the integration of PS-TIM improves the daylighting
quality of the room, especially within the region next to the window where over illumination
26
Figure 8: UDI distribution in the office with glazing integrated PS-TIM
4.1.2 Daylight comfort after applying PS-TIM
Figure 9 (a) shows the uniformity inside the office derived from the 45 daylight study
points. When the original DG is used, the natural daylight transmitted to the room results in
sharp contrasts, between a strongly illuminated area close to the window and the remainder of
the room. For 42% of the working hours during the year, the room has a UR larger than 1:4.5
and a further 47% of hours have a ratio in the range of 1:3.5 ~ 1:4.5, indicating that for over
90% of this period, uniformity significantly exceeds the recommended BREEAM maximum
thershold of 1:2.5 for daylighting good practice. The integration of PS-TIM effectively
improves the daylight uniformity. The hours with UR exceeding 1:2.5 have been reduced
[image:26.595.77.521.74.257.2]27
Figure 9: (a) Uniformity for glazing with and without PS-TIM, (b) DGP for glazing with and without PS-TIM.
The results of Daylight glare probability (DGP) for the double glazing with and
without PS-TIM are shown in Figure 9 (b). For the original double glazed window,
intolerable glare (DGP ≥ 0.45), disturbing glare (0.4 < DGP < 0.45), and perceptible glare
(0.35 < DGP < 0.4) account for 13.9%, 6.4% and 16.6% of occupied hours, respectively.
When diffuse translucent PS-TIM structures were applied, significant improvement of the
percentage of imperceptible glare (DGP ≤ 0.35) is achieved. The figure increases from 63.1%
of working hours for DG to 93.4%, 96.5% and 99.2% with the application of PS-TIM with
slat pitches of 10 mm, 7.5 mm and 5 mm, respectively. According to the Wienold’s criteria
[36] for categorising glare conditions in a room, when the 7.5 mm and 5 mm PS-TIM are
applied, the room has a ‘Best’ classification for over 95% of office working hours and the
glare sensation would be deemed imperceptible. The 10 mm PS-TIM offers a ‘Good’
classification as for over 95% of office working hours the glare is perceptible. These
luminous environment quality simulations were carried out independently of the energy
simulation and so do not include the contribution made by artificial lighting and use of
shading described in the next section.
4.1.3 Requirement for interior shading to prevent strong daylight
In practice, if the occupants in a working space are disrupted by high illuminance
levels or glare from the windows, they are likely deploy interior shading devices if they are
present. This would significantly reduce the availability of daylight, and hence result in the
illuminance level deeper within the space becoming insufficient for work. Consequently,
artificial lighting is required.
PS-TIMs have been integrated into double glazing to reduce the probability of using
interior blinds. Figure 10 shows the average hours per week when shading is deployed on two
28
per week, the average hours when shading is used reduce from 34.3 hours for the space
illuminated via DG to 6.5 hours for a glazing unit with 10 mm PS-TIM. Integration of 5 mm
[image:28.595.131.467.164.395.2]PS-TIM can nearly eliminate the requirement for interior shading.
Figure 10: Average number of hours per working week when discomfort daylight conditions exist. Simulation performed using London EPW data
4.2
Total energy consumption after applying PS-TIM
This section presents the annual energy consumption of the office for the different
glazing configurations. The energy consumption is expressed in terms of kWh/m2 per year
and they are further divided into heating, cooling and lighting energy consumption. For the
purpose of predicting the potential energy saving resulting from the use of PS-TIMs, the
energy consumption using a conventional double gazed window with and without an interior
shading are also calculated for comparison. Two HVAC scenarios were investigated: a
scenario where the HVAC operates during working hours from 8:00 to 17:00 on weekdays
and a scenario where the HVAC operates continually throughout the year.
As shown in Figure 11, the 10 mm PS-TIM provides the best overall energy
29
Compared with the conventional double gazed window with interior shading, an overall
energy reduction of 15.5% can be achieved under the selected London climate. Most of the
energy reduction occurs in lighting and cooling. Adoption of the 10 mm PS-TIM delivered
lighting energy savings of 25.7%, a cooling energy saving of 24.6%, and a more modest 2.4%
heating energy saving. This can be explained by the hourly window heat gain, heat loss and
the space heating energy consumption for the window with and without 10 mm PS-TIM
during a typical 48 hours period in winter as shown in Figure 12. Day 1 represented an
overcast day without obvious solar heat gain and day 2 represented a clear sky condition with
plenty of passive solar heat gain. Although, the presence of PS-TIM increases the thermal
resistance of the window system, and hence reduces the heat loss, it simultaneously reduces
the solar heat gain that is transmitted through the window and warms up the office during the
daytime (Figure 12 (a)). In winter, these work against each other and the balance results in
only a modest reduction in heating energy consumption. Therefore, when the HVAC system
operates during working hours only, the heating energy consumption for the office with a
window system with a better thermal resistance provided by PS-TIM dose not result in a
[image:29.595.171.488.532.724.2]significant total energy reduction.
30
Figure 12: (a) Hourly window heat gain, heat loss and (b) hourly space heating loads for a window with and without
PS-TIM when HVAC operates between 9:00-17:00 on workdays. Simulation performed using London EPW data.
The benefits of integrating PS-TIM into glazing systems grows significantly if it is
assumed the HVAC operates continually through the year. As may be seen from Figure 13,
7.5 mm PS-TIM provides best energy saving potential. The heating demand is dramatically
reduced by 30.9% lighting energy savings of 31.2% are achieved and a cooling energy drops
by 42.8%. The reason for the improved performance especially for the PS-TIM with smaller
interval distance (i.e. 7.5mm and 5 mm) is that while the issue of reduced solar gains is still
(a)
[image:30.595.134.463.69.540.2]31
present during daylight hours, the improved thermal resistance results in a dramatic reduction
of heating energy demand during the night time as illustrated in Figure 14.
Figure 13: Annual heating, cooling and lighting energy consumption when HVAC operates continually. Simulation performed using London EPW data.
[image:31.595.174.477.134.323.2]32
Figure 14: (a) Hourly window heat gain, heat loss and (b) hourly space heating energy consumption of applying window system with and without PS-TIM when HVAC operates continually. Simulation performed using London EPW data.
The analysis of energy consumption under these two HVAC operation scenarios
illustrates how the proposed work flow may be employed to offer a quantitative assessment
of the effect of varying thermal and optical properties of building glazing through the
integration of PS-TIMs.
[image:32.595.155.445.72.299.2]33
5. Conclusion
A good glazing system needs to simultaneously solve the problems of visual
discomfort and energy inefficiency that are evident when conventional double glazed window
systems are used. This research developed a comprehensive workflow for simulating the
performance of spaces served by complex glazing systems, which was then used to
investigate the thermal and optical performance of a window system with Parallel Slat
Transparent Insulation Material (PS-TIM) and its impact on building performance. In this
model, EnergyPlus has been combined with a thermal model developed using Computational
Fluid Dynamics and an optical model developed using a ray-tracing technique to predict the
impact of PS-TIM on building heating, lighting and cooling energy consumption.
RADIANCE has been used to predict detailed daylight performance of a space served by
windows with integrated PS-TIM. Based on the application of this workflow to explore the
performance of a small office space served by a glazing integrated PS-TIM window, the
following conclusions can be drawn:
1) The workflow for predicting building daylight and energy performance has been verified
and has the potential to provide a detailed prediction of performance.
2) The integration of PS-TIM improves the luminous environment within the space it serves,
especially within the region that is close to the window where over illumination, which is
frequently a problem with conventional glazing, is controlled and glare is virtually
eliminated.
3) When compared with a conventional double glazed window combined with an interior
shade to counter over illumination and glare, applying PS-TIM in London (as represented
34
operates during working hours and up to 33.6 % energy reduction when HVAC operated
continually.
This study has not explored the impact of using PS-TIM on view either out of or into
space served by PS-TIM, and this represents a limitation that requires further study. However,
the workflow that combines the outputs from CFD and optical modelling tools and integrates
these into EnergyPlus to provide a holistic energy simulation of spaces served by glazing
integrated PS-TIM is a new development. This offers a first step in developing design
strategies that seek to balance view considerations with the improvements in thermal and
luminous environment of spaces served by glazing integrated PS-TIM systems.
Acknowledgements
This work was supported by the Faculty of Engineering, University of Nottingham
and the China Scholarship Council through a joint PhD studentship awarded to Yanyi Sun.
This work is also supported by the National Natural Science Foundation (Grant No.
35
Reference:
[1] Singh R, Lazarus IJ, Kishore VVN. Effect of internal woven roller shade and glazing on the energy and daylighting performances of an office building in the cold climate of Shillong. Applied Energy. 2015;159:317-33.
[2] Allen K, Connelly K, Rutherford P, Wu Y. Smart windows—Dynamic control of building energy performance. Energy and Buildings. 2017;139:535-46.
[3] Connelly K, Wu Y, Chen J, Lei Y. Design and development of a reflective membrane for a novel Building Integrated Concentrating Photovoltaic (BICPV) ‘Smart Window’ system. Applied Energy. 2016;182:331-9.
[4] Wu Y, Gan G, Gonzalez RG, Verhoef A, Vidale PL. Prediction of the thermal performance of horizontal-coupled ground-source heat exchangers. International Journal of Low-Carbon Technologies. 2011;6:261-9.
[5] Ihara T, Gustavsen A, Jelle BP. Effect of facade components on energy efficiency in office buildings. Applied Energy. 2015;158:422-32.
[6]Liu X, Gao H, Sun Y, Wu Y, Martin B, Chilton J, Mirzaei P, Zhang X, Beccarelli P, Lau B. Thermal and optical analysis of a passive heat recovery and storage system for greenhouse façade/roof. Procedia Engineering. 2016;155:471-8.
[7] Vanzo S, Kostro A, Schüler A. Location Based Study of the Annual Thermal Loads with Microstructured Windows in European Climates. Energy Procedia. 2015;78:91-6.
[8] Huang Y, Niu J-l, Chung T-m. Comprehensive analysis on thermal and daylighting performance of glazing and shading designs on office building envelope in cooling-dominant climates. Applied Energy. 2014;134:215-28.
[9] Mangkuto RA, Rohmah M, Asri AD. Design optimisation for window size, orientation, and wall reflectance with regard to various daylight metrics and lighting energy demand: A case study of buildings in the tropics. Applied Energy. 2016;164:211-9.
[10] Buratti C, Moretti E. Glazing systems with silica aerogel for energy savings in buildings. Applied Energy. 2012;98:396-403.
[11] Sun Y, Wu Y, Wilson R, Lu S. Experimental measurement and numerical simulation of the thermal performance of a double glazing system with an interstitial Venetian blind. Building and Environment. 2016 103:111-22.
[12] Sun Y, Wu Y, Wilson R, Sun S. Thermal evaluation of a double glazing façade system with integrated Parallel Slat Transparent Insulation Material (PS-TIM). Building and Environment. 2016;105:69-81.
[13] Kotey NA, Collins MR, Wright JL, Jiang T. A Simplified Method for Calculating the Effective Solar Optical Properties of a Venetian Blind Layer for Building Energy Simulation. Journal of Solar Energy Engineering. 2009;131:021002.
[14] Naylor D, Lai BY. Experimental Study of Natural Convection in a Window with a Between-Panes Venetian Blind. Experimental Heat Transfer. 2007;20:1-17.
[15] Fang X. A Study of the U-Factor of the Window with a High-Reflectivity Venetian Blind. Solar Energy. 2000;68:207-14.
[16] Chaiyapinunt S, Khamporn N. Shortwave thermal performance for a glass window with a curved venetian blind. Solar Energy. 2013;91:174-85.
[17] Xu X, Yang Z. Natural ventilation in the double skin facade with venetian blind. Energy and Buildings. 2008;40:1498-504.
36
[19] Chaiyapinunt S, Khamporn N. Heat transmission through a glass window with a curved venetian blind installed. Solar Energy. 2014;110:71-82.
[20] Sun Y, Wu Y, Wilson R. Analysis of the daylight performance of a glazing system with Parallel Slat Transparent Insulation Material (PS-TIM). Energy and Buildings. 2017;139:616-33.
[21] Zanghirella F, Perino M, Serra V. A numerical model to evaluate the thermal behaviour of active transparent façades. Energy and Buildings. 2011;43:1123-38. [22] Li DHW. A review of daylight illuminance determinations and energy implications. Applied Energy. 2010;87:2109-18.
[23] Loonen RCGM, Favoino F, Hensen JLM, Overend M. Review of current status, requirements and opportunities for building performance simulation of adaptive facades. Journal of Building Performance Simulation. 2016:1-19.
[24] Crawley DB, Hand JW, Kummert M, Griffith BT. Contrasting the capabilities of building energy performance simulation programs. Building and Environment. 2008;43:661-73.
[25] Tian C, Chen T, Chung T. Experimental and simulating examination of computer tools, Radlink and DOE2, for daylighting and energy simulation with venetian blinds. Applied Energy. 2014;124:130-9.
[26] Gong J, Kostro A, Motamed A, Schueler A. Potential advantages of a multifunctional complex fenestration system with embedded micro-mirrors in daylighting. Solar Energy. 2016;139:412-25.
[27] EnergyPlus. Engineering Reference. 2013.
[28] Wang Y, Chen Y. Modeling and calculation of solar gains through multi-glazing facades with specular reflection of venetian blind. Solar Energy. 2016;130:33-45. [29] McNeil A, Jonsson CJ, Appelfeld D, Ward G, Lee ES. A validation of a ray-tracing tool used to generate bi-directional scattering distribution functions for complex fenestration systems. Solar Energy. 2013;98:404-14.
[30] Chan Y-C, Tzempelikos A. A hybrid ray-tracing and radiosity method for calculating radiation transport and illuminance distribution in spaces with venetian blinds. Solar Energy. 2012;86:3109-24.
[31] Fernandes LL, Lee ES, McNeil A, Jonsson JC, Nouidui T, Pang X, et al. Angular selective window systems: Assessment of technical potential for energy savings. Energy and Buildings. 2015;90:188-206.
[32] Hoffmann S, Lee ES, McNeil A, Fernandes L, Vidanovic D, Thanachareonkit A. Balancing daylight, glare, and energy-efficiency goals: An evaluation of exterior coplanar shading systems using complex fenestration modeling tools. Energy and Buildings. 2016;112:279-98.
[33] Firląg S, Yazdanian M, Curcija C, Kohler C, Vidanovic S, Hart R, Czarnecki S. Control algorithms for dynamic windows for residential buildings. Energy and Buildings. 2015;109:157-73.
[34] Nabil A, Mardaljevic J. Useful daylight illuminances: A replacement for daylight factors. Energy and Buildings. 2006;38:905-13.
[35] Wienold J. Dynamic simulation of blind control strategies for visual comfort and energy balance analysis. Building simulation 2007, the 10th international IBOSA conference. Beijing, China2007. p. 1197-204.
[36] Wienold J. Dynamic daylight glare evaluation. Builing simulation 2009 the 11th international IBOSA conference. Glasgow, UK2009. p. 44-51.
37
[38] Yoon YB, Kim DS, Lee KH. Detailed heat balance analysis of the thermal load variations depending on the blind location and glazing type. Energy and Buildings. 2014;75:84-95.
[39] ISO. 15099: Thermal performance of windows, doors and shading devices -- Detailed calculations. 2003.
[40] Giorgi LD, Bertola V, Cafaro E. Thermal convection in double glazed windows with structured gap. Energy and Buildings. 2011;43:2034-8.
[41] Dalal R, Naylor D, Roeleveld D. A CFD study of convection in a double glazed window with an enclosed pleated blind. Energy and Buildings. 2009;41:1256-62. [42] Avedissian T, Naylor D. Free convective heat transfer in an enclosure with an internal louvered blind International Journal of Heat and Mass Transfer. 2008;51:283-93.
[43] Naylor D, Collins M. Evaluation of an Approximate Method for Predicting The U-value of a Window with a between-Panes Blind. Numerical Heat Transfer, Part A: Applications. 2005;47:233-50.
[44] Collins M, Tasnim S, Wright J. Numerical analysis of convective heat transfer in fenestration with between-the-glass louvered shades. Building and Environment. 2009; 44:2185-92.
[45] Saxenab M, Ward G, Perry T, Heschong L, Higa R. Dynamic RADIANCE – Predicting annual daylight with variable fenestratio optics using BSDFs. Fourth National Conference of IBPSA-USA. New York City, USA2010.
[46] Ward G, Mistrick R, Lee ES, McNeil A, Jonsson J. Simulating the daylight performance of Complex Fenestration Systems using Bidirectional Scattering Distribution Functions within Radiance. Journal of the Illuminating Engineering Society of North America 2011;7.
[47] McNeil A. The Three-Phase Method for simulation Complex Fenestration with Radiance. 2014.
[48] Andersen M, Rubin M, Powles R, Scartezzini JL. Bi-directional transmission properties of Venetian blinds: experimental assessment compared to ray-tracing calculations. Solar Energy. 2005;78:187-98.
[49] Andersen M, Rubin M, Scartezzini J-L. Comparison between ray-tracing simulations and bi-directional transmission measurements on prismatic glazing. Solar Energy. 2003;74:157-73.
[50] Ward G, Shakespeare R. Rendering with Radiance: The Art and Science of Lighting Visualization, Revised Edition: BookSurge, LLC; 2004.
[51] Klems JH. A new method for predicting the solar heat gain of complex fenestration systems II. detailed description of the matrix layer calculation. ASHRAE Transactions. 1994;100.
[52] Klems JH. A new method for predicting the solar heat gain of complex fenestration systems—1, overview and derivation of the matrix layer calculation. ASHRAE Transactions. 1994;100.
[53] McNeil A, Lee ES. A validation of the Radiance three-phase simulation method for modelling annual daylight performance of optically complex fenestration systems. Journal of Building Performance Simulation. 2013;6:24-37.
[54] Ochoa CE, Aries MBC, van Loenen EJ, Hensen JLM. Considerations on design optimization criteria for windows providing low energy consumption and high visual comfort. Applied Energy. 2012;95:238-45.
[55] CIBSE. Guide A - Environmental Design. 7 ed. London: CIBSE Publications; 2006.
38
[57] Wienold J, Christoffersen J. Evaluation methods and development of a new glare prediction model for daylight environments with the use of CCD cameras. Energy and Buildings. 2006;38:743-57.
[58] Singh R, Lazarus IJ, Kishore VVN. Uncertainty and sensitivity analyses of energy and visual performances of office building with external venetian blind shading in hot-dry climate. Applied Energy. 2016;184:155-70.