Open Peer Review
Discuss this article (0)
Comments RESEARCH NOTE
Spatial band-pass filtering aids decoding musical genres
from auditory cortex 7T fMRI [version 2; referees: 2 approved]
Ayan Sengupta
,
Stefan Pollmann
, Michael Hanke
3,4
Sir Peter Mansfield Imaging Centre, School of Physics and Astronomy, University of Nottingham, Nottingham, UK Department of Experimental Psychology, Institute of Psychology, Otto-von-Guericke University, Magdeburg, Germany Psychoinformatics Lab, Institute of Psychology, Otto-von-Guericke University, Magdeburg, Germany
Center for Behavioral Brain Sciences, Magdeburg, Germany
Abstract
Spatial filtering strategies, combined with multivariate decoding analysis of BOLD images, have been used to investigate the nature of the neural signal underlying the discriminability of brain activity patterns evoked by sensory stimulation – primarily in the visual cortex. Previous research indicates that such signals are spatially broadband in nature, and are not primarily comprised of fine-grained activation patterns. However, it is unclear whether this is a general property of the BOLD signal, or whether it is specific to the details of employed analyses and stimuli. Here we applied an analysis strategy from a previous study on decoding visual orientation from V1 to publicly available, high-resolution 7T fMRI on the response BOLD response to musical genres in primary auditory cortex. The results show that the pattern of decoding accuracies with respect to different types and levels of spatial filtering is comparable to that obtained from V1, despite considerable differences in the respective cortical circuitry.
1,2
2,3
3,4
1
2
3
4
Referee Status:
Invited Referees
version 2 published 04 Apr 2018
version 1 published 02 Feb 2018
1 2
report
report report
, The University of
Cyril R. Pernet
Edinburgh, UK 1
, Radboud University
David G. Norris
Nijmegen, Netherlands 2
02 Feb 2018, :142 (doi: )
First published: 7 10.12688/f1000research.13689.1
04 Apr 2018, :142 (doi: )
Ayan Sengupta ( )
Corresponding author: [email protected]
: Conceptualization, Formal Analysis, Investigation, Methodology, Software, Validation, Visualization, Writing – Original
Author roles: Sengupta A
Draft Preparation, Writing – Review & Editing; Pollmann S: Conceptualization, Funding Acquisition, Writing – Review & Editing; Hanke M: Conceptualization, Data Curation, Formal Analysis, Funding Acquisition, Investigation, Methodology, Project Administration, Resources, Software, Supervision, Validation, Visualization, Writing – Original Draft Preparation, Writing – Review & Editing
No competing interests were disclosed.
Competing interests:
Sengupta A, Pollmann S and Hanke M.
How to cite this article: Spatial band-pass filtering aids decoding musical genres from auditory
2018, :142 (doi: )
cortex 7T fMRI [version 2; referees: 2 approved]F1000Research 7 10.12688/f1000research.13689.2
© 2018 Sengupta A . This is an open access article distributed under the terms of the ,
Copyright: et al Creative Commons Attribution Licence
which permits unrestricted use, distribution, and reproduction in any medium, provided the original work is properly cited. Data associated with the article are available under the terms of the Creative Commons Zero "No rights reserved" data waiver (CC0 1.0 Public domain dedication).
AS and SP were supported by a grant from the German Research Concil (DFG) awarded to S.~Pollmann (PO~548/15-1), MH
Grant information:
was supported by funds from the German federal state of Saxony-Anhalt and the European Regional Development Fund (ERDF), Project: Center for Behavioral Brain Sciences. This research was, in part, also supported by the German Federal Ministry of Education and Research (BMBF) as part of a US-German collaboration in computational neuroscience (CRCNS; awarded to J.V. Haxby, P. Ramadge, and M. Hanke), co- funded by the BMBF and the US National Science Foundation (BMBF 01GQ1112; NSF 1129855).
The funders had no role in study design, data collection and analysis, decision to publish, or preparation of the manuscript.
02 Feb 2018, :142 (doi: )
Introduction
We recently reported1 that spatial band-pass filtering of 7 Tesla BOLD fMRI data boosts accuracy of decoding visual orienta-tions from human V1. We observed this result in comparison to data without any dedicated spatial filtering applied, and spatially low-pass filtered data – a typical preprocessing strat-egy for BOLD fMRI. This effect was present across a range of tested spatial acquisition resolutions, ranging from 0.8 mm to 2 mm isotropic voxel size (Figure 4 in 1). The bandpass spatial filtering procedure was performed by a difference-of-Gaussians (DoG) filter similar to Supplementary Figure 5 in 1. The fre-quency bands indicated the presence of orientation-related signal in a wide range of spatial frequencies as indicated by above-chance decoding performance for nearly all tested bands. Maximum decoding performance was observed for a band of 5–8 mm full width at half maximum (FWHM), indicating that low spatial frequency fMRI components also contribute to noise with respect to orientation discrimination.
This finding raises the question whether this reflects a specific property of early visual cortex and the particular stimuli used in 1, or whether it represents a more general aspect of BOLD fMRI data with implications for data preprocessing of decoding analyses. Here, we investigate this question by applying the identical analysis strategy from 1 to a different public 7 Tesla BOLD fMRI dataset2, with the aim of decoding the musical genres of short audio clips from the early auditory cortex.
Methods
As this study aims to replicate previously reported findings, by employing a previously published analysis strategy on an exist-ing dataset, the full methodological details are not repeated here. Instead the reader is kindly referred to 2, 3 for compre-hensive descriptions of the data, and to 1 for details on the
analysis strategy and previous findings. Only key information and differences are reported below.
Stimulus and fMRI data
Data were taken from a published dataset2 which were repeat-edly analyzed previously4,5, and publicly available from the studyforrest.org project of 20 participants passively listening to five natural, stereo, high-quality music stimuli (6 s duration; 44.1 kHz sampling rate) for each of five different musical genres: 1) Ambient, 2) Roots Country 3) Heavy Metal, 4) 50s Rock’n’Roll, and 5) Symphonic, while fMRI data were recorded in a 7 Tesla Siemens scanner (1.4 mm isotropic voxel size, TR=2 s, matrix size 160×160, 36 axial slices, 10% interslice gap). fMRI data were scanner-side corrected for spatial distortions6. Stimulation timing and frequency were roughly com-parable to 1: 25 vs. 30 trials per run, 10 s vs. 8 s minimum inter-trial stimulus onset asynchrony in a low event-related design, 8 vs. 10 acquisition runs. Subject 20 was excluded from the analysis due to incomplete data.
Region of interest (ROI) localization
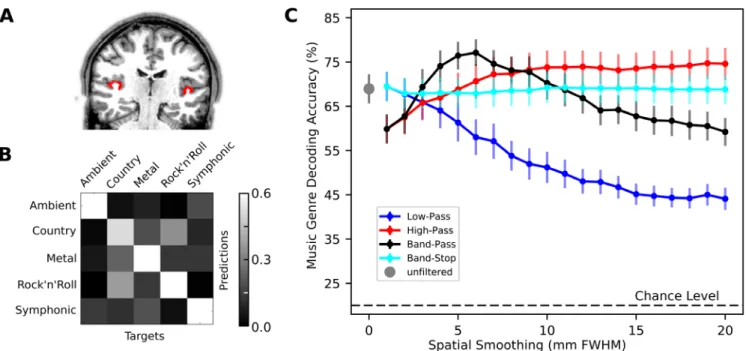
Analogous to 1, ROIs were localized separately for each indi-vidual brain. ROIs were left and right transversetemporal gyri, as defined by the structural Desikan-Killiany atlas7 from the previously published Freesurfer-based cortex parcellations for all studyforrest.org participants3. This ROI approximates the location of primary auditory cortex, including Broadmann areas 41 and 42 (Figure 1A). The average number of voxels in the ROI across participants was 1412 (std=357).
fMRI data analysis
Motion-corrected and distortion-corrected BOLD images from the publicly available dataset2 were analyzed. Images for each participant, available from the dataset as the filename pattern of
sub*/BOLD/task002_run*/bold_dico_bold7Tp1_ to_subjbold7Tp1.nii.gz were already aligned across acquisition runs. Analogous to 1, BOLD images were masked to the defined bilateral ROI, and voxelwise BOLD response were univariately modelled for each run using the GLM implemen-tation in NiPy [v0.3;8] while accounting for serial correlation with an autoregressive term (AR1). The GLM design matrix included hemodynamic response regressors, one for each genre and its corresponding temporal derivatives for improved param-eter estimation9, six nuisance regressors for motion (translation and rotation), and polynomial regressors (up to 2nd-order) modeling temporal signal drift as regressors of no-interest. The
β weights thus computed for each run were Z-scored per voxel. Multivariate decoding was performed on these Z-scored β weights using linear support vector machines [SVM; PyMVPA’s LinearCSVMC implementation of the LIBSVM classification algorithm;10,11 in a within-subject leave-one-run-out cross- validation of 5-way multi-class classification of musical genres. Leave-one-out cross-validation was performed in order to enable comparison with previous results although it has been recently argued that repeated random splits are a superior validation
Amendments from Version 1
This revision has addressed the concerns raised by the reviewers of this article. Following are the details:
Minor changes including typos like ‘gaussian’- > ‘Gaussian’, ‘prior masking’ -> ‘prior to masking’ etc. have been performed according to Prof. Norris’s comments. It has been explicitly mentioned that ‘axial’ slices were acquired. Moreover, the conversion of units from ‘FWHM’ to ‘cycles/mm’ has been properly referred to. The probable reason for auditory decoding performing better than visual decoding is also discussed in the Results and Conclusion section.
In order to address Dr. Pernet’s comments, explicit mentions in the manuscript have been made to highlight the use of inclusion of temporal derivatives in the design matrix. In addition, the appropriateness of applying repeated random sampling instead of leave-one-out cross validation is also discussed in the manuscript.
See referee reports
scheme12. The hyper-parameter C of the SVM classifier was scaled to the norm of the data. Decoding was performed using the entire bilateral ROI.
In-line with 1, 13, complete BOLD images were spatially fil-tered prior to masking and GLM-modeling, as prior results suggest negligible impact of alternative filtering strategies (see Figure S4 in 1). The magnitude of spatial filtering used is expressed in terms of the size of the Gaussian filter kernel(s) described by their FWHM in mm (a conversion of this unit to (cycles/mm) is shown in Supplementary Figure 5 in 1). The
image_smooth() function in the nilearn package14 was used to implement all spatial smoothing procedures. The implemen-tations of Gaussian low-pass (LP), and high-pass (HP) filters, as well as the DoG filters for bandpass (BP) and bandstop (BS) filtering are identical to those of1 (1 mm FWHM filter size difference).
Results and conclusions
Figure 1 shows the mean accuracy across 19 participants for classifying the genre of music clips from BOLD response pat-terns of bilateral early auditory cortex. Compared to visual orientation decoding from V11, the mean accuracy of decod-ing musical genres without dedicated spatial filterdecod-ing exhibits a substantially higher baseline (for 1.4 mm unfiltered data, mean orientation decoding accuracy was around 35%, whereas mean decoding of musical genres was at around 65%). However, the general pattern of accuracies across all filter sizes and filter types strongly resembles the results of orientation decoding
from V1. The superior decoding performance here, in comparison to oriented gabor gratings used for visual decod-ing, could be the result of the richer naturalistic stimuli with features like pitch, timbre, and speech lead to more separa-ble fMRI activation patterns across genres. LP filtering led to a steady decline of performance with increasing filter size, but does not reach chance level even with a 20 mm smoothing ker-nel. In contrast to LP filtering, HP filtered data yielded superior decoding results for filter sizes of 4 mm and larger. Congruent with 1, BP filtering led to maximum decoding accuracy in the ≈5–8 mm FWHM band. The accuracy achieved on BP filtered data at 6mm FWHM was significantly higher than that without any dedicated spatial filtering (McNemar test with continuity correction15: χ2=33.22, p<10−6). BS filtering led to an approximately constant performance regardless of the base filter size, on the same level as with no dedicated spatial filtering.
ences between the auditory and visual cortex in terms of anat-omy, synaptic physiology, and the circuity of cortical layers and their connections with other cortical areas and subcortical nuclei20. The present results indicate that these differ-ences have little impact on the spatial characteristics of those BOLD signal components that are relevant for decoding visual orientation or genre of music. In summary, these find-ings call for further investigations of neural and physiological signals underlying decoding models that are common across sensory domains, and individual cortical areas. The increasing availability of diverse open brain imaging data can help to aid the evaluation of generality and validity of explanatory models.
Data and software availability
OpenFMRI.org: High-resolution 7-Tesla fMRI data on the perception of musical genres. Accession number: ds000113b.
Article sources for 7-Tesla fMRI data on the perception of musical genres are available: https://doi.org/10.5281/zen-odo.1876721
“Forrest Gump” data release source code is available: https://doi. org/10.5281/zenodo.1877022
available: https://doi.org/10.5281/zenodo.115883623
Competing interests
No competing interests were disclosed.
Grant information
AS and SP were supported by a grant from the German Research Concil (DFG) awarded to S. Pollmann (PO 548/15-1), MH was supported by funds from the German federal state of Saxony-Anhalt and the European Regional Development Fund (ERDF), Project: Center for Behavioral Brain Sciences. This research was, in part, also supported by the German Federal Ministry of Education and Research (BMBF) as part of a US-German collaboration in computational neuroscience (CRCNS; awarded to J.V. Haxby, P. Ramadge, and M. Hanke), co-funded by the BMBF and the US National Science Foundation (BMBF 01GQ1112; NSF 1129855).
The funders had no role in study design, data collection and analysis, decision to publish, or preparation of the manuscript.
References
1. Sengupta A, Yakupov R, Speck O, et al.: The effect of acquisition resolution on orientation decoding from V1 BOLD fMRI at 7T. Neuroimage. 2017; 148: 64–76.
PubMed Abstract |Publisher Full Text
2. Hanke M, Dinga R, Häusler C, et al.: High-resolution 7-Tesla fMRI data on the perception of musical genres – an extension to the studyforrest dataset [version 1; referees: 2 approved with reservations]. F1000Res. 2015; 4: 174.
Publisher Full Text
3. Hanke M, Baumgartner FJ, Ibe P, et al.: A high-resolution 7-Tesla fMRI dataset from complex natural stimulation with an audio movie. Sci Data. 2014; 1: 140003.
PubMed Abstract |Publisher Full Text |Free Full Text
4. Güçlü U, Thielen J, Hanke M, et al.: Brains on beats. In Advances in Neural
Information Processing Systems. 2016; 2101–2109. Reference Source
5. Casey MA: Music of the 7Ts: Predicting and Decoding Multivoxel fMRI Responses with Acoustic, Schematic, and Categorical Music Features. Front
Psychol. 2017; 8: 1179.
PubMed Abstract |Publisher Full Text |Free Full Text
6. In MH, Speck O: Highly accelerated PSF-mapping for EPI distortion correction with improved fidelity. MAGMA. 2012; 25(3): 183–192.
PubMed Abstract |Publisher Full Text
7. Desikan RS, Ségonne F, Fischl B, et al.: An automated labeling system for subdividing the human cerebral cortex on MRI scans into gyral based regions of interest. Neuroimage. 2006; 31(3): 968–980.
PubMed Abstract |Publisher Full Text
8. Millman KJ, Brett M: Analysis of functional magnetic resonance imaging in Python. Comput Sci Eng. 2007; 9(3): 52–55.
Publisher Full Text
9. Pernet CR: Misconceptions in the use of the General Linear Model applied to functional MRI: a tutorial for junior neuro-imagers. Front Neurosci. 2014; 8: 1.
PubMed Abstract |Publisher Full Text |Free Full Text
10. Chang CC, Lin CJ: LIBSVM: A library for support vector machines. ACM Trans
Intell Syst Technol. 2011; 2(3): 27.
Publisher Full Text
11. Hanke M, Halchenko YO, Sederberg PB, et al.: PyMVPA: A Unifying Approach to the Analysis of Neuroscientific Data. Front Neuroinform. 2009; 3: 3.
PubMed Abstract |Publisher Full Text |Free Full Text
12. Varoquaux G, Raamana PR, Engemann DA, et al.: Assessing and tuning brain decoders: Cross-validation, caveats, and guidelines. Neuroimage. 2017;
145(Pt B): 166–179.
PubMed Abstract |Publisher Full Text
13. Swisher JD, Gatenby JC, Gore JC, et al.: Multiscale pattern analysis of orientation-selective activity in the primary visual cortex. J Neurosci. 2010; 30(1): 325–30.
PubMed Abstract |Publisher Full Text |Free Full Text
14. Pedregosa F, Varoquaux G, Gramfort A, et al.: Scikit-learn: Machine learning in Python. J Mach Learn Res. 2011; 12: 2825–2830.
Reference Source
15. Edwards AL: Note on the correction for continuity in testing the significance of the difference between correlated proportions. Psychometrika. 1948; 13(3): 185–187.
PubMed Abstract |Publisher Full Text
16. Gardumi A, Ivanov D, Hausfeld L, et al.: The effect of spatial resolution on decoding accuracy in fmri multivariate pattern analysis. Neuroimage. 2016; 132: 32–42.
PubMed Abstract |Publisher Full Text
17. Freeman J, Brouwer GJ, Heeger DJ, et al.: Orientation decoding depends on maps, not columns. J Neurosci. 2011; 31(13): 4792–804.
PubMed Abstract |Publisher Full Text |Free Full Text
18. Alink A, Krugliak A, Walther A, et al.: fMRI orientation decoding in V1 does not require global maps or globally coherent orientation stimuli. Front Psychol. 2013; 4: 493.
PubMed Abstract |Publisher Full Text |Free Full Text
19. Freeman J, Heeger DJ, Merriam EP: Coarse-scale biases for spirals and orientation in human visual cortex. J Neurosci. 2013; 33(50): 19695–703.
PubMed Abstract |Publisher Full Text |Free Full Text
20. Linden JF, Schreiner CE: Columnar transformations in auditory cortex? A comparison to visual and somatosensory cortices. Cereb Cortex. 2003; 13(1): 83–89.
PubMed Abstract |Publisher Full Text
21. Hanke M: paper-f1000_pandora_data: Initial submission (Version submit_v1).
Zenodo. 2015. Data Source
22. Hanke M, v-iacovella, Häusler C: gumpdata: Matching release for pandora data paper publication (Version pandora_release1). Zenodo. 2015.
Data Source
23. Sengupta A: psychoinformatics-de/studyforrest-paper-auditorydecoding: v1.0 (Version v1.0). Zenodo. 2018.
Open Peer Review
Current Referee Status:
Version 2
04 April 2018 Referee Report
doi:
10.5256/f1000research.15721.r32703
Cyril R. Pernet
Neuroimaging Sciences, Centre for Clinical Brain Sciences, The University of Edinburgh, Edinburgh, UK
As expected, one cannot really address the issue of LOO with 7-8 betas but it's now mentioned and that's
all I really wanted to see.
No competing interests were disclosed.
Competing Interests:
I have read this submission. I believe that I have an appropriate level of expertise to confirm that
it is of an acceptable scientific standard.
Version 1
09 March 2018 Referee Report
doi:
10.5256/f1000research.14869.r30542
David G. Norris
Donders Institute for Brain, Cognition and Behaviour, Radboud University Nijmegen, Nijmegen,
Netherlands
This article explores the effect of spatial filtering on the decoding accuracy of BOLD fMRI data. The
authors conclude that a spatial bandpass filter corresponding to a difference of Gaussians of 6mm
improves the decoding accuracy.
Abstract: 'Reported evidence' is clumsy phrasing how about something like 'previous research'. Use of
'matches' is also ambivalent: do you mean the analysis was similar or the results? Please state the main
result and not just that it is similar to that obtained for V1.
Introduction: The term spatial frequency is used frequently, whereas the difference of Gaussians is
described in terms of a FWHM. The units of spatial frequency are 1/mm, so if you are describing band
pass filters, cut-offs etc in terms of spatial frequency then please convert to the correct units.
Figure 1 caption: gaussian->Gaussian.
fMRI data analysis: prior masking -> prior to masking
Results and Conclusions: These are given with little discussion. Why do you think the decoding accuracy
is so much higher for music than for V1. Some discussion of existing literature would also be welcome,
also of papers which do not reach the same conclusion as the authors (ref 1).
References
1. Gardumi A., Ivanov D., Hausfeld L., Valente G., Formisano E., Uludağ K.: The effect of spatial
resolution on decoding accuracy in fMRI multivariate pattern analysis.
Neuroimage
. 2016. 32-42
Publisher
Full Text
Is the work clearly and accurately presented and does it cite the current literature?
Partly
Is the study design appropriate and is the work technically sound?
Yes
Are sufficient details of methods and analysis provided to allow replication by others?
Partly
If applicable, is the statistical analysis and its interpretation appropriate?
Yes
Are all the source data underlying the results available to ensure full reproducibility?
Yes
Are the conclusions drawn adequately supported by the results?
Yes
No competing interests were disclosed.
Competing Interests:
I have read this submission. I believe that I have an appropriate level of expertise to confirm that
it is of an acceptable scientific standard.
Author Response 28 Mar 2018
, Sir Peter Mansfield Imaging Centre, University of Nottingham, UK
Ayan Sengupta
This article explores the effect of spatial filtering on the decoding accuracy of BOLD fMRI data. The authors conclude that a spatial bandpass filter corresponding to a difference of Gaussians of 6mm improves the decoding accuracy.
Abstract: 'Reported evidence' is clumsy phrasing how about something like 'previous research'. Use of 'matches' is also ambivalent: do you mean the analysis was similar or the results? Please state the main result and not just that it is similar to that obtained for V1.
The required phrases have been changed accordingly.
The unit of spatial frequency (FWHM) is kept unaltered in order to maintain parity with other previous publications. But a conversion of units to (cycles/mm) and the implementation of DoG filter is explained in Supplementary Figure 5 of
. It is now explicitly referred to in the manuscript.
Sengupta et al. 2017
Stimulus and fMRI data: Please give slice orientation of fMRI acquisition. I believe it was axial, but Figure 1 could mislead people into thinking it was coronal.
The words ‘axial slices’ are now mentioned in the description of the acquisition protocol.
Figure 1 caption: gaussian->Gaussian.
The change is incorporated into the manuscript.
fMRI data analysis: prior masking -> prior to masking
This change is done.
Results and Conclusions: These are given with little discussion. Why do you think the decoding accuracy is so much higher for music than for V1. Some discussion of existing literature would also be welcome, also of papers which do not reach the same conclusion as the authors (ref 1).
We thank the reviewer for pointing this point in the manuscript. These points are now discussed in the results and conclusion section.
No competing interests were disclosed.
Competing Interests:
08 February 2018 Referee Report
doi:
10.5256/f1000research.14869.r30541
Cyril R. Pernet
Neuroimaging Sciences, Centre for Clinical Brain Sciences, The University of Edinburgh, Edinburgh, UK
This is a good note, replicating previous results from vision to audition - and therefore showing that
band-pass is an effective strategy, not specific to visual columns.
Method:
You set a GLM to get beta estimates per genre for each run, and use this (z-scored) for decoding.
You mention that you included temporal derivatives, were these ones used in any form? (note you
can also correct the hrf amplitude estimates using the temporal derivative
https://www.ncbi.nlm.nih.gov/pmc/articles/PMC3896880/)
Is the work clearly and accurately presented and does it cite the current literature?
Yes
Is the study design appropriate and is the work technically sound?
Yes
Are sufficient details of methods and analysis provided to allow replication by others?
Partly
If applicable, is the statistical analysis and its interpretation appropriate?
Partly
Are all the source data underlying the results available to ensure full reproducibility?
Yes
Are the conclusions drawn adequately supported by the results?
Yes
No competing interests were disclosed.
Competing Interests:
I have read this submission. I believe that I have an appropriate level of expertise to confirm that
it is of an acceptable scientific standard, however I have significant reservations, as outlined
above.
Author Response 28 Mar 2018