Does expression choice affect the analysis of light
spectrum and facial emotion recognition?
FOTIOS, S., CASTLETON, H. <http://orcid.org/0000-0001-6633-8205> and
YANG, B.
Available from Sheffield Hallam University Research Archive (SHURA) at:
http://shura.shu.ac.uk/12576/
This document is the author deposited version. You are advised to consult the
publisher's version if you wish to cite from it.
Published version
FOTIOS, S., CASTLETON, H. and YANG, B. (2018). Does expression choice affect
the analysis of light spectrum and facial emotion recognition? Lighting Research and
Technology, 50 (2), 294-302.
Copyright and re-use policy
See http://shura.shu.ac.uk/information.html
Does expression choice affect the
analysis of light spectrum and
facial emotion recognition?
S FotiosPhDa,H CastletonPhDbandB YangPhDc a
School of Architecture, University of Sheffield, Sheffield, UK b
Department of Engineering and Mathematics, Sheffield Hallam University, Sheffield, UK
cSchool of Urban Planning and Management, Harbin Institute of Technology Shenzhen Graduate School, Shenzhen, Guangdong, China
Received 12 April 2016; Revised 3 May 2016; Accepted 5 May 2016
Facial emotion recognition has been used as a representative pedestrian activity in studies examining the effect of changes in road lighting. Past studies have drawn conclusions using results averaged across performance with the six universally recognised expressions. This paper asks whether expression choice matters. A reanalysis of past data for each unique expression does not suggest a change in the conclusion that facial emotion recognition is not significantly affected by the spectral power distribution of the lighting.
1. Introduction
Making a judgement about the intentions of other people is an assumed critical visual task for pedestrians.1–3 There is support for this assumption in studies using eye tracking. When looking at static images, observers will tend to look at the people in a scene with a frequency significantly greater than chance.4In natural outdoor settings, there is a probability of over 80% that another person in the field of view will be fixated at least once5,6and fixations on other people can be sufficiently important to demand significant cognitive attention.7 The assumed reason for observing others is that a pedestrian ‘need[s]
to be able to take a ‘‘good look’’ at the other
users of streets – identification of persons or of intentions...’,
2
that is whether they are friendly, aggressive or indifferent8 and thus whether it is safe to approach them or if avoiding action is required. After dark, on roads where significant pedestrian activity is expected, road lighting should be designed to enhance the performance of such interper-sonal judgements.
Facial emotion recognition is the identifi-cation of a person’s emotional state from their facial expression. Facial emotions have been linked with the approach–avoid response9and thus three experiments have been carried out to investigate how this task is affected by changes in road lighting.10–12 These studies used photographs from the FACES database of actors portraying the six universally recog-nised facial expressions of emotion: anger, disgust, fear, happiness, neutrality and sad-ness.13,14 A photograph was presented for a brief (0.5 or 1.0 s) observation and a six-alternative forced choice of expression was sought. These studies used the faces of four
Address for correspondence: Steve Fotios, School of Architecture, The University of Sheffield, Arts Tower, Western Bank, Sheffield, S10 2TN, UK.
E-mail: [email protected]
Biao Yang, School of Urban Planning and Management, Harbin Institute of Technology Shenzhen Graduate School, Shenzhen 518055, Guangdong, China
actors (a young male, a young female, an old male and an old female) each portraying all six expressions giving 24 target images in total. An example of the target images is shown in Figure 1. The targets were observed under lighting of different spectral power distribu-tion (SPD), luminance and viewing distance as simulated by manipulation of image size (Table 1). In two studies,10,12the photographs were presented on a non-self-luminous screen with the surrounding environment being lit by the test lighting. In the third study,11 the photographs were projected onto a screen, with the projector light and surrounding field providing similar SPD and luminance.
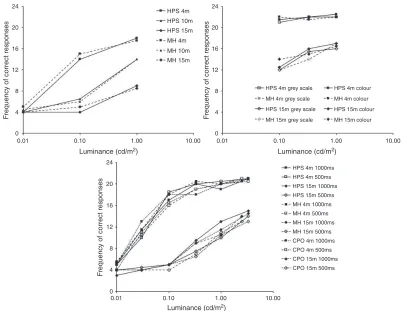
The results from the three experiments are shown in Figure 2. Analyses of these data confirmed that luminance and distance were significant factors in correct recognition fre-quency. At low luminance (0.01 cd/m2) per-formance is at chance level, increasing towards a plateau of maximum performance with higher luminance. Closer (i.e. larger) targets were correctly identified with a significantly higher
frequency than targets further away (i.e. smaller). In neither study, however, was SPD suggested to be a significant effect. In Figure 2, different SPDs (i.e. lamp types) are given different line types, and these graphs do not indicate any significant or consistent trends. These conclusions were drawn from consid-eration of expression recognition performance averaged across all six expressions. The peer reviewer of one study10 commented that some facial expressions may be easier to detect than others and therefore that the analysis of lighting effects should be repeated but for individual expressions. It may also be the case that recognition of some expressions is more important than others for a pedestrian’s reassurance, or more difficult to discriminate, and hence that particular expressions are differently affected by changes in lighting. This paper therefore presents a further analysis of the results of the facial emotion recognition experiments of Yang and Fotios10and Fotios
[image:3.536.101.439.385.458.2]et al.11with emotion recognition evaluated for individual expressions.
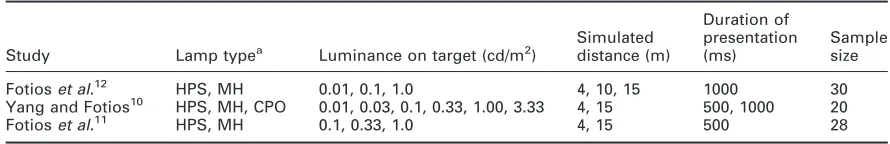
Table 1 Experimental conditions used in past studies of facial emotion recognition.
Study Lamp typea Luminance on target (cd/m2) Simulateddistance (m)
Duration of presentation (ms)
Sample size
Fotioset al.12 HPS, MH 0.01, 0.1, 1.0 4, 10, 15 1000 30
Yang and Fotios10 HPS, MH, CPO 0.01, 0.03, 0.1, 0.33, 1.00, 3.33 4, 15 500, 1000 20
Fotioset al.11 HPS, MH 0.1, 0.33, 1.0 4, 15 500 28
Note:Fotioset al.11also varied target colour (black and white or coloured photographs).
aLamp types: HPS: High pressure sodium, (2000 K, S/P
¼0.57, Ra¼25), MH: Metal halide (4200 K, S/P¼1.77, Ra¼92),
CPO: Metal halide (2868 K, S/P¼1.22, Ra¼70).
Figure 1. Sample of facial expressions from the FACES database.13These are a younger female with expressions
(from left to right) of angry, disgust, fear, happy, neutral and sadness. Website for image database: http:// faces.mpdl.mpg.de/faces/.
2 S Fotios et al.
[image:3.536.45.490.525.597.2]2. Choice of facial expression
In the past studies,10–12 all six universally recognised facial expressions were used as targets, and the data used to analyse the effect of changes in lighting was the frequency of correct response averaged across all six expressions. Some expressions may, however, be more difficult to discriminate than others because they are more ambiguous or more complex.15 Expression portrayal in the FACES database, evaluated under good lighting conditions with unlimited exposure durations, demonstrated that different expres-sions have different recognition rates. The happy and neutral expressions were correctly
identified most frequently and the sad and disgust expressions were correctly identified least frequently (Table 2).
Of these six facial expressions, four might be considered negative emotions (angry, dis-gust, fear and sad)16 one to be a positive emotion (happy), and one to be ambivalent (neutral). This negativity is recognised by observers; Willis et al.17 found that happy faces were judged more positively than all other emotions, while neutral faces were judged more favourably than faces displaying negative emotions. Angry and disgusted faces were given the most negative ratings, signifi-cantly more so than sad and fearful faces. It might therefore be pertinent to ask whether it
24
20
16
12
8
F
requency of correct responses 4
0
24
20
16
12
8
F
requency of correct responses 4
0
24
20
16
12
8
F
requency of correct responses 4
0
0.01 0.10 1.00 10.00
HPS 4m
HPS 4m grey scale
MH 4m grey scale
HPS 15m grey scale
MH 15m grey scale
HPS 4m colour
MH 4m colour
HPS 15m colour
MH 15m colour HPS 10m
HPS 4m 1000ms HPS 4m 500ms
MH 4m 1000ms MH 4m 500ms MH 15m 1000ms MH 15m 500ms CPO 4m 1000ms CPO 4m 500ms CPO 15m 1000ms CPO 15m 500ms HPS 15m 1000ms HPS 15m 500ms HPS 15m
MH 4m MH 10m MH 15m
Luminance (cd/m2)
0.01 0.10 1.00 10.00
Luminance (cd/m2)
0.01 0.10 1.00 10.00
[image:4.536.67.469.70.381.2]Luminance (cd/m2)
Figure 2. Frequency of correct recognition of facial emotion plotted against luminance. These are the data from
is appropriate in investigations of road light-ing to use all six expressions, or whether it might be interesting to pick the most salient expressions for interpersonal evaluations (which is not yet known) or to balance the number of positive and negative emotions presented during trials.
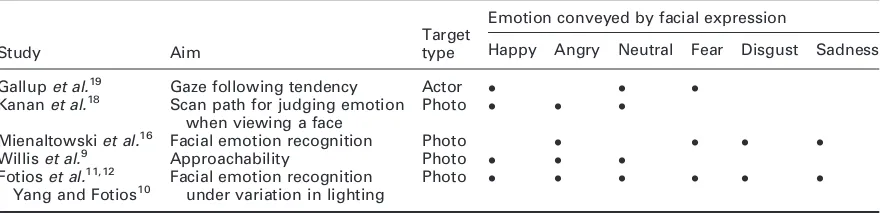
Some past studies investigating the influ-ence of facial expression have used a sub-set of the six expressions rather than all six (Table 3). These studies have examined how we look at others,18 how we evaluate others9,16 and how we take cues from others.19 What these indicate is that there is no apparent consensus as to the right expres-sion(s) to use.
3. Analysis with individual expressions
For this paper, the data from two studies of facial emotion recognition were re-analysed.10,11 In the original analyses, a participants’ prob-ability of correctly identifying the target expression was determined as a proportion of the sample of 24 expressions observed (4 actors, 6 expressions) under each combin-ation of luminance, lamp type, target colour and simulated distance. For the current ana-lyses, conclusions regarding the effect of SPD were drawn from separate analyses of the six expressions.
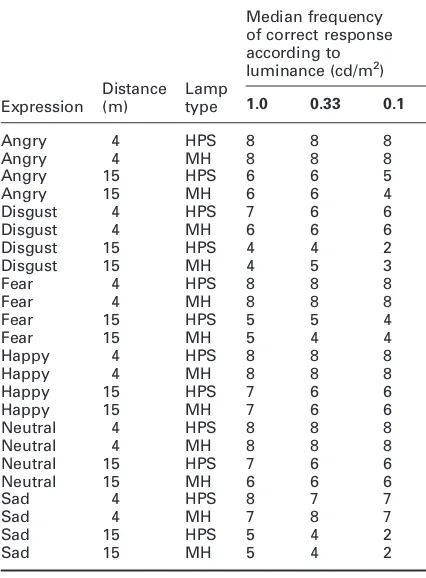
Tables 4 and 5 show the expression discrim-ination results for each expression, and for each combination of distance, luminance and lamp type. These data are the median number of correct emotion recognition responses, sum-mated for each test participant across the four actors portraying that emotion and the two levels of either duration10 or target colour.11 The maximum possible number of correct responses was therefore eight in both studies.
[image:5.536.47.263.323.419.2]Figures 3 and 4 show these data further summated across lamp type to show separ-ately the expression recognition rate for each expression. The maximum number of correct responses in these data are therefore 24 for Yang and Fotios10who used three lamps and 16 for Fotios et al.11 who used two types of lamp. It can be seen that trials with different expressions led to different frequencies of
Table 3. Facial expressions used in past studies
Study Aim
Target type
Emotion conveyed by facial expression
Happy Angry Neutral Fear Disgust Sadness
Gallupet al.19 Gaze following tendency Actor
Kananet al.18 Scan path for judging emotion
when viewing a face
Photo
Mienaltowskiet al.16 Facial emotion recognition Photo
Williset al.9 Approachability Photo
Fotioset al.11,12
Yang and Fotios10 Facial emotion recognitionunder variation in lighting Photo
Note:Gallupet al.19also included a ‘suspicion’ expression.
Table 2. Proportion of correct identification of unique
facial expressions as reported by Ebneret al.13and Yang
and Fotios10
Expression Proportion of correct identification
Ebneret al.13 Yang and Fotios10
Happy 0.96 0.95
Neutral 0.87 0.93
Angry 0.81 0.80
Fear 0.81 0.79
Sad 0.73 0.81
Disgust 0.68 0.77
Note: For Yang and Fotios these are data determined
under their best visual conditions (i.e. 3.33 cd/m2,
4 m simulated distance). The expressions are listed in descending order as defined by the results of
Ebneret al.
4 S Fotios et al.
[image:5.536.49.489.503.610.2]correct responses. The happy and neutral expressions tended to be identified more frequently than were the other expressions across all luminances, consistent with Table 2. These data were not drawn from a normally distributed population and hence analyses of differences were done using non-parametric statistical tests for repeated meas-ures, the Wilcoxon test (two samples) and the Friedman test (k samples). While repeated application of such tests raises the risk of
falsely indicating a significant effect (a type I error), adjusting the thresholdp-value to com-pensate raises the risk of failing to identify a significant effect (a type II error): Rothman20 recommends that we do not make adjustment for multiple comparisons. Following the exam-ple of previous work,21we retained the stand-ard threshold ofp50.05 and planned to draw
[image:6.536.52.489.80.453.2]conclusions by consideration of the overall pattern of results rather than by placing emphasis on any one result.
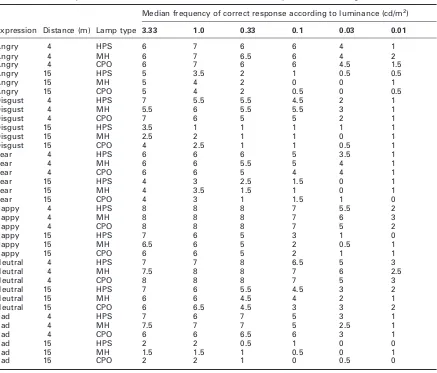
Table 4. Median frequencies of correct emotion discrimination for each expression, after Yang and Fotios10
Median frequency of correct response according to luminance (cd/m2)
Expression Distance (m) Lamp type 3.33 1.0 0.33 0.1 0.03 0.01
Angry 4 HPS 6 7 6 6 4 1
Angry 4 MH 6 7 6.5 6 4 2
Angry 4 CPO 6 7 6 6 4.5 1.5
Angry 15 HPS 5 3.5 2 1 0.5 0.5
Angry 15 MH 5 4 2 0 0 1
Angry 15 CPO 5 4 2 0.5 0 0.5
Disgust 4 HPS 7 5.5 5.5 4.5 2 1
Disgust 4 MH 5.5 6 5.5 5.5 3 1
Disgust 4 CPO 7 6 5 5 2 1
Disgust 15 HPS 3.5 1 1 1 1 1
Disgust 15 MH 2.5 2 1 1 0 1
Disgust 15 CPO 4 2.5 1 1 0.5 1
Fear 4 HPS 6 6 6 5 3.5 1
Fear 4 MH 6 6 5.5 5 4 1
Fear 4 CPO 6 6 5 4 4 1
Fear 15 HPS 4 3 2.5 1.5 0 1
Fear 15 MH 4 3.5 1.5 1 0 1
Fear 15 CPO 4 3 1 1.5 1 0
Happy 4 HPS 8 8 8 7 5.5 2
Happy 4 MH 8 8 8 7 6 3
Happy 4 CPO 8 8 8 7 5 2
Happy 15 HPS 7 6 5 3 1 0
Happy 15 MH 6.5 6 5 2 0.5 1
Happy 15 CPO 6 6 5 2 1 1
Neutral 4 HPS 7 7 8 6.5 5 3
Neutral 4 MH 7.5 8 8 7 6 2.5
Neutral 4 CPO 8 8 8 7 5 3
Neutral 15 HPS 7 6 5.5 4.5 3 2
Neutral 15 MH 6 6 4.5 4 2 1
Neutral 15 CPO 6 6.5 4.5 3 3 2
Sad 4 HPS 7 6 7 5 3 1
Sad 4 MH 7.5 7 7 5 2.5 1
Sad 4 CPO 6 6 6.5 6 3 1
Sad 15 HPS 2 2 0.5 1 0 0
Sad 15 MH 1.5 1.5 1 0.5 0 1
Sad 15 CPO 2 2 1 0 0.5 0
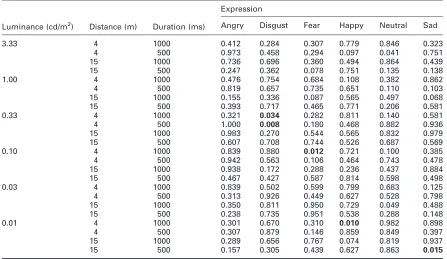
In past studies10–12 the effect of SPD on facial emotion recognition was not suggested to be significant. The focus of the current paper is to examine whether that conclusion holds when the effect of SPD is examined using the results of each expression separately rather than using the collated results of all six expressions. Tables 6 and 7 show the results of significance testing for the two studies. In the Yang and Fotios10 data, the Friedman test suggested a significant difference between the three types of lamp used (p50.05) in only
5 of the 144 cases (6 expressions24 com-binations of luminance, duration and dis-tance). In the Fotios et al.11 data, the Wilcoxon test suggested a significant differ-ence (p50.05) between the two types of lamp
used in only 5 of the 72 cases. There is no apparent trend in the distribution of these few significant cases. These data thus confirm the conclusion drawn following analysis across all expressions, that SPD did not have significant effect on expression discrimination.
According to Table 2, a happy expression tends to receive the highest probability of correct identification and disgust the least probability, suggesting disgust to be the more difficult expression to recognise. With tasks of greater difficulty, it appears that SPD is more likely to have an effect22and thus the disgust expression is more likely to suggest significant effects of SPD. In Tables 6 and 7, the disgust expression has the most cases where a signifi-cant effect of SPD is indicated (5/36), while the happy expression has only two such cases. This suggests that the higher difficulty
Table 5. Median frequencies of correct emotion
discrimination for each expression, after Fotioset al.11
Expression Distance (m) Lamp type Median frequency of correct response according to
luminance (cd/m2)
1.0 0.33 0.1
Angry 4 HPS 8 8 8
Angry 4 MH 8 8 8
Angry 15 HPS 6 6 5
Angry 15 MH 6 6 4
Disgust 4 HPS 7 6 6
Disgust 4 MH 6 6 6
Disgust 15 HPS 4 4 2
Disgust 15 MH 4 5 3
Fear 4 HPS 8 8 8
Fear 4 MH 8 8 8
Fear 15 HPS 5 5 4
Fear 15 MH 5 4 4
Happy 4 HPS 8 8 8
Happy 4 MH 8 8 8
Happy 15 HPS 7 6 6
Happy 15 MH 7 6 6
Neutral 4 HPS 8 8 8
Neutral 4 MH 8 8 8
Neutral 15 HPS 7 6 6
Neutral 15 MH 6 6 6
Sad 4 HPS 8 7 7
Sad 4 MH 7 8 7
Sad 15 HPS 5 4 2
Sad 15 MH 5 4 2
Note:For each test participant the results are summated for both target colours, and hence from the four target actors the maximum possible score was 8.
24 20 16 12 Angry, 4m Disgust, 4m Fear, 4m Happy, 4m Neutral, 4m Sad, 4m Angry, 15m Disgust, 15m Fear, 15m Happy, 15m Neutral, 15m Sad, 15m F
requency of correct responses
8 4 0 24 20 16 12 F
requency of correct responses
8
4
0
0.01 0.10 1.00 10.00 Luminance (cd/m2)
Luminance (cd/m2)
[image:7.536.47.260.94.383.2]0.01 0.10 1.00 10.00
Figure 3. Median frequencies for correct identification of emotion from facial expression for the six expressions at the two test distances (as identified in the legend) after
Yang and Fotios10
6 S Fotios et al.
Table 6. p-Values determined using the Friedman test to compare facial expression discrimination performance under three lamps
Luminance (cd/m2) Distance (m) Duration (ms)
Expression
Angry Disgust Fear Happy Neutral Sad
3.33 4 1000 0.412 0.284 0.307 0.779 0.846 0.323
4 500 0.973 0.458 0.294 0.097 0.041 0.751
15 1000 0.736 0.696 0.360 0.494 0.864 0.439
15 500 0.247 0.362 0.078 0.751 0.135 0.138
1.00 4 1000 0.476 0.754 0.684 0.108 0.382 0.862
4 500 0.819 0.657 0.735 0.651 0.110 0.103
15 1000 0.155 0.336 0.087 0.565 0.497 0.068
15 500 0.393 0.717 0.465 0.771 0.206 0.581
0.33 4 1000 0.321 0.034 0.282 0.811 0.140 0.581
4 500 1.000 0.008 0.180 0.468 0.882 0.936
15 1000 0.983 0.270 0.544 0.565 0.832 0.979
15 500 0.607 0.708 0.744 0.526 0.687 0.569
0.10 4 1000 0.839 0.880 0.012 0.721 0.100 0.385
4 500 0.942 0.563 0.106 0.464 0.743 0.478
15 1000 0.938 0.172 0.288 0.236 0.437 0.884
15 500 0.467 0.427 0.587 0.814 0.598 0.498
0.03 4 1000 0.839 0.502 0.599 0.799 0.683 0.125
4 500 0.313 0.926 0.449 0.627 0.528 0.798
15 1000 0.350 0.811 0.950 0.729 0.049 0.488
15 500 0.238 0.735 0.951 0.538 0.288 0.148
0.01 4 1000 0.301 0.670 0.310 0.010 0.982 0.898
4 500 0.307 0.879 0.146 0.859 0.849 0.397
15 1000 0.289 0.656 0.767 0.074 0.819 0.937
15 500 0.157 0.305 0.439 0.627 0.863 0.015
Note:This is apost hocanalysis of the data from Yang and Fotios.10Values in bold are those wherep50.05.
Table 7. p-Values determined using the Wilcoxon test to compare facial expression discrimination performance under two lamps
Luminance (cd/m2) Distance (m)
Expression
Angry Disgust Fear Happy Neutral Sad
Grey scale targets
1.0 4 0.317 0.458 1.000 0.414 0.705 0.317
0.33 4 0.088 0.485 1.000 0.655 0.48 0.365
0.1 4 0.205 0.034 0.642 0.059 0.782 0.499
1.0 15 0.302 0.706 0.785 0.09 0.361 0.496
0.33 15 0.194 0.861 0.414 0.195 0.018 0.831
0.1 15 0.941 0.008 0.185 0.405 0.705 0.605
Coloured targets
1.0 4 0.394 0.302 0.705 0.157 0.705 0.251
0.33 4 0.804 0.728 0.527 0.739 0.527 0.403
0.1 4 0.449 0.811 0.266 0.157 0.417 0.225
1.0 15 0.549 0.231 0.128 1.000 0.320 0.209
0.33 15 0.456 0.024 0.806 0.416 0.398 0.415
0.1 15 0.617 0.202 0.559 0.177 0.756 0.672
[image:8.536.49.490.428.605.2]involved in recognising the disgust expression did lead to higher likelihood of indicating an effect of SPD, but this is not, however, significant nor consistent trend in these data. The effects of further independent variables were also examined within the individual expressions. Fotios et al.11 also considered the target colour, using coloured and grey scale versions of the target photographs. Analysis of these data using the Wilcoxon test suggested a significant effect in only 9/72 cases. Effects of luminance and distance were also re-analysed. In these tests luminances ranged from 0.01 cd/m2 to 3.33 cd/m2 (Yang and Fotios10) and 0.10 cd/m2 to 1.0 cd/m2 (Fotios et al.11). It was confirmed that there is a significant effect of luminance for targets seen at 15 m, suggested to be the critical distance,23 with higher luminances enabling a
greater probability of correct identification. This effect of luminance is less prevalent with the targets simulating a distance of 4 m. It was confirmed that there is a significant effect of distance, with a greater probability of correctly identifying expression at 4 m than at 15 m.
4. Conclusion
Previous studies suggested that facial emotion recognition is significantly affected by lumi-nance and observation distance but not by lamp spectrum. These conclusions were firmed in the current analysis which con-sidered each expression in isolation rather than considering the combined results of all six expressions. This conclusion therefore does not suggest the decision to employ the full range of facial expressions rather than a specific selection in previous work10–12 was erroneous.
Declaration of conflicting interests
The author(s) declared no potential conflicts of interest with respect to the research, author-ship, and/or publication of this article.
Funding
The author(s) disclosed receipt of the follow-ing financial support for the research, author-ship, and/or publication of this article: This work was supported by the Engineering and Physical Sciences Research Council (EPSRC) grant numbers EP/H050817 and EP/ M02900X/1.
Acknowledgement
Images used in the original trials were taken, with permission, from the FACES database developed by the Max Planck Institute for Human Development.
16
12
8
F
requency of correct responses
4
0
16
12
8
F
requency of correct responses
4
0
0.01 0.10 1.00
Angry, 4m Disgust, 4m Fear, 4m Happy, 4m Neutral, 4m Sad, 4m
Angry, 15m Disgust, 15m
Fear, 15m
Happy, 15m Neutral, 15m
Sad, 15m 10.00 Luminance (cd/m2)
[image:9.536.63.246.65.342.2]0.01 0.10 1.00 10.00 Luminance (cd/m2)
Figure 4. Median frequencies for correct identification of emotion from facial expression for the six expressions at the two test distances (as identified in the legend) after
Fotioset al.11
8 S Fotios et al.
References
1 British Standards Institution BS 5489-1:2013.
Code of Practice for the Design of Road Lighting Part 1: Lighting of Roads and Public Amenity Areas. London: BSI, 2012.
2 Caminada JF, Van Bommel WJM. New lighting criteria for residential areas.Journal of the Illuminating Engineering Society 1984; 13: 350–358.
3 Simons RH, Hargroves RA, Pollard NE, Simpson MD. Lighting criteria for residential roads and areas: Proceedings of the CIE, Venice, 1987: pp. 274–277.
4 Fletcher-Watson S, Findlay JM, Leekam SR, Benson V. Rapid detection of person infor-mation in a naturalistic scene.Perception2008; 37: 571–583.
5 Foulsham T, Walker E, Kingstone A. The where, what and when of gaze allocation in the lab and the natural environment. Vision Research2011; 51: 1920–1931.
6 Fotios S, Uttley J, Yang B. Using eye-tracking to identify pedestrians’ critical visual tasks. Part 2. Fixation on pedestrians. Lighting Research and Technology 2015; 47: 149–160. 7 Fotios S, Uttley J, Cheal C, Hara N. Using
eye-tracking to identify pedestrians’ critical visual tasks. Part 1. Dual task approach.
Lighting Research and Technology2015; 47: 133–148.
8 British Standards Institution. BS 5489-3: 1992.
Road Lighting – Part 3: Code of Practice for Lighting for Subsidiary Roads and Associated Pedestrian Areas. London: BSI, 1992. 9 Willis ML, Palermo R, Burke D. Judging
approachability on the face of it: the influence of face and body expressions on the perception of approachability.Emotion2011; 11: 514–523. 10 Yang B, Fotios S. Lighting and recognition of
emotion conveyed by facial expressions.
Lighting Research and Technology2015; 47: 964–975.
11 Fotios S, Castleton H, Cheal C, Yang B. Investigating the chromatic contribution to recognition of facial expression through lamp spectrum and target colour.Lighting Research and Technology First published 24 November 2015. doi:10.1177/
1477153515616166.
12 Fotios S, Yang B, Cheal C. Effects of outdoor lighting on judgements of emotion and gaze direction.Lighting Research and Technology
2015; 47: 301–315.
13 Ebner N, Riediger M, Lindenberger U. FACES – a database of facial expressions in young, middle-aged, and older women and men: development and validation.
Behavior Research Methods2010; 42: 351–362.
14 Etcoff N, Magee J. Categorical perception of facial expressions.Cognition1992; 44: 227–240.
15 Adolphs R. Recognizing emotion from facial expressions: Psychological and neuro-logical mechanisms.Behavioral and Cognitive Neuroscience Reviews2002; 1: 21–62.
16 Mienaltowski A, Johnson ER, Wittman R, Wilson A-T, Sturycz C, Norman JF. The visual discrimination of facial expressions by younger and older adults.Vision Research
2013; 81: 12–17.
17 Willis ML, Palermo R, Burke D. Social judgements are influenced by both facial expression and direction of eye gaze.Social Cognition2011; 29: 415–429.
18 Kanan C, Bseiso DNF, Ray NA, Hsiao JH, Cottrell GW. Humans have idiosyncratic and task-specific scanpaths for judging faces.
Vision Research2015; 108: 67–76.
19 Gallup AC, Chong A, Kacelnik A, Krebs JR, Couzin ID. The influence of emotional facial expressions on gaze-following in grouped and solitary pedestrians.Scientific Reports2014; 4: 5794.
20 Rothman KJ. No adjustments are needed for multiple comparisons.Epidemiology1990; 1: 43–46.
21 Boyce PR, Cuttle C. Effect of correlated colour temperature on the perception of interiors and colour discrimination.Lighting Research and Technology1990; 22: 19–36.
22 Lin Y, Fotios S. Investigating methods for measuring facial recognition under different road lighting conditions.Lighting Research and Technology2015; 47: 221–235.