© 2019, IRJET | Impact Factor value: 7.211 | ISO 9001:2008 Certified Journal
| Page 4456
PARAMETRIC OPTIMIZATION OF CO
2WELDING ON FE410 USING
TAGUCHI TECHNIQUE
Bhushan P Jain
1, Darshan V Sanghavi
2, Rayappa S Mahale
31,2
UG Student, Dept of Mechanical Engineering, D Y Patil Techanical Campus, Ambi.
3
Assistant Professor, Dept of Mechanical Engineering, D Y Patil Technical Campus, Ambi.
---***---Abstract –
As we know that the use of stainless steel indifferent sectors and sections in industries are high due to their properties such as higher tensile strength and hardness along with toughness. Therefore the time has arrived to think about stainless steel with which it is compatible and stronger. In this paper we have studied the mechanical properties of the joint of martensitic stainless steel (AISI 410) by using CO2 welding. We have used Taguchi’s method of optimization to optimize the various process parameters such as Current, Voltage, and Gas Flow Rate (GFR) which has influence on tensile strength and hardness of the joint. However, investigation is based on the Taguchi’s approach of orthogonal array using analysis of variance (ANOVA) to determine influence of process parameters and to optimize them.
Key Words: Martensitic Stainless Steel (FE410), CO2
Welding, Taguchi Orthogonal Array, Tensile Strength, Hardness
1 INTRODUCTION:
In the age of rising industrialization welding process is one of the most important methods in the field of manufacturing industries. Among the various welding processes CO2 welding plays a major role in the welding of stainless steel. CO2 welding is also mostly used in industries for better strength of weld. Kumar Rahul Anand (4) who carried out experiment on parametric optimization of Co2 welding which is done on stainless steel the process parameter where current, voltage and gas flow rate (GFR) statistically techniques analysis of variance (ANOVA) signal to noise ratio and graphically main effect plot have been used to study the effect of welding parameters on which ultimate load of weld specimen optimum parametric condition obtained by the Taguchi method.
It is there resistance to hot gases steam as this have the high tensile strength and hardness and toughness accept therefore need is to be arrived to think out in the field of the stainless steel with the other metal which are compatible stronger stainless steel till so this paper we have studied the mechanical properties of joint of the martensitic stainless steel (AISI 410) and building up stainless steel of grade AISI 410 with CO2 welding.
2.
METHODOLOGY:
a) Selection of base material (AISI410).
b) Process Parameter selection (Welding current, Arc Voltage, & Gas Flow Rate). c) Sample preparation (Cutting, Welding,
Finishing, etc.).
d)
Specimen for Tensile Test and Hardness Test.
3. TAGUCHI METHOD:
Genichi Taguchi a Japanese Scientist developed a technique called Orthogonal Array which is mostly used in the manufacturing industries. The aim of this technique is to provide a high quality product at very low cost. Taguchi have orthogonal array through which the mean and variance of the process parameter get affected when different parameters is applied. However he provided equal weighted to each factor by this, Taguchi showed that the variability is caused by individual factor and that can be controlled individually. Regardless of the environment in which it is used this process is designed with the aim to produce consistent output.
4 SIGNAL TO NOISE (S/N) RATIO:
Taguchi method stresses the importance of studying the response variation using the signal-to-noise (S/N) ratio are,
1 .Larger the better
:
2 .Smaller the better
:
3 .Nominal is best
:
© 2019, IRJET | Impact Factor value: 7.211 | ISO 9001:2008 Certified Journal
| Page 4457
Value of ith run, ȳ= mean of measured value, s = standard deviation.
[image:2.595.306.565.137.376.2] [image:2.595.59.265.239.512.2]ANOVA (Analysis Of Variance), The total sum of squared deviations SST from the total mean S/N ratio nm can be calculated as, SST = Σ (ni - nm)2 where, ni = S/N ratio of ith run or experiment. nm = total mean of S/N ratio. In this paper 3x3 parameter level are selected, So L9 orthogonal array has been selected. The arrays are given below in table 1.
Table-1. L9 Orthogonal Array:
NO.OF RUNS
CONTROL
FACTORS
A B C
1 L1 L1 L1
2 L1 L2 L2
3 L1 L3 L3
4 L2 L1 L2
5 L2 L2 L3
6 L2 L3 L1
7 L3 L1 L3
8 L3 L2 L1
9 L3 L3 L2
Where A, B and C are process parameter & L1, L2 and L3 are levels of each parameter.
5. EXPERIMENTATION:
The specimen is prepared from the AISI 410 and MS of dimension 80*40*4mm. The welding parameters to this research are taken as current, voltage and gas flow rate. The S/N ratio for each level of process parameters is computed based on S/N analysis. Further, statistical analysis of variance (ANOVA) was performed to indicate which process parameters are significant. Thus the optimal combination of the process parameters can be obtained.
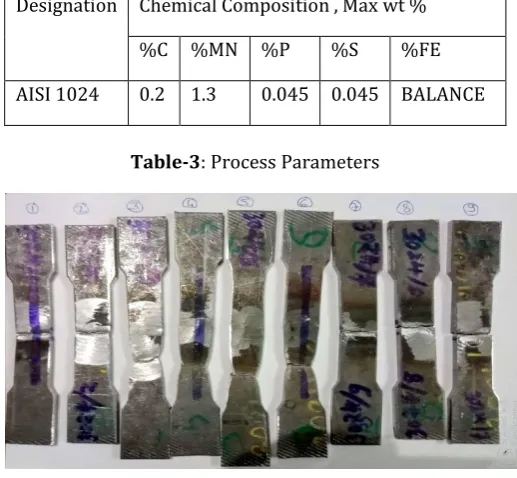
Table-2: Chemical Composition of Stainless steel 410 in wt. %.
Designation Chemical Composition , Max wt %
%C %MN %P %S %FE
AISI 1024 0.2 1.3 0.045 0.045 BALANCE
Table-3: Process Parameters
Fig-1:- Specimens after Tensile Test.
Tensile test is used to determine the tensile strength of the welded joint of Austenitic Stainless Steel (AISI 410). The test is conducted on Universal Testing Machine (UTM) and the result is shown in table no - 4:
Table-4: Universal Testing Machine (UTM) Results.
Run Current Voltage Gas Flow Rate
Tensile Strength
(Mpa)
Hardness (HAZ)
1 125 20 14 297.33 189.6
2 140 20 17 329.26 170
3 150 20 20 424.95 169.4
4 125 25 14 430.04 167.6
5 140 25 17 425.73 172.8
Sr.
No.
Symbol
Parameter
Process
Unit
1
A
Welding Current
Amp
2
B
Arc Voltage
Volt
[image:2.595.317.566.404.513.2]© 2019, IRJET | Impact Factor value: 7.211 | ISO 9001:2008 Certified Journal
| Page 4458
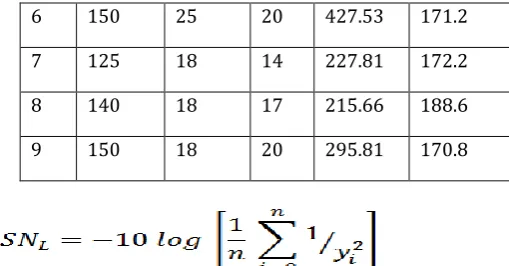
6 150 25 20 427.53 171.2
7 125 18 14 227.81 172.2
8 140 18 17 215.66 188.6
9 150 18 20 295.81 170.8
For 1st run: n = 1 because we get the result in single trial yi = 297.33(observed value) so, S/N = -10 log (1/ 297.332) = 49.46 similarly we calculate S/N Ratio for every run. The response values measured from the experiments and their corresponding S/N ratio values are listed in table no -5 below.
RESULT & DISCUSSION:
[image:3.595.36.291.98.231.2]FOR TENSILE STRENGTH:
Table-5: Response of Tensile Strength with S/N ratio:
Main Effects Graph of UTS:
[image:3.595.311.559.113.240.2]Fig-2: Graph for S/N Ratio of Different parameters For Tensile Strength
Table 6-: Mean Response Table for Signal to Noise Ratio For
Level A B C
1 50.79 49.76 49.59
2 52.62 49.87 50.81
3 47.75 51.54 50.77
Delta 4.88 1.77 1.23
Rank 1 2 3
Tensile Strength is on the criteria Larger is better. From the above table we have observed that the Tensile Strength of taken specimen will be higher when the arc current is maintained at 140, arc voltage at 25V and gas flow rate at 17L/min thus we find these parameter optimum for this experiment.
Table-7: ANOVA of Variance for S/N Ratio Tensile Strength.
Sou
rce DF Seq SS Contribution Adj SS Adj MS F-Val
ue P-Val
ue
A 2 0.000386 78.90% 0.000386 0.000193 69.1 0.014
B 2 0.000065 13.22% 0.000065 0.000032 11.57 0.08
C 2 0.000033 6.75% 0.000033 0.000017 5.91 0.145
Err
or 2 0.000006 1.14% 0.000006 0.000003 Run Current Voltage Flow Gas
Rate
Tensile Strength
(MPA)
S/N Ratio
1 125 20 14 297.33 49.46
2 140 20 17 329.26 50.35
3 150 20 20 424.95 52.56
4 125 25 14 430.04 52.67
5 140 25 17 425.73 52.58
6 150 25 20 427.53 52.61
7 125 18 14 227.81 47.151
8 140 18 17 215.66 46.67
[image:3.595.328.539.318.452.2]© 2019, IRJET | Impact Factor value: 7.211 | ISO 9001:2008 Certified Journal
| Page 4459
The ANOVA is used to investigate which process parameters have significantly affected the quality characteristics. ANOVA gives the detail about the percentage contribution made by the various process parameters and the error. Thus it helps in evaluating importance of process parameter.
FOR HARDNESS:
Table-8: Response of Hardness with S/N ratio:
Fig-3: Graph for S/N Ratio of Different Parameters for Hardness
Table-9: Results of Optimum Parameters for Hardness
Level A B C
1 44.96 44.96 45.25
2 44.64 44.92 44.58
3 44.91 44.63 44.68
Delta 0.32 0.32 0.66
Rank 2 3 1
[image:4.595.300.568.283.422.2]From the above table we have observed that the Hardness of taken specimen will be higher when the arc current is maintained at 125 A, arc voltage at 20V and gas flow rate at 14 L/min thus we find these parameter optimum for this experiment and we have the ANOVA result in below table.
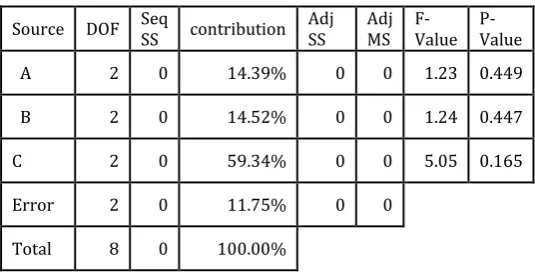
Table-10: ANOVA of Variance for S/N Ratio Hardness
Source DOF Seq SS contribution Adj SS Adj MS F-Value P-Value
A 2 0 14.39% 0 0 1.23 0.449
B 2 0 14.52% 0 0 1.24 0.447
C 2 0 59.34% 0 0 5.05 0.165
Error 2 0 11.75% 0 0
Total 8 0 100.00%
CONCLUSIONS:
The present experiment can be concluded in the following steps:
1 .In this experiment Taguchi design is used for the optimization of welding parameters for the joint of stainless steel (AISI 410) and mild steel.
2 Optimized parameters for the tensile strength is
Arc Current Level 2 140
Arc Voltage Level 3 25
Gas Flow Rate Level 2 17
3 Optimized parameters for the Hardness is
Arc Current Level 1 125
Arc Voltage Level 1 20
Gas Flow Rate Level 1 14 Run Current Voltage Flow Gas
Rate
Hardness
(HAZ) Ratio S/N
1 125 20 14 189.6 45.55
2 140 20 17 170 44.60
3 150 20 20 169.4 44.57
4 125 25 14 167.6 44.48
5 140 25 17 172.8 44.75
6 150 25 20 171.2 44.67
7 125 18 14 172.2 44.72
8 140 18 17 188.6 45.51
© 2019, IRJET | Impact Factor value: 7.211 | ISO 9001:2008 Certified Journal
| Page 4460
REFERNCES:
1 Optimization of CO2 Laser Beam Welding Process Parameters to Attain Maximum Weld Strength in Dissimilar Metals. (2018) M.P.Prabakaran, G.R.Kannan 2 Optimization of Welding Parameters by Using Taguchi Method and Study of Fracture Mode Characterization of SS304H Welded by GMA Welding.( 2018) Saadat Ali Rizvi, , S.P Tewari
3 Optimization of Process Parameters for Al6061-Al7075 alloys in Friction Stir Welding using Taguchi’s Technique. (2018) Ugrasen Ga*, Bharath Ga, Kishor Kumar Ga, Sagar Ra, Shivu P Ra, Keshavamurthy Rb
4 PARAMETERIC OPTIMIZATION OF TIG WELDING ON JOINT OF STAINLESS STEEL (316) & MILD STEEL USING TAGUCHI TECHNIQUE.(2017)Kumar Rahul Anand1, Vijay Mittal2.
5 Optimization of Process Parameters for MIG Welding by Taguchi Method. (2017) Rakesh Kumar1,* and Gurinder Singh Brar2
5 Parametric Optimization of Gas Metal Arc Welding Process by using Taguchi method on Ferritic Stainless Steel AISI409. (2017) Nabendu Ghosha, Ramesh Rudrapatib*, Pradip Kumar Palc, Gotam Nandic
6 Optimization of TIG Welding Process Parameters Using Taguchi’s Analysis And Response Surface Methodology. (2017) Sanjay Kumar
7 Parametric Optimization of Tungsten Inert Gas (TIG) Welding by using Taguchi Approach. (2016) Abhishek Prakash 1, Raj Kumar Bag 2, Siva Sankar Raju 3
8 Optimization of Resistance Spot Welding Process Parameter by Taguchi Method. (2016) Prof. A. A. Karad1, Mr. V. S. Shete2, Mr. N. V. Boraste3
9 Optimization Of Parameters For Spot Welding Process By Experimentation. (2016) 1maongtemsu Pongener, 2g.Gopinath
10 Application Of Taguchi Method For Optimization Of Continuous Drive Friction Welding Process Parameters. (2016) Loveleen Kumar Bhagi, Shankar Singh, Indraj Singh 11 Optimization of CO2 Laser Welding Process Parameters for Automotive Gear using Taguchi Method. (2016) Anurag Khajanchee1, Prabhash Jain2, Sharad K. Pradhan3 12 Welding Parameter Optimization of Alloy Material by Friction Stir Welding using Taguchi Approach. (2016) Karwande A.H. †* and S.S. Rao
13 "An Overview on Taguchi Method. (2015)" Shyam Kumar Karna, Dr. Rajeshwar Sahai
14 Optimization Of Machining Parameters In Ball-End Milling Using Taguchi Method. (2015) Milenko Sekuli, Marin Gostimirovi , Obrad Spai , Vlastimir Peji 1
15 Optimization of Welding Parameters Using Taguchi Method for Submerged Arc Welding of Conveyor
Pulley.(2015) Sharma Umangkumar1, Chavda Mehul2, Patel Jigar3, Prof. K. D. Bhatt4
16 Response surface method and Taguchi Orthogonal Array applied to phenolic wastewater by advanced oxidation process (AOP). (2014) Ana Paula Barbosa Rodrigues de Freitas1, *, Leandro Valim de Freitas1, 2,Carla Cristina Almeida Loures1, Lúcio Gualiato Gonçalves1, Messias Borges Silva1, 3
17 Design of Experiments. (2013) Ralph Waldo Emerson,
18 Application of Taguchi Method for Optimization of Process Parameters in Improving the Surface Roughness of Lathe Facing Operation. (2012) Srinivas Athreya1, Dr Y.D.Venkatesh2
BIOGRAPHIES:
Bhushan Premsukh Jain is now pursuing his Bachelor of Engineering in Mechanical Engineering at D. Y. Patil School of Engineering Academy, Ambi, Pune. He is presently working on the project of Parametric Optimization of CO2 Welding on FE410 Using Taguchi Technique organized by Gloria Engineering LTD, Chincwad MIDC, Pune.
Darshan Vinod Sanghavi is now pursuing his Bachelor of Engineering in Mechanical Engineering at D. Y. Patil School of Engineering Academy, Ambi, Pune. He is presently working on the project of Parametric Optimization of CO2 Welding on FE410 Using Taguchi Technique organized by Gloria Engineering LTD, Chincwad MIDC, Pune.