Maths Counts
Evaluation report and executive summary
November 2018
Independent evaluators:
The Education Endowment Foundation (EEF) is an independent grant-making charity dedicated to breaking the link between family income and educational achievement, ensuring that children from all backgrounds can fulfil their potential and make the most of their talents.
The EEF aims to raise the attainment of children facing disadvantage by:
identifying promising educational innovations that address the needs of disadvantaged children in primary and secondary schools in England;
evaluating these innovations to extend and secure the evidence on what works and can be made to work at scale; and
encouraging schools, government, charities, and others to apply evidence and adopt innovations found to be effective.
The EEF was established in 2011 by the Sutton Trust as lead charity in partnership with Impetus Trust (now part of Impetus - Private Equity Foundation) and received a founding £125m grant from the Department for Education.
Together, the EEF and Sutton Trust are the government-designated What Works Centre for improving education outcomes for school-aged children.
For more information about the EEF or this report please contact:
Danielle Mason
Head of Research
Education Endowment Foundation 9th Floor, Millbank Tower
21–24 Millbank SW1P 4QP
p: 020 7802 1679
Education Endowment Foundation 2
About the evaluator
The project was independently evaluated by a team from Durham University: Dr Beng Huat See, Dr Rebecca Morris, Professor Stephen Gorard and Dr Nadia Siddiqui.
The lead evaluator was Dr Beng Huat See.
Contact details:
Dr Beng Huat See School of Education Durham University Leazes Road Durham DH1 1TA
Contents
About the evaluator ... 2
Contents ... 3
Introduction ... 6
Methods ... 12
Impact Evaluation ... 24
Implementation and process evaluation ... 41
Conclusion ... 52
References ... 56
Appendix A: The pilot ... 58
Appendix B: TIDieR checklist ... 61
Appendix C: Opt out consent ... 63
Appendix D: Memorandum of Understanding ... 66
Appendix E: End of Trial Review and Feedback Report ... 72
Appendix F: Digital tool activity ... 82
Appendix G: Security rating template ... 85
Education Endowment Foundation 4
Executive summary
The project
Maths Counts aims to raise the attainment of children who struggle with basic mathematics at Key Stage 2. The intervention was developed by The Mead Community Primary School drawing on the principles of the Numbers Count programme developed by Every Child Counts at Edge Hill University. Maths Counts lessons last 30 minutes and take place at least three times a week for a minimum of ten weeks. Schools have access to an online tool that stores information about pupils’ progress, supports the planning of lesson objectives, and suggests activities and resources for each lesson. The first ten minutes of Maths Counts lessons focus on recall and reinforcement of prior learning, and the following 20 minutes introduce new knowledge and skills. The online tool suggests activities and resources to use, such as throwing and catching a soft football in order to count in sequenced steps or using coins to develop an understanding of money.
In this project, schools selected pupils in Years 3 to 6 to participate in the intervention, prioritising pupils at risk of not achieving nationally expected levels, younger pupils, and pupils eligible for the Pupil Premium. The intervention was delivered on a one-to-one basis by teaching assistants. Schools were able to approach the timetabling of the intervention flexibly, so some lessons were scheduled during maths lessons while some took place elsewhere in the school day. Teaching assistants were supported by their schools’ maths leads (the school’s maths co-ordinator or specialist teacher). Support for delivery of the intervention was provided by the Mead Academy Trust project team. Before the intervention started, the project team provided two days of training for both maths leads and teaching assistants. The maths leads then delivered four further training sessions throughout the intervention to the teaching assistants in their school.
After an initial development phase where the project team developed a website and the online tool, Maths Counts was evaluated by Durham University using a randomised controlled trial involving 291 pupils across 35 schools. Each school identified eight eligible pupils, four of whom were randomised to receive the intervention while the other four formed the ‘business as usual’ comparison group. The trial tested the impact of Maths Counts on maths attainment measured using the General Maths component of the CEM InCAS assessment. The implementation and process evaluation consisted of observations and interviews. School recruitment began in early 2016 and the project ended when pupils were tested in April 2017.
Key conclusions
1. Children who received Maths Counts made the equivalent of two additional months’ progress in general maths, on average, compared to similar pupils that did not receive the intervention. This result has a low to moderate security rating.
2. Pupils who were eligible for free school meals made two months less progress if they took part in the intervention, compared to similar pupils who did not. This result may have lower security than the overall findings because of the smaller number of pupils.
3. Maths Counts appeared to be more effective with the youngest (Year 3) pupils and with the lowest attainers in this age group. This result may have lower security than the overall findings because of the smaller number of pupils.
4. Implementation appeared to be enhanced when Maths Counts had the support of school leaders who provided time and space for the intervention to take place.
EEF security rating
These findings have a low to moderate security rating. This was an efficacy trial, which tested whether the intervention worked under developer-led conditions in a number of schools. It was a well-designed randomised controlled trial. However, the trial was slightly smaller than usual and there were some important differences in prior attainment between the pupils who received the intervention and comparison pupils.
Additional findings
Maths Counts appeared to be more effective with the youngest (Year 3) pupils and, amongst these pupils, with the lowest attainers. Pupils in Year 3 made substantial additional progress in maths and developed more positive attitudes towards maths. This finding is consistent with the views of the teaching staff that Maths Counts is better suited to the younger and lower performing pupils. However, all of the analyses conducted on individual year groups involved a small number of pupils and should be treated with caution. Further analysis suggested that schools that completed the intervention with good fidelity achieved more positive outcomes, suggesting that this is important for maximizing the impact of the intervention.
Cost
[image:6.595.73.526.440.559.2]The cost of running the Maths Counts programme is estimated at around £125 per pupil per year over three years. It has to be noted that the training is an initial starting up cost, and once trained, the Learning Partners (LPs) and maths leads (MLs) can, in turn, train other teachers or teaching assistants. Schools can continue using the programme with minimal costs as the boxes of resources and the privacy board (learning environment) can be used repeatedly with different children.
Table 2: Summary of impact on primary outcome
Outcome/Group Effect size
Estimated month’s progress
EEF security rating
No. of pupils
EEF cost rating
Maths +0.12 2 291 £££££
Maths—pupils eligible for free
Education Endowment Foundation 6
Introduction
Intervention
Maths Counts (MC) is delivered by trained teaching assistants referred to by the developers as Learning Partners (LPs). Learning Partners is the preferred term as they do not necessarily need to be teaching assistants. They could, for example, be other trained school staff or students. These LPs are supported by a maths lead (ML). The ML is a senior maths teacher (usually the maths co-ordinator or maths specialist) whose role is to promote and manage Maths Counts within the school and support the LPs. Each ML supports two LPs. MLs select the LPs based on their skills and availability for planning and conducting the three sessions per week.
The unique feature of MC is the Digital Tool—a piece of software specially developed to facilitate the delivery of the intervention. The Digital Tool stores information about each learner’s knowledge about maths concepts and understanding. It guides the Learning Partner in planning the lesson objectives for the individual learner and suggests activities and relevant resources to use for each lesson.
MC lessons are conducted using a privacy board which creates a ‘Mini Learning Environment’ (MLE). The board is used to display helpful visual resources for learning and is personalised for the learner. It can also be used to screen the lesson from distracting surroundings. Each school is provided with two of these boards, and schools can either make or buy additional boards if needed. Visual resources helpful in creating the MLE are available on the MC website.
Each learner also has a Maths Map, which is essentially a visual image of the progress they are making. This is a key component of the intervention, designed as a talking point between the learner and LP in order to raise self-confidence and support learners in thinking about their own learning and progress. Learners can chose between working with a digital version of their Maths Map on the Digital Tool or a ‘sticky-note’ hard copy version made from folded card (see below).
Privacy board or mini learning environment Maths map (sticky note version)
The Maths Map is made up of three categories: ‘things I can do’, ‘things I am getting better at’ and ‘things I have stated working on’. Putting a large number of the ‘secured’ objectives from diagnostic assessment within the ‘things I can do’ category means the learner recognises immediately that they can already ‘do’ lots of maths and therefore helps give them a positive start to their programme. Learning objectives are moveable across the Maths Map and are added to as new objectives are selected for lessons. Each week the LPs take a few minutes to look at the map alongside the learner, think about progress over the last few lessons and reflect on this by moving statements across to the appropriate section of the map. LPs encourage learners to also think about ‘learning to learn’ behaviours and include these statements on the Maths Map where applicable. These include statements such as ‘I can chose a resource that will help me’ or ‘I can explain what I did’.
Numicon™ shapes, bead strings, number lines and cards, base-10 rods, counters, treasure coins, digit cards, place-value arrow cards, dice, playing cards, a soft football, stationery set (play shop), sticks/straws, coins, and base boards—for example, bus base board, ladybird board, 100 square, hundreds/tens/ones board, base-10 calculation board, coins calculation board, treasure chests, and an array board.
Diagnostic lessons
Every Maths Counts programme starts with a set of diagnostic lessons to establish what the child (known in the intervention as ‘the learner’) can already do and to identify misconceptions or gaps in their knowledge of basic concepts of number. The diagnostic lessons are conducted by maths leads (MLs) on a one-to-one basis. This takes place as and when time permits for the MLs and the learners, but all diagnostic lessons have to be completed before delivery of the programme can begin. A full assessment of the child’s starting point involves five to seven ‘scripted’ diagnostic lessons. Each diagnostic lesson lasts approximately 30 minutes. These diagnostic lessons determine what the children can already do and what aspects of maths need to be addressed. This information is then uploaded onto the Digital Tool and used by the Learning Partners to plan each lesson.
Maths counts lessons
When
Maths Counts lessons are conducted at least three times a week for a minimum of ten weeks during curriculum time. When the lessons take place is decided between the ML and the class teacher, but generally schools rotate the class lessons missed to avoid learners missing the same lessons each week. The minimum number of sessions expected is 30 and LPs are expected to find the time to make up for any lessons that are missed. In this trial, the control pupils received their usual lessons in their normal classes while the treatment children had MC sessions.
Where
MCs lessons are conducted outside the regular classroom. This can be in the library, in the corridor, or in special rooms. Since these can be open spaces, Maths Counts lessons are conducted using the personalised privacy board, which creates a familiar work space for the learners.
How
LPs use the Digital Tool to view the progress of their assigned learners and find the objectives that remain unsecured and need to be worked on. Within each objective on the Digital Tool there is a menu and details of activities and key vocabulary directly linked to this learning goal. Although lessons are planned to meet the needs of the individual learner, the episodic lesson structure is the same for all learners. Each lesson begins with ten minutes of key skill practice which may include tasks requiring basic recall and reinforcement of knowledge and prior learning, followed by 20 minutes of key learning activities which build on previous work and introduce new knowledge and skills. Lessons are planned on the Digital Tool and can be saved and printed. Progress is regularly reviewed via the Maths Map.
Education Endowment Foundation 8
LPs can also offer home learning activities, selecting those that will meet the needs and interests of the learner. Once set-up, the LP can print off the lesson plan and home learning activities. For the Maths Counts trial, home learning activities were optional and were not used by all schools/pupils.
Assessing the objective
Once the child shows understanding across more than one activity for a learning objective, the LP secures that objective on the Digital Tool, identifying it as ‘secure at’ and dating it. LPs are encouraged to be confident in their decisions to secure objectives.
At the end of the Maths Counts programme (that is, after 30 sessions) the learner receives a certificate. This is printed off from the Maths Count website as a celebration of their success.
After the lesson
LPs are recommended by the developers to spend ten minutes after each lesson making notes on the previous session and considering how to move forward with the next lesson. The intention is that this reflection and planning process is more effective while the previous session is still fresh in their minds.
See Appendix B for the TIDieR checklist of the Maths Counts intervention. Further information about the intervention is available at the Maths Counts website: http://mathscounts.co.uk/
Maths Counts training and support
Prior to the delivery of the programme the project team conducts two full-day training sessions. The first training session is to train MLs to use the diagnostic assessment and the Digital Tool. The second session is specifically for the training of LPs. It outlines the theory behind the intervention, suggests how the resources can be used, and explains how each lesson is planned. MLs and LPs attend both training days.
CPD workshops
As part of the intervention, LPs also receive four planned Continuing Professional Development (CPD) workshop sessions delivered by their MLs. Detailed plans and activities for each of these sessions are contained in a handbook compiled by the project team. These take place during the course of the intervention and include specific training linked directly to issues likely to be faced by LPs during their teaching. These are titled ‘working memory and the Connections Model’, ‘making the best use of manipulatives’ (such as Numicon), ‘questioning and exiting the programme’, and ‘teaching multiplication and division’.
It is suggested that these workshops are delivered at two-weekly intervals during the course of the intervention delivery. Each workshop includes a 15-minute review of the programme and a one-hour training session. The review time secures a formal and regular opportunity for LPs to consult MLs about specific issues they may be encountering with their learners.
Background evidence
Under the ECC partnership, targeted schools were partially funded to train specialist Numbers Count teachers. When this targeted public funding for ECC was discontinued under the coalition government in 2010, Edge Hill University took over ECC as a ‘not for profit’ enterprise and continued to provide Numbers Count training to schools as part of a range of pedagogical interventions in mathematics and literacy.
In 2015, a group of teachers in the Mead Academy Trust, one of whom had been trained as a Numbers Count teacher, decided to apply for funding from the Education Endowment Foundation to develop a mathematics intervention. This intervention was named Maths Counts (MC) and it adopted many elements of Numbers Count. Two important distinguishing features of Maths Counts in comparison to Numbers Count are that it is delivered by teaching assistants rather than by teachers and that it uses a digital platform to assist with the planning, recording, and monitoring of lessons. Although developed by the Mead Academy Trust, Maths Counts has benefited from the support of Edge Hill University since early 2017.
Edge Hill University reported on its website that since 2008 over 50,000 children have been supported by 2,800 trained Numbers Count teachers in 2,500 schools (Edge Hill University, 2018). It reported that children made an average of 17 months of gains in four months (four times the expected progress) as measured by schools’ use of the standardised Sandwell Early Numeracy Test, and that 73% of these children achieved the national expectations for their age group at KS1 and KS2 as measured by teacher assessments and national tests. Furthermore, 95% of these children were reported by their teachers to be showing more confidence and interest in learning mathematics in class after NC. Crucially, however, the NC evaluations did not compare the progress of these children with similar children not receiving NC.
The first large-scale independent evaluation of Numbers Count was commissioned in 2009 by the DfE (Torgerson et al., 2011). This was a randomised controlled trial involving 522 pupils from 53 schools across England. It reported a short-term impact of NC on children’s maths attainment, measured using the standardised Progress in Maths test (PiM), when compared to no intervention (ES = 0.33). This was based on post-test scores only, but the intervention group was already ahead at pre-test based on the Sandwell Early Numeracy Test. It is not clear what the gain scores are. There is thus some evidence that the individualised approach to maths teaching can help raise the maths attainment for the weakest children.
Other studies also suggest that interventions that provide data and feedback on maths performance to teachers and pupils (an approach proposed by Maths Counts) are more effective than those focused solely on the quality of teaching. This is supported by a review of 15 rigorous RCTs on maths teaching interventions for low-achieving pupils (Baker et al., 2002). More generically, there is already evidence that training TAs more rigorously to help with pupils underachieving in maths can be beneficial (Holmes and Dowker, 2013). A similar intervention, but with a literacy focus, demonstrated the usefulness of TAs in working with small groups of pupils for catch up (Gorard et al., 2015). However, no such evaluations have been conducted of Maths Counts.
Evaluation objectives
The aim of this evaluation is to answer the main research question:
How effective was the individualised Maths Counts programme in improving the maths skills of primary school children struggling in maths compared with a ‘business as usual’ control group?
Education Endowment Foundation 10
Once schools had identified children eligible for the intervention, opt-out consent (see Appendix C) was sought from parents through the schools for children to take the InCAS maths assessment, and for the school to share pupils’ background information (which includes details such as date of birth, gender, ethnicity, free school meal status, and English as an additional language) with the evaluation team (Durham University) and the assessment provider (Centre for Evaluation and Monitoring). A Memorandum of Understanding was signed by all parties involved in the trial agreeing to comply with the requirements of the trial and with data security and data protection guidelines (see Appendix D).
The evaluation was conducted in accordance with the British Educational Research Association’s ethical guidelines and Durham University’s ethics committee research guidelines. These guidelines ensure that all pupil and assessment data is treated in the strictest confidence and that no individuals or schools are identified or identifiable. All results are reported in aggregated form. The data is anonymised and shared by Durham University with the Education Endowment Foundation data archive. Ethical approval was granted by the Durham University Ethics Committee on 18 January 2016.
Project team
The intervention was developed by members of the Mead Academy Trust. This included:
Nicola Theobald—Project Lead, May 2015 to April 2016
Sarah Couzens—Project Lead, April 2016 to September 2017
Sheila Claridge—Maths Count programme developer, trained Numbers Count teacher
Jayne Bullock—project co-ordination/school liaison
Lyssy Bolton—Executive Head of the Mead Academy Trust/project proposal and oversight
Lindsay Palmer—Headteacher at the Mead Academy Trust; project and budget oversight
Tracy Boulton—Headteacher at Castle Mead Primary; maths lead for pilot phases 1 and 2; project oversight
Lucy Beck—web design
Lisa Freeman—18a Productions; Digital Tool developer
Cath Walker—maths lead at The Mead Primary from Jan 2017; project lead assistant
Becky Millard—maths lead at pilot phases 1 and 2
Mark Long and Pam Robertson—additional Maths Counts Trainers for Bristol and Somerset hubs.
The project delivery team recruited schools to pilot phases and the trial, conducted the training of maths leads and Learning Partners, and compiled the teaching and learning resources and the workshop CPD training manual. An external software developer (18a Productions) was engaged to develop the Digital Tool in close liaison with the Maths Counts programme developer and the project delivery team.
Evaluation team
Trial registration
Education Endowment Foundation 12
Methods
Trial design
The main trial was a one-year, two-armed efficacy trial. Pupils identified as eligible (see below for eligibility criteria) were randomly assigned to either Maths Counts or ‘business as usual’.
Pupils were individually randomised within schools. This should reduce post-allocation demoralisation as all schools would be effectively intervention schools. Whilst individual randomisation within schools runs a slight risk of diffusion, this was minimised as the Digital Tool was password protected, so only treatment pupils’ progress and the appropriate activities as ascertained by the tool could be accessed by LPs. Also, the programme begins with a diagnosis of needs and suggests the appropriate level and activities to be used with an individual child. Since control pupils were not diagnosed, their learning needs were not determined. There were therefore no identified activities for LPs to use with them. Further, part of the process evaluation was to assess the possibility of contamination either by friendship groups or family.
Although the evaluation was not designed as a waitlist trial, schools were told that they could continue the intervention with the control pupils after the trial. This was to encourage school commitment to the programme. No extra cost was incurred as the Learning Partners (teaching assistants) and maths leads had already received training and all schools were also gifted with the box of resources. The developers have also allowed schools to continue with the use of the Digital Tool. This was possible since there were no registration costs involved.
Participant selection
Schools
The recruitment of schools was led by the project delivery team. For the pilot, they targeted schools within the Teaching School Alliance and neighbouring schools (see Appendix A).
For the main trial, the schools recruited came from four main regions: London, Somerset, Bristol and Wiltshire. Schools recruited were those with above the national average percentage of children eligible for Free School Meals (FSM). It is not possible to put a figure on the number of schools that were approached by the developers as no individual schools were approached as such. Schools were recruited largely through promotional activities via three outlets:
interest shown from promotion on the EEF site;
information letter sent to Wiltshire schools; and
professional liaison with a representative of eligible groups of schools, such as Diocese schools with subsequent internal promotion prompting interest.Pupils
Pupil participants were those from Years 3 to 6 identified as eligible. Eligibility was assessed using a combination of teacher judgements of which pupils were deemed to be unlikely to meet the Year 2 Programme of Study and the criteria in the Ofsted framework grade indicators for pupil outcomes. Priority was given, in no particular order, to:
pupils at risk of not achieving the nationally expected levels;
younger Key Stage 2 pupils were also given priority as they were deemed to have most to gain from earlier intervention; and
Pupil Premium pupils.Each school was required to identify at least eight eligible pupils to participate in the trial. An average of four pupils per school would receive the intervention with a further four pupils constituting ‘control’ pupils. Since some of the schools were large primaries and had more than one maths lead, they were able to support more than two LPs and hence more than four learners. Once eligible pupils were identified, opt-out consent was sought from parents via the school (see Appendix C for opt-out consent form). Eligible pupils were then individually randomised within the school to either receive the Maths Counts intervention or to ‘business as usual’ teaching.
Outcome measures
Primary outcomes
Given the year groups involved in the trial, no official outcome measures such as KS2 results were available for all pupils within a one-year trial. Initially the outcome measure of choice was the GL Assessment’s Progress in Maths (PiM). However, during the pilot phase the developers decided that PiM would not be suitable for the kind of children they were supporting. They then chose the CEM InCAS assessment (http://www.cem.org/incas) which was deemed to be more in line with what they wanted to measure. InCAS consists of three modules: General Maths, Maths Attitude and Mental Maths. The primary outcome measure for this trial is General Maths. This includes counting, place values, fractions, patterns, problem-solving, measures, shapes and space and data handling. The choice of test was agreed by all parties including the EEF and the MC team. Another advantage of InCAS is that it was more independent of the intervention than the Sandwell test, which was also used as an optional assessment for the intervention.
As the test is adaptive, only the age-standardised scores are available (according to the assessment provider), so it was decided that the primary outcome for this trial should be the age standardised test of General Maths scores
Pupils’ prior KS1 point scores in maths were used as the pre-test score and also to check for initial balance between groups. This data was obtained from the DfE using pupils’ UPNs and school identifiers, but with UPN identifiers later removed for data protection. A pre-test was originally planned, however, the EEF advised the use of KS1 results as pre-test scores partly to minimise the burden of testing.1
Education Endowment Foundation 14 Secondary outcomes
The secondary outcomes were ‘Mental Arithmetic’ and ‘Attitude towards Maths’ measured using the subscales on the digital CEM InCAS test. Scores for ‘Attitude to Maths’ were collected via the maths-only questions in the attitudes subscale of the CEM InCAS test. This use of the maths-maths-only attitude was approved by CEM (the test developer).
Other data
Pupils’ EverFSM6 status was obtained from the National Pupil Database and used for subgroup analyses. Other background characteristics such as age, date of birth, sex, ethnicity, first language, and Special Educational Needs (SEN) status were also collected, where possible, from schools to establish equivalence between groups.
Sample size
The sample size calculation was based on the assumption that there would be 30 schools and four year groups (Years 3, 4, 5 and 6). The project developers envisaged that there would be an average of about three eligible pupils per class. Assuming 1.5 classes per year group and three eligible pupils per class, there would be 18 pupils per school, giving a total sample of 540 or 270 per arm.
Traditional power calculations are based on the invalid approach of significance testing (Gorard et al., 2017). They are not included here. Instead, we calculate the sample size needed for any ‘effect’ size to be considered secure by considering a priori the number of ‘counterfactual’ cases needed to disturb a
finding (Gorard and Gorard, 2016). This ‘number needed to disturb’ (NNTD) is calculated as the ‘effect’ size multiplied by the number of cases in the smallest group in the comparison (that is, the number of cases included in either the control or treatment group, whichever is smaller). This approach allows for estimating ES and sample size using the formula as shown.
NNTD = ES*n
Therefore, n = NNTD/ES
This is a useful way of interpreting the effect size (and its variability as represented by the standard deviation used to compute the ‘effect’ size) taking into account the sample size. It can then be extended to compare this sensitivity directly to other more substantial sources of error (than chance), such as the number of missing values/cases. The number of cases actually missing a value can be subtracted from the NNTD to give an estimate of how large the ‘effect’ size would be even in the extreme situation that all missing cases had the ‘counterfactual’ score hypothesised in the NNTD calculation. Here the ‘counterfactual’ score is one standard deviation away from the mean of the group with the largest number of cases. The standard deviation would be added if the mean of the smaller group (in scale) were smaller than the mean of the larger group, and subtracted if the mean of the smaller group was the largest (Gorard et al., 2017).
Based on Gorard et al. (2016), NNTD of 50 can be considered a strong and secure finding. Using this as a working assumption, the number of cases needed in each group (assuming equal size) to detect an ‘effect’ size of 0.2 (which is typical for an education intervention) will be 250 (50/0.2). This is assuming no attrition.
capacity to support a larger number of schools, and this was agreed by the EEF. This makes the trial less robust than planned. With 152 cases in the smaller group, to achieve an NNTD of 50 would require the underlying effect size being sought to be 0.33 or greater.
The NNTD calculation concerns the security of a difference and so is relevant to internal validity only. Issues such as clustering, concerned with whether the result may also occur among cases not in the RCT, are therefore irrelevant. In addition, as pupils were individually randomised within schools and analysis was of all pupils in the two groups and not by schools, clustering effects, if there were any, should be evenly spread between the two groups across all schools.
To ensure all pupils were tested, regardless of whether they had left the school, the developers offered school leavers’ destination schools an incentive payment of £200 to complete the InCAS assessment. Details of leavers can be seen in the participant flow diagram.
Randomisation
Pupils identified as eligible were randomised at the individual level within schools to one of two groups: Maths Counts or ‘business as usual’. This was carried out by the lead evaluator using a random number generator programme (random.org) in the presence of colleagues in the School of Education. A total of 305 pupils were identified. Of these, 152 were randomised to receive the Maths Counts intervention and 153 to the ‘business as usual’ control.
Analysis
Analysis was conducted independently of the process evaluation results. This was to avoid either analyses being unconsciously influenced by the other.
Primary intention-to-treat (ITT) analysis
The primary ITT analysis was conducted by comparing the main outcome measure (age standardised scores of InCAS General Maths) between the treatment and the control groups. The results are presented as Hedge’s g ‘effect’ sizes by dividing the difference in the means of the age standardised scores of InCAS General Maths (using the compare means option in SPSS) between treatment and control by the overall standard deviation of the test scores.
In addition, a gain score analysis was conducted as specified in the SAP. As there was a substantial imbalance in the pre-intervention scores, equal to an effect size of +0.13 between groups and this is above the agreed threshold of 0.05 set out in the SAP, the gain scores form the headline finding. They are presented as ‘effect’ sizes based on gain scores calculated using the difference in the mean gain scores made between KS1 maths point scores and descriptive measures and the InCAS General Maths test by the two groups.
For comparability the KS1 maths scores and descriptive measures and InCAS General Maths scores were converted to Z scores.
Education Endowment Foundation 16 Table 3: Mapping of new and old KS1 point scores to levels
OLD NC level New Point scores
A = absent A
D = disapplied from NC D
W (Working towards level 1) BLW = Below—corresponds with
P-scales or NOTSEN 3
1
PKF = Pre-Key stage— Foundations for the expected
standard
9
2c WTS = Working towards
expected standard 13
2b EXS = working at the expected
level 15
2a
GDS = Working at a greater depth within the expected
standard
17
Missing data
Dong and Lipsey (2011) demonstrated that any missing values can create bias, even if attrition is balanced between comparator groups. And where such attrition is not random (as is most often the case) it can bias the estimate of the treatment effect, and the bias can still be large even when advanced statistical methods like multiple imputations are used (Foster and Fang, 2004; Puma et al., 2009). Such bias can distort the results of statistical significant tests and threaten the validity of any conclusion reached (Shadish, Cook and Campbell, 2001; Campbell and Stanley, 1963; Little and Rubin, 1987). We therefore present differences in pre-test scores (KS1 maths) between cases dropping out from both groups (where these are available) and compare the number of missing cases to the number of counterfactual cases needed to disturb (NNTD) the finding (Gorard and Gorard, 2016). The number of counterfactual cases will help determine whether the number of missing cases is large enough to alter/explain the findings. It is a measure of how stable the result is after attrition.
Fidelity analysis
Two analyses were carried out. The first compared the outcomes of pupils with the actual number of sessions they attended (dosage). The number of sessions were used as a continuous variable in the analysis. Data on the number of sessions conducted was collected from the Digital Tool, and provided by the developers who had access to the Tool.
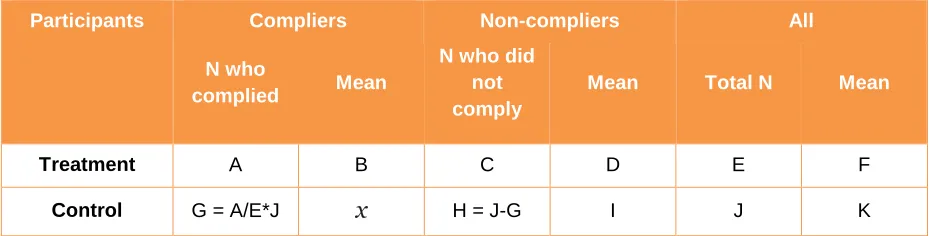
To estimate the effects for the subgroup of treatment students who complied with their treatment assignment the Complier Average Causal Effect (CACE) analysis was performed (Nicholl, undated). Comparison is made of the average outcome of treatment pupils who complied with control pupils who would have complied if given the treatment (assuming same rate of compliance as for the actual treatment group). Specifically, compliance was measured using the threshold of 30, which is the minimum number of sessions recommended. Essentially it is a comparison of what actually happens with what might have happened (Ye et al., 2018).
that because of randomisation, the proportion of compliers in both arms of the trial is the same (on average), and the average outcome for those in the control group who did not comply (I) will be the same as the outcome of non-compliers in the treatment group (D). We may conclude:
proportion in treatment group who complied is A/E;
number in control group who would have complied (G) will be A/E*J
number of non compliers in control group (H) = J-G
the average outcome for compliers in the control group (
x
) is calculated thus: [image:18.595.71.536.259.377.2]x
=
((K*J-H*I)/G))Table 4: Estimation of CACE
Participants Compliers Non-compliers All N who
complied Mean
N who did not comply
Mean Total N Mean
Treatment A B C D E F
Control G = A/E*J
x
H = J-G I J KSecondary outcome analyses
Similar analyses were conducted for the secondary outcomes (Mental Arithmetic and Attitude to Maths) as for the primary outcomes. As the groups were not balanced at pre-test (KS1 scores), comparisons were made of the mean gain scores between KS1 maths point scores and the Age Standardised scores for the InCAS Mental Maths and Attitude to Maths between the two groups. These were converted to Hedge’s g effect sizes.
Additional analyses
Because of the differences between baseline data for Year groups (that is, Years 4, 5 and 6 with levels and Year 3 with descriptive measures) we also analysed the two cohorts separately by converting the descriptive measures into scores equivalent to the NC levels.
For Years 4, 5, and 6, a simple pre- post-test comparison of mean scores was used to determine the effect size using KS1 maths point scores for the pre-test. For the Year 3 cohort—because the pre-test scores are four skewed categories and the post-scores are normal interval scores—the results are shown as the mean post-scores for each initial category. The two lowest band categories (BLW and PKF) contained few pupils, and these are combined into one category (see earlier discussion).
Education Endowment Foundation 18
A one-step multiple regression analysis was also conducted using the combined scores as the converted KS1 scores and the treatment group as predictors, and the InCAS General Maths scores as the dependent variable.
Subgroup analyses
The main analyses were repeated with only those pupils identified as EverFSM6 eligible (using the Spring 2017 record).
Effect size calculation
‘Effect’ sizes for attainment outcomes were calculated as Hedges’ g based on the difference between mean gain scores and post-test scores for each variable, divided by their overall standard deviation. Gain scores are preferred when the groups were clearly unbalanced at the outset (‘effect’ size of 0.05 or more).
‘Effect’ sizes for pre-test categorical variables were based on post odds ratios (see p. 26). The ratios compare the proportion of pupils in the treatment group gaining the specified outcome with the proportion in the control group. This is a standard measure of difference between two categorical variables with strong compositional invariance (Gorard and Taylor, 2002).
All are presented with the number of counterfactual cases needed to disturb the results.
We do not report ‘confidence intervals’ as they are misleading, but an interested reader can compute them if they wish as the number of cases per group, and the effect size for each comparison, are presented.
Implementation and process evaluation
Aims
There were four broad aims for the process evaluation. These were:
1. to assess the fidelity of the implementation of the programme—to observe the extent to which Learning Partners and maths leads deliver the intervention as they have been trained (any departure from this, which could impact on the effects of the trial, will be noted; for this reason we attended all of the training sessions and visited a sample of schools to observe the delivery of the programme);
2. to identify aspects of the programme that may have facilitated change and improvement so that if the programme is found to have positive effects we can suggest reasons for this;
3. to identify challenges faced in the implementation of the programme, and the barriers to effective delivery; and
4. to find out about the perceived impact of the programme:
Do the teaching staff (this could be LPs, MLs and school leaders) think that the children they are supporting have made any progress?
Does the programme shape their teaching practice?
Design
Each of the ten schools would be visited twice, once at the beginning and once at the end of the trial, to register changes in attitude and behaviour of teaching staff. However, two other schools agreed to our visit so these were visited too at the beginning of the trial. Although they were not the case study schools, data collected from visits to these schools is added to our process evaluations. In general these visits took place between January and March 2017.
For the convenience of schools, we arranged the second round of visits to coincide with the day the post-test would be administered. However, just four of the initial 12 schools were able to accommodate us for the second visit. This was either due to Ofsted inspections, SATs mock exams, staff absence or in one case, school building work. In addition we visited two other schools (not the same ones visited in the first round) with the project team as part of their support visits. The second round of visits (scheduled towards the end of the trial) was specifically to assess:
the experience of pupils and teaching staff;
their perceptions of the programme;
perceptions of pupil progress;
whether the school would continue with the programme after the trial and in what form (one-to-one or small group);
the leadership support and if they will still get the support to continue the programme after the trial;
the challenges faced;
whether the training (for MLs and LPs) was adequate to enable delivery of the programme; and
perceptions of the CPD workshops conducted by the maths leads.
In addition, evaluators also attended the two staff training events at each of the four hubs. This was to gather information about the intervention and observe how LPs and MLs were trained in order to assess, during school visits, whether the programme was delivered in line with the training.
Data collection methods
Observations
Fieldwork at the ten case study schools was conducted to observe the delivery of Maths Counts sessions, the training of maths leads and Learning Partners, the delivery of CPD workshops by MLs, and the test administration. These were as non-intrusive as possible. All visits were scheduled well in advance and with the consent of maths leads and other relevant staff in the school. Interviews with staff and focus groups with pupils were also arranged with the MLs to assess participants’ perceptions of the intervention and to provide an opportunity for them to advise on improvements and issues for any future scaling up.
There was no structured protocol for observations and interviews as such in order to have the freedom to capture everything that we saw, heard and experienced. From experience, a structured protocol may constrain what is observed and heard and may also encourage researchers to stick strictly to the protocol and thus ignore potentially relevant observations. Although we did not have any formal observation and interview protocols as such, we did have a broad brief on what to look for on these visits as summarised below.
Observation of the sessions –what to look out for
1. Observe how the sessions are conducted. Are there any departures from the protocol?
Education Endowment Foundation 20 How do they use the manipulatives?
Note anything positive or negative—for example, did they seem impatient or correcting mistakes a lot of time?
What kind of questions do they ask? And how do they ask questions—, for example, is it open ended and how do they guide the child to arrive at the right answer?
How do the LPs respond to the child—for example, if the child looks bored or reluctant to be involved?
Were the children punctual for the session?
3. How do the pupils respond to the lesson?
What’s their body language like?
Are they engaged, interacting with the LP?
Interviews
In addition to observations, feedback was also collected from pupils and teaching staff via face-to-face interviews across 12 schools. These were in the form of informal chats with pupils and LPs (or MLs if available). The brief for these interviews were to:
1. Look out for the possibility of contamination or diffusion. Ask, for example:
Is the school also using other interventions to support struggling pupils?
What support do control pupils get?
Do any of the LPs also support the control children? If so, how was this conducted?
2. Barriers and facilitators
Find out what hinders the effective implementation of the programme (for example, time to prepare lesson, access to computer, quiet space to conduct the lessons, management support, or time-tabling).
What did the school find most challenging when implementing the intervention?
Was there any resistance from LPs (for example, were they not excited about the programme or dubious about its efficacy)? Find out what LPs and MLs think are the key factors that enable them to successfully deliver the lessons.
How many sessions have been conducted? How did they go?
3. Perceived and potential impact
Find out what pupils and teaching staff like about the programme and what they don’t like.
Find out if any activities were sent home to parents to support home learning.
Do they think the intervention has had benefits? What aspects of the intervention do they think were the most beneficial?
Do they plan to carry on using the intervention techniques or materials in some form after the trial? Why?
If they plan to carry on using aspects of the intervention, in what form will this be (one-to-one sessions, small group sessions, and so on)?
4. Improvements
Ask them how they think the programme could be improved (for example, different support, different training, different activities, different schedule, and so on).
Fidelity Measures
The fidelity to the protocol of the intervention was further assessed by the project delivery team in their monitoring and support visits. The delivery team selected six schools which they thought needed support based on the information taken from the Digital Tool showing the number of sessions delivered and the number of objectives secured for each child. Evaluators shadowed two of these visits. These two schools were in addition to the ten case study schools selected for the observations. This offered a chance to observe how the delivery team supported these schools. It also provides additional data for the process evaluation. At these support meetings the delivery team discussed with the MLs and LPs challenges faced in the implementation of MC as well as the strengths of the programme. They also collected feedback from the pupils. Feedback from five of these support visits (including the two we saw) was shared with the evaluation team.
Instead of the planned teacher survey, the delivery team convened a review and feedback session for schools to share their views of the intervention and the trial in general (see Appendix E). The developers felt that the face-to-face and interactive session would allow for more scope for views from LPs and MLs. This presented an opportunity to gather additional feedback from the schools about the programme. Evaluators attended these review sessions at two of the hubs, and information collected added to the data used in the process evaluation. Where schools were unable to attend the workshop, views were sought via a questionnaire sent electronically and responses shared with the evaluation team.
The delivery team monitored the regularity and the quality of the sessions conducted via the Digital Tool where they could view the number of lessons planned and the number of objectives secured for each learner. See Appendix F for an example of the Digital Tool activity log.
Observation of test administration
The evaluation team also observed the administration of the test in schools. This was necessary because the teaching staff were no longer blind to treatment allocation and so there was a possibility of unconscious bias towards Maths Counts children. Observations explored, for example, whether staff adhered to the assessment protocols. In total we visited four schools. These visits focused on:
How the test was administered—for example, did the children take the test two at a time or one by one, and did the control and treatment children take the test separately?
Whether there were any issues during the test, for example, technological problems, or children finishing the test too early, or refusing to participate.
How long the children (on average) took to complete the test.
Were there any irregular administrative or assessment practices occurring—for example, staff giving additional help to some students?
Ad hoc interviews were also conducted with the test administrators (these included teaching assistants, MLs, or senior members of staff). As this was the first time that the CEM InCAS assessment had been used by the evaluation team, these interviews also sought to find out about users’ experiences, which could inform future trials. Questions on this topic included:
How did the test go?
What was your experience with using InCAS?
Did you have any difficulties in registering and setting up the test?
Education Endowment Foundation 22
Costs
The cost of running the intervention is estimated on the assumption that there are four children per school and is based on information provided by the project team. The cost includes:
Cost of delivering the intervention:
resource box and the privacy board.
Cost of staff training:
printing and photocopying of handouts and training guidance;
CPD materials;
ongoing support and monitoring of the Digital Tool (this would depend on the amount of support a school would need and likely to be charged per hour); and
cost of travel and subsistence for the project team to deliver the 2.5 days of training to schools (this was estimated by the evaluators based on previous projects).
Staff time:
school staff time spent in training to deliver the intervention;
school staff time spent on preparation for the delivery;
school staff time spent on delivering the intervention;
time spent on CPD training by MLs for LPs;.
half day supply cover to release staff for initial briefing; and
Timeline
[image:24.595.77.527.141.727.2]Table 5 outlines the overall timeline for the full evaluation, including development and pilot phases.
Table 5: Evaluation timeline
Date Activity
May 2015–September
2015 Development phase.
September 2015– December
Pilot phase 1: develop and test the intervention with three schools in the Mead Academy Trust using a paper based version of the Digital Tool; develop and set up a website.
January 2016–April 2016
Pilot phase 2: develop the early version of the Digital Tool; develop the training of maths leads and Learning Partners and the delivery of the programme.
March 2016–July 2016 Recruitment of schools to the trial.
August 2016 Memorandum of Understanding and agreement to the evaluation signed.
September 2016 Leadership briefing conducted in the four hubs.
October 2016
First training session for maths leads and Learning Partners; maths leads introduced to the project and trained to conduct the diagnostic test; observation of training session.
October 2016– December 2016
Schools identify eligible pupils; randomisation of pupils; maths leads conduct diagnostic lessons with treatment pupils and upload pupil data onto the digital tool.
January 2017
Second training session for Learning Partners and maths leads; Learning Partners introduced to the lesson planning using the Digital Tool and lesson delivery; observation of training.
January–March Schools register for the InCAS assessment .
January–March 2017 Delivery of Maths Counts; case study site visits to observe delivery sessions and collect teacher and pupil feedback.
April 2017 Evaluation week: pupils take the InCAS assessment; follow-up pupils who have left schools to set up the tests; assessment completed.
May 2017 Feedback and review week: collect feedback from teachers on their experiences of Maths Counts.
June 2017 Put in request for NPD KS1 data.
September 2017 NPD data received; preliminary impact evaluation analysis conducted; process evaluation report completed.
Education Endowment Foundation 24
Impact Evaluation
Participants
In total, 35 schools were recruited to the trial (see Figure 2). It is difficult to estimate the numbers of schools that were approached. The project team explained that schools were contacted via professional links who circulated alerts about the Maths Count trial in Somerset, BANES, Dorset, and Wiltshire through blanket send-outs. School leaders in the Inspire partnership in Woolwich, DSAT (Diocese of Salisbury Academy Trust) and the CLF (Cabot Learning Federation Teaching School Alliance) in Bristol directly targeted schools in their area that they felt may benefit from the intervention. Interested schools then contacted the project team and expressed interest; 42 schools were considered as eligible and directly approached, of that number, 35 were signed up. No school dropped out.
Figure 1: Participant flow diagram
Recruited School n= 35 Eligible pupil n = 305
Randomised
Treatment Control
Missing pre-test score, Pupil n = 3 Total Treatment, Pupil n = 149 Missing General Maths score, n = 2
Missing Mental Maths, n = 6 Missing Maths Attitude, n = 7
Missing pre-test score, Pupil n = 5 Total Control, Pupil n = 148 Missing General Maths score, n = 4
Missing Mental Maths, n = 5 Missing Maths Attitude, n = 6
Analysed General Maths n = 147 Mental Arithmetic n = 143 Attitude to Maths n = 142
Analysed General Maths n = 144 Mental Arithmetic n = 143
Education Endowment Foundation 26
[image:27.595.71.543.199.415.2]As shown in Figure 1, 305 pupils were initially listed to be in the trial. Of these, eight did not have pre-test scores, meaning that there were 297 randomised pupils with pre-pre-test scores. Some were also missing post-test scores for some modules, including six cases with no General Maths scores. The headline figures are therefore based on 291 cases. One possible explanation given by the test supplier is that the pupil had either not completed the assessment or the school had used a non-web version and had not returned the results. Another possibility is that there was a malfunction in the system. For example, in one school a child had clearly taken the test, but no scores were recorded.
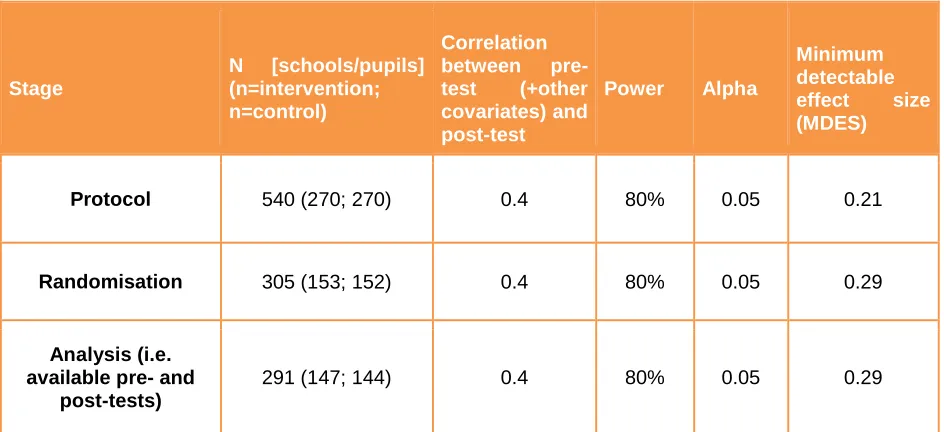
Table 6: Minimum detectable effect size at different stages
Stage
N [schools/pupils] (n=intervention; n=control)
Correlation between pre-test (+other covariates) and post-test
Power Alpha
Minimum detectable effect size (MDES)
Protocol 540 (270; 270) 0.4 80% 0.05 0.21
Randomisation 305 (153; 152) 0.4 80% 0.05 0.29
Analysis (i.e. available pre- and
post-tests)
291 (147; 144) 0.4 80% 0.05 0.29
Note: although at least one pre- and post-intervention score is available for 297 cases, the headline findings are based on 291 cases (see Figure 1). Alpha, power and MDES are presented here as required by the EEF. MDES calculated using Powerup tool.
Pupil characteristics
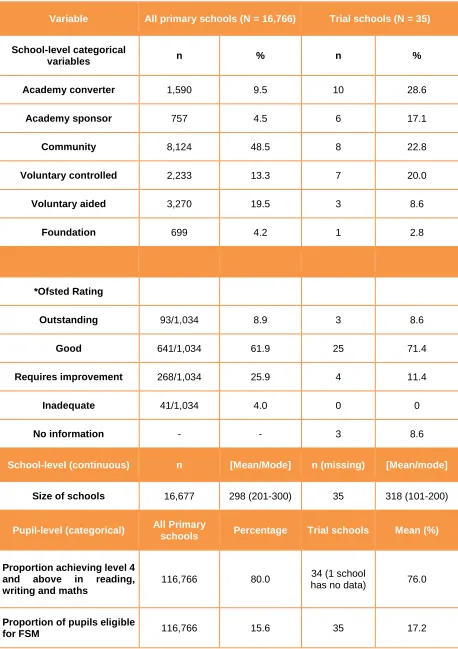
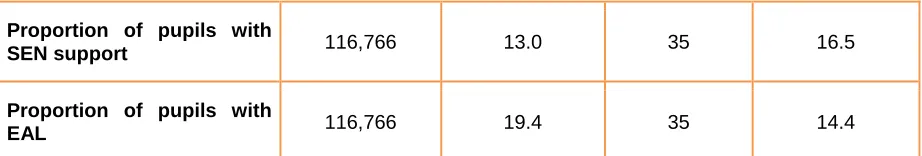
Table 7 shows that the schools that took part in the trial are more likely to be academies compared to all other primary schools in England. In terms of their Ofsted ratings, schools are comparable to the national average although they are marginally more likely to be rated ‘good’ or ‘outstanding’. They also tend to be smaller schools although there are a couple of large academy trust schools. The trial schools are also, on average, lower performing compared to the national average. Only 76% of pupils in these schools achieved the expected level 4 or above at KS2 in reading, writing and maths compared to 80% for all primary schools in the country. Compared to the national average, the trial schools also have proportionately more disadvantaged children (higher proportion of FSM and SEN). However, they are less likely to have children for whom English is an additional language. This is probably because of the geographical location of the schools, being largely concentrated in the South-west of England, a predominantly White British area.
Table 7: Comparison of trial schools and all primary schools in England (based on 2015 School Performance tables)
Variable All primary schools (N = 16,766) Trial schools (N = 35)
School-level categorical
variables n % n %
Academy converter 1,590 9.5 10 28.6
Academy sponsor 757 4.5 6 17.1
Community 8,124 48.5 8 22.8
Voluntary controlled 2,233 13.3 7 20.0
Voluntary aided 3,270 19.5 3 8.6
Foundation 699 4.2 1 2.8
*Ofsted Rating
Outstanding 93/1,034 8.9 3 8.6
Good 641/1,034 61.9 25 71.4
Requires improvement 268/1,034 25.9 4 11.4
Inadequate 41/1,034 4.0 0 0
No information - - 3 8.6
School-level (continuous) n [Mean/Mode] n (missing) [Mean/mode]
Size of schools 16,677 298 (201-300) 35 318 (101-200)
Pupil-level (categorical) All Primary
schools Percentage Trial schools Mean (%)
Proportion achieving level 4 and above in reading, writing and maths
116,766 80.0 34 (1 school
Education Endowment Foundation 28 Proportion of pupils with
SEN support 116,766 13.0 35 16.5
Proportion of pupils with
EAL 116,766 19.4 35 14.4
Data for all school characteristics relates to January 2015 and was downloaded from the Department for Education 2015 Performance Tables. (http://www.education.gov.uk/schools/performance/download_data.html). Ofsted ratings for intervention schools are taken from the latest inspection reports.
[image:29.595.72.533.83.161.2]*National data for Ofsted ratings is based inspections completed between 1 Jan 2015 and 31 March 2015. (https://www.gov.uk/government/statistics/maintained-schools-and-academies-inspections-and-outcomes-january-2015-to-march-2015)
Table 8: Comparison of pupil baseline characteristics in intervention and control schools
Variable Intervention Control Total Characteristics of pupils at
randomisation (total 305)
Mean Mean
Age (in years) 7.66 7.68 305
Proportion of boys 52.0% 50.3% 305
Proportion of pupils eligible for FSM 36.2% 40.5% 305
Proportion of pupils with SEN 52.6 % 54.9% 305
Proportion of pupils whose first
language is not English 18.4% 13.7% 305
Proportion of pupils who are not
White British 26.3% 29.4% 305
Proportion in Y3 54.6% 51.0% 161
Proportion in Y4 28.9% 34.0% 96
Proportion in Y5 13.2% 9.8% 35
Proportion in Y6 4.3% 5.2% 13
Mean KS1 maths performance (total
297) Effect size
Combined for Y3, Y4, Y5 and Y6 11.67 11.34 +0.12 297
Y4, Y5, Y6 11.21 10.69 +0.18 137
Y3 Odds ratio
Proportion achieving expected level 7.2% 9.1% 0.75 160
Proportion achieving below
expected level 24.1% 27.3% 0.85 160
Proportion working towards
expected level 68.7% 63.6% 1.25 160
*Eight pupils do not have KS1 results.
at the expected level for their age, 17 means that the child is working above expected level and 13 indicates that the child is working towards the level expected for their age. Scores of 3 and 9 indicate that the child is working below their age-expected level.
Over half of the pupils are in Year 3 (Table 8). Compared to the control group, Year 3 pupils in the intervention group are 1.25 times more likely to be working towards the expected level but less likely to be achieving the expected level. Overall, intervention children are ahead of control children at pre-test.
Outcomes and analysis
Missing cases
[image:30.595.72.537.294.421.2]There were eight cases with post-scores that were missing any pre-score, and these are excluded. Table 9 shows the number of pupils with pre-test scores (KS1) for each of the three maths modules of the InCAS assessment.
Table 9: Number of pupils with pre-test scores by year groups for the three modules
Pre-test General Maths Mental Maths Maths Attitude Treatment Control Treat Control Treat Control
Overall N = 297 149 148 149 148 149 148
Y3 (n = 160) 81 75 80 75 80 75
Y4, 5 and 6 (n = 137) 66 69 63 68 62 67
Total Analysed 147 144 143 143 142 142
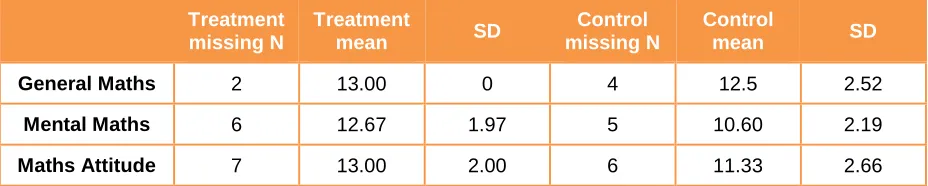
[image:30.595.72.536.562.655.2]Table 10 shows the pre-scores for any cases among the 297 who are missing one or more post-test scores. When means of those cases missing scores from the treatment group are compared to those in the control group, the pupils missing from the treatment group have slightly higher average pre-scores than those missing from the control. However, overall the missing data is above average to high for both groups (with mean missing scores for both groups well above the mean scores for all pupils in Table 11). The maximum missing is 4% for the Maths Attitude scores, and the headline finding for General Maths has only 2% missing data. There is no reason to believe that these cases have influenced the overall result (see NNTD analysis below).
Table 10: Pre-scores for cases missing post-test scores
Treatment missing N
Treatment
mean SD
Control missing N
Control
mean SD
General Maths 2 13.00 0 4 12.5 2.52
Mental Maths 6 12.67 1.97 5 10.60 2.19
Maths Attitude 7 13.00 2.00 6 11.33 2.66
* The missing cases include pupils who have taken the test but whose scores were not recorded due to a glitch in the digital test (see Figure 1 for details on numbers missing post-test scores for each of the module) and pupils who did not have KS1 results.
Headline findings
Education Endowment Foundation 30 Table 11: Comparison of pre, post, and standardised gain scores for General Maths (age equivalent), all pupils
N
Pre-score mean
SD ES
Post-score mean
SD ES Gain
score SD ES
Treatment 147 11.65 2.70 - 7.71 1.07 - 0.08 1.19 -
Control 144 11.31 2.62 - 7.50 0.97 - -0.05 1.00 -
Overall 291 11.48 2.66 +0.13 7.61 1.03 +0.20 0.01 1.10 +0.12
Note: the pre-intervention scores (KS1) use a different scale to the post-intervention scores (InCAS test).
For General Maths, the results (Table 11) suggest a small positive difference in favour of the treatment group. Significance tests and confidence intervals are not presented here. Both are based on the strict assumption that there is no missing data. And even if this condition was met they would still not be appropriate because they only tell us the probability of observing the results we get assuming that there is no difference between the groups (Colquoun, 2014, 2016; Gorard, 2016). Our analysis is concerned with whether there is, in fact, a substantive difference between groups, as far as we can judge and given the missing data. Therefore, instead we calculate the Number Needed to Disturb (NNTD), which is defined as the number of counterfactual cases needed to alter the finding. By comparing the number of missing cases to the number of counterfactual cases needed to disturb the finding, we can determine whether the number of missing cases is large enough to alter/explain the findings. It is a measure of how stable the result is after attrition (a test of sensitivity).
The number of counterfactual cases needed to disturb this finding would be 17. This means that it would take 17 missing cases to eliminate the effects, whereas the number of missing cases here is only six. Therefore, it is not possible for this result to be created solely by the missing data. Nevertheless, the ES is small given the overall cost of the intervention (below).
Secondary outcomes
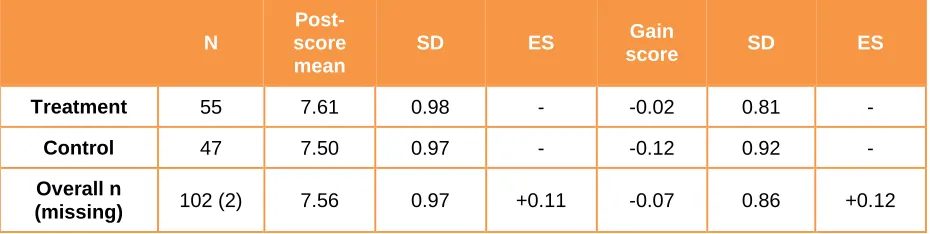
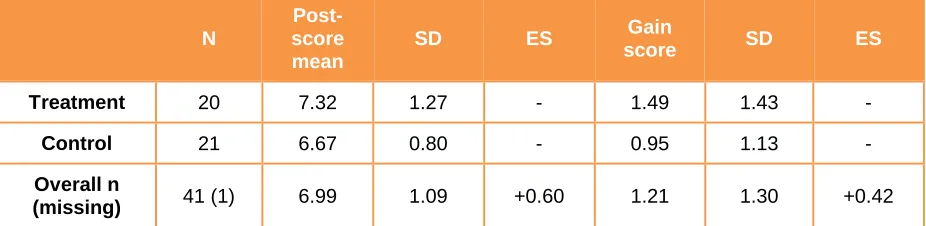
For the two secondary outcomes (Mental Maths and Maths Attitude), the two groups are again unbalanced in terms of KS1 maths scores (Tables 12 and 13). Maths Counts appear to have a small benefit for the treatment group in terms of Maths Attitude. However, there is a small negative result for Mental Maths.
Table 12: Comparison of pre, post, and standardised gain scores for Mental Maths (standardised), all pupils
N
Pre-score mean
SD ES
Post-score mean
SD ES Gain
score SD ES
Treatment 143 11.63 2.71 - 84.45 16.17 - -0.014 1.26 -
Control 143 11.36 2.63 - 83.69 17.97 - 0.043 1.42 -
Overall 286 11.50 2.67 +0.10 84.07 17.06 +0.04 0.015 1.34 -0.04