R E S E A R C H
Open Access
Facilitating Implementation of Research
Evidence (FIRE): an international cluster
randomised controlled trial to evaluate
two models of facilitation informed
by the Promoting Action on Research
Implementation in Health Services
(PARIHS) framework
Kate Seers
1*, Jo Rycroft-Malone
2, Karen Cox
3, Nicola Crichton
4, Rhiannon Tudor Edwards
5, Ann Catrine Eldh
6,7,
Carole A. Estabrooks
8, Gill Harvey
9, Claire Hawkes
10, Carys Jones
5, Alison Kitson
11, Brendan McCormack
12,
Christel McMullan
13, Carole Mockford
14, Theo Niessen
3, Paul Slater
15, Angie Titchen
15, Teatske van der Zijpp
3and Lars Wallin
7,16,17Abstract
Background:Health care practice needs to be underpinned by high quality research evidence, so that the best possible care can be delivered. However, evidence from research is not always utilised in practice. This study used the Promoting Action on Research Implementation in Health Services (PARIHS) framework as its theoretical underpinning to test whether two different approaches to facilitating implementation could affect the use of research evidence in practice. Methods:A pragmatic clustered randomised controlled trial with embedded process and economic evaluation was used. The study took place in four European countries across 24 long-term nursing care sites, for people aged 60 years or more with documented urinary incontinence. In each country, sites were randomly allocated to standard dissemination, or one of two different types of facilitation. The primary outcome was the documented percentage compliance with the continence recommendations, assessed at baseline, then at 6, 12, 18, and 24 months after the intervention.
Data were analysed using STATA15, multi-level mixed-effects linear regression models were fitted to scores for compliance with the continence recommendations, adjusting for clustering.
Results:Quantitative data were obtained from reviews of 2313 records. There were no significant differences in the primary outcome (documented compliance with continence recommendations) between study arms and all study arms improved over time.
(Continued on next page)
* Correspondence:[email protected]
The articles related to this article are available online athttps://doi.org/ 10.1186/s13012-018-0811-0andhttps://doi.org/10.1186/s13012-018-0812-z. 1Warwick Research in Nursing, Warwick Medical School, University of
Warwick, Coventry, UK
Full list of author information is available at the end of the article
(Continued from previous page)
Conclusions:This was the first cross European randomised controlled trial with embedded process evaluation that sought to test different methods of facilitation. There were no statistically significant differences in compliance with continence recommendations between the groups. It was not possible to identify whether different types and“doses” of facilitation were influential within very diverse contextual conditions. The process evaluation (Rycroft-Malone et al., Implementation Science. doi: 10.1186/s13012-018-0811-0) revealed the models of facilitation used were limited in their ability to overcome the influence of contextual factors.
Trial registration:Current Controlled TrialsISRCTN11598502. Date 4/2/10.
The research leading to these results has received funding from the European Union’s Seventh Framework Programme (FP7/2007–2013) under grant agreement no. 223646.
Keywords:Facilitation, Implementation, PARIHS, Urinary incontinence, Context, Older people, RCT
Background
It is important that health care practice is underpinned by high quality research evidence, so that the best possible care can be delivered. However, evidence from research is not always utilised in practice [1–3]. This study used the Promoting Action on Research Implementation in Health Services (PARIHS) framework [4] as its theoretical under-pinning to test whether two different approaches to facili-tation could affect the use of research evidence in practice. The PARIHS framework was built upon an argu-ment that three factors influence the uptake of research evidence in practice: the nature (strength) of the evidence, the context in which it is used, and the extent of facilita-tion (or help) that people have to use the evidence. The published protocol for this study [5] and an online sum-mary report for the funder [6] contain further details.
Consistent with recent calls for an increase in theory-based implementation research [7], we used the PARIHS framework and identified two alternative types of facilita-tion to evaluate within the FIRE study. We chose to evalu-ate facilitation because whilst it is a promising approach to implementation, it has received relatively little attention and the limited results available of its effectiveness were mixed. [8–10] Facilitation has been described as a process and a role [11]. More recently it has been argued [12]
“conceptual ambiguities” challenge our understanding of facilitation’s effectiveness and we do not know how to“ ap-propriately set the degree of facilitation”. It is clear from the literature that the role and effectiveness of facilitation in implementing evidence into practice needs to be ex-plored and tested. This study was novel in scale with a cross-country setting, and in that it sought to compare fa-cilitation approaches that varied in terms of focus, dur-ation and intensity.
Urinary incontinence in long-term care settings is a major issue and was thus selected as an exemplar for evaluating different approaches to implementing evidence into practice. Incontinence is a“discrediting and stigma-tising” condition that affects quality of life [13]. It has a high prevalence in long-term care settings, between 40
and 70% [14], and it is a key priority within international health policy [15]. The relevance and fit of the PARIHS framework in long-term care settings for older people [16] highlighted that the factors discussed as important for change in their setting showed a good fit with those iden-tified in the PARIHS framework, and recommended its use in these settings. We designed the FIRE trial to test two different approaches to facilitation and compare these against standard dissemination of recommendations for continence promotion [5].
Aims
We aimed to extend knowledge of facilitation as a process for getting research evidence into practice by testing the effectiveness of and evaluating the contribu-tion two different models of facilitacontribu-tion can make to implementing evidence-based urinary continence recom-mendations into practice.
The objectives of the study were to
1) Extend existing knowledge of facilitation as a process for translating research evidence into practice.
2) Evaluate the feasibility and effectiveness of two dif-ferent models of facilitation in promoting the uptake of research-based recommendations on continence promo-tion, compared with standard dissemination.
3) Advance existing knowledge of guideline implemen-tation in healthcare, with a particular focus on under-standing the impact of contextual factors on the processes and outcomes of implementation.
4) Implement a pro-active dissemination strategy that complements the design of the study and facilitates the diffusion of the study findings to a wide policy and prac-tice community throughout Europe and beyond. This objective is not considered further in this paper.
Methods Design
The process evaluation is reported in a linked paper (Rycroft-Malone et al. [17]).
Participants
Staff: an internal facilitator (a member of staff from the long-term care setting) nominated in each intervention site to work with external facilitators (EFs) to implement the urinary incontinence (UI) recommendations.
Residents: aged 60 years or more with documented urinary incontinence.
Setting
The study took place in four European countries (Eng-land, Sweden, Netherlands, Republic of Ireland), and each country planned to recruit six long-term nursing care sites (nursing homes and other residential settings with long term nursing care) (total 24 sites) for people aged 60 years or more with documented urinary incon-tinence. All settings had publicly funded places.
The intervention
In arm one, the eight settings randomised to the standard dissemination control group had the urinary continence recommendations and a PowerPoint presentation on im-plementation (based on one utilised by Rycroft-Malone et al. [18]) sent to the head of each site. Both the interven-tion groups also received the same as the standard dissem-ination sites.
In addition, EFs prepared two different facilitator de-velopment programmes, each of which involved an ini-tial residenini-tial programme, followed by virtual support (monthly telephone group supervision and email com-munication) for the internal facilitators (IFs) in imple-menting the UI recommendations. Arm two received a type of facilitation that we termed ‘type A’, which is a goal-focused approach to facilitation based on principles of quality improvement, management studies and organ-isational learning. This involved a 12 month programme for IFs nominated by each of the eight sites in this arm. This started with the IFs taking part in a 3-day residen-tial programme run by two EFs (GH and AK), followed by 10 days over 12 months to work locally on the imple-mentation and evaluation of recommendations, sup-ported by 12 half-days for monthly teleconferences and self-directed study (16 days in total).
Arm three received a type of facilitation that we termed ‘type B’, which is underpinned by principles of stakeholder empowerment and overcoming external and internal obstacles to using research evidence in practice. This is achieved through the creation of workplace cul-tures of effectiveness in which work-based learning as inquiry is valued and supported at all levels of the organ-isation. This approach is informed by critical social the-ory and holistic facilitation. IFs nominated by each of
the eight settings participated in a 24-month develop-ment programme. This started with a 5-day residential programme run by two EFs (BMcC and AT) followed by 20 days to work on the local implementation and evalu-ation of the recommendevalu-ations, supported by 24 half-day learning groups via teleconferencing, and 12 half-days for self-directed study (38 days in total). The EFs each
have over 20 years’ experience of facilitation.
Add-itional file1: File S1 contains more details on the under-pinning theories and activities in each intervention.
A model of co-facilitation was used in both facilitation arms where a second staff member in the organisation, a
“buddy”, worked with the IF, using this as a development opportunity, including taking the lead if the initial facili-tator was unable to continue.
Outcomes measures
The primary outcome was the documented percentage compliance with continence recommendations produced by the fourth International Consultation on Incontin-ence [19]. Percentage compliance is calculated for each resident, so it is measured at the resident level.
These recommendations included (1) the resident should be actively screened for incontinence (five com-ponents), (2) a detailed assessment should be carried out (15 components), (3) an individualised treatment plan should be in place (13 components) and (4) a specialist referral should be made if needed (one component). These outcomes were assessed at baseline, then at 6, 12, 18 and 24 months. Additional file 2: File S2 lists all com-ponents of the continence recommendations.
Secondary outcomes
Included the documented incidence of level of cognitive impairment (as this influences the type of continence care the guidance recommends), depression, incontinence-related dermatitis, urinary tract infections (UTIs),
health-related quality of life (EQ-5D [20] and IQoL
[21]) and the proportion of residents in the setting with incontinence and use of pelvic floor exercises. Organisa-tional context was assessed using the Alberta Context Tool (ACT) [22, 23]. The ACT data was collected from Nurses, Licenced Practical Nurses (LPN) and Health Care Assistants (HCA) at baseline in 23 of the 24 sites.
Sample size and power calculations
tests carried out at the 5% level, for a cluster size of 50, seven clusters (long term care settings) were required per intervention arm. Thus 7 × 3 arms = 21 clusters were needed. Allowing for potential attrition, this was in-creased to 8 clusters per arm, so 24 clusters in total. This equates to 6 long-term nursing care settings in each of the four countries with 50 or more residents per set-ting. Consent was sought at cluster and at individual level, the former before randomisation and the latter after randomisation.
Randomisation sequence generation, allocation concealment, implementation and blinding
In each country, sites were randomly allocated to one of three arms (standard dissemination, and two different intensities and kinds of a facilitation intervention), using a random sequence generated by the statistician. A cen-tralised randomisation point was set up by the study statistician to ensure allocation concealment. Long-term care settings were enrolled by country leads for the study. The statistician was blinded to the intervention group. It was not possible to blind site staff to interven-tion. Research fellows who collected data from records and where necessary obtained consent from residents were blinded to the intervention group, but as discussed in the protocol [5], previous experience suggested this blinding may be inadvertently broken by the sites.
Quantitative analysis—statistical methods
Data were analysed using STATA15. The primary out-come measures, percentage compliance, were analysed by fitting multi-level mixed-effects linear regression models with standard errors adjusted for the clustering at the level of the nursing care setting (site level) [25]. Data was col-lected every 6 months, but because the resident popula-tion was constantly changing it is necessary to consider the data as repeated cross-sectional assessments of resi-dents in the care settings rather than longitudinal assess-ment of individuals within the care settings. The regression models include three independent variables: study arm (three levels), country (four levels), time period (five levels baseline, 6 months, 12 months, 18 months, 24 months), interaction terms would only be fitted if study arm main effects were significant. Intra-cluster correlation coefficients (ICC) for the baseline measurements of the compliance scores were calculated through ANOVA with adjustment for clustering and unequal cluster size. Post-estimation ICCs are calculated after fitting the re-gression models. Descriptive statistics, ANOVA and chi-square tests were used, where appropriate, to examine differences between groups with regard to secondary out-comes. Data were examined by an independent data mon-itoring committee.
Qualitative analysis
The process evaluation data were analysed from a realist perspective [26] and are reported in the linked paper (Rycroft-Malone et al. [17]).
Findings
In each country, we planned to recruit six sites (two sites per arm). This happened for Sweden and the Netherlands. However, one site in England withdrew before the study started. When no additional site was forthcoming in Eng-land within the timeframe, an additional control site was recruited in Republic of Ireland and ethical clearance ob-tained. This final site had data collected up to month 18 only as there was not time to collect data at 24 months. There were thus five sites in England (with one site in the control arm) and seven in the Republic of Ireland (three sites in the control arm). Each cluster (site) received the allocated intervention and were analysed for primary and secondary outcomes.
Quantitative data were available from 2313 resident
records across all time points (n = 430 at baseline,
n = 462 at 6 months, n = 497 at 12 months, n = 479
at 18 months and n = 445 at 24 months after the
intervention). The sample is described and then the primary outcome, compliance with the four contin-ence recommendations is presented. The study took place between 2010 and 2013.
Description of resident sample
Most residents were included at one time point only. In all four countries, at baseline the mean age of residents varied from 82 to 87 years. This was almost unchanged at 24 months later (range 82–86 years). In all four coun-tries, there were more female than male residents at baseline (the percentage female in each site ranged from 60 to 71%), and this was similar at 24 months (range 54–80% females). At baseline, the mean age of residents allocated to the three intervention groups was very simi-lar (control 85.34 years (s.d. 7.39); type A 86.35 years (s.d. 7.19); type B 83.20 years (s.d. 8.48)). The gender mix was also similar for the three intervention groups (control 68.8% female; type A 62.2% female; type B 73.8%).
To understand the health status of the residents, data from the EQ-5D visual analogue scale (VAS) measure of health state that we administered at 24 months provides summary information for each intervention group
(Table 1). Data at 24 months are chosen because
Not all residents were able to complete or have a proxy complete an EQ-5D so numbers completed are lower than total number of residents.
Primary outcomes—compliance with the four continence recommendations
(Full details of all the components of each of the four
continence recommendations are available in the
Additional file1: File S1). The ICC for percentage compli-ance with recommendations has been calculated from the baseline data, making allowance for both the clustering and the unequal numbers from the 24 long-term care set-tings. The ICC for percentage compliance with recom-mendation 1 is 0.545 (95% CI 0.361, 0.730); for percentage compliance with recommendation 2, the ICC is 0.404 (95% CI 0.220, 0.587), and for percentage compliance with recommendation 3, ICC was 0.455 (95% CI 0.270, 0.641). These ICCs are much higher than expected and those usually found in Primary Health Care studies of 0.01 [24], they are more similar to those found in some educational cluster trials [27].
The results reported in Tables2,4 and6 are from fit-ting multi-level mixed-effect linear regressions models to the compliance scores for each of the recommenda-tions 1, 2 and 3 respectively. These models account for the cluster design by treating site as a random effect and adjusting the standard error for the 24 site clusters. The model includes three independent variables: study arm (three levels—control, type A and type B), country (four
levels—Netherlands, Sweden, Republic of Ireland and
England), time period (five levels—baseline, 6 months, 12 months, 18 months and 24 months). The first level
for each variable (control arm for intervention,
Netherlands for country and baseline for time) are taken as the base level and other levels are compared to this. In this model, we are considering the effect of interven-tion allowing for country and time. The assumpinterven-tions of linear regression were examined, and there was no evi-dence that the data failed to meet these assumptions. As a sensitivity analysis, the linear regression models were also fitted omitting the country covariate, and this did
not change any of the findings with regard to the signifi-cance of the intervention effect.
Compliance with recommendation 1: The resident should be actively screened for urinary incontinence
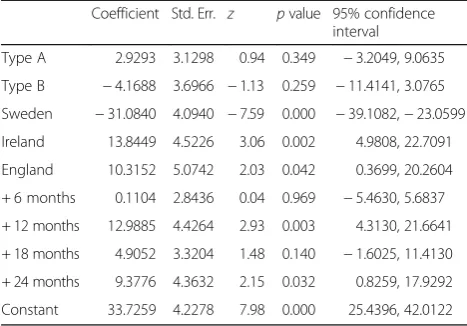
Compliance with recommendation 1 can range from 0 to 5 depending on which of five potential components of this recommendation are documented. For each component documented, one point is scored, percentage compliance is a score out of 5 as a percentage. Table 2 reports the model for compliance with recommendation 1 and shows outcome scores in the intervention arms did not reach statistical significance. Country is significant with Sweden
having poorer compliance (a negative coefficient)
compared to the Netherlands. Ireland and England had significantly better compliance than the Netherlands (positive coefficients). The 12- and 24-month data collec-tion parameters were significant, but the other points were not significantly different to baseline. The post-estimation ICC following the fitting of this model for compliance with recommendation 1 is 0.091. Table3shows the mean percentage for each intervention group at each time point, showing the small increase in percentage compliance score for type A and type B intervention up to 12 months, though as the regression model indicates there is no sig-nificant difference in the study arms over the duration of the study.
Compliance with recommendation 2: A detailed assessment should be carried out
[image:5.595.57.291.109.192.2]There are 15 items in the detailed assessment, so scores can range from 0 to 15 for recommendation 2. Percent-age compliance is a score out of 15 as a percentPercent-age. Table 1Summary statistics for EQ-5D-VAS scale for each
intervention group
Intervention Number of residents with completed scale
Mean (SE robust)a
95% CI for mean
Range
Standard dissemination (control)
109 54.2 (4.737) 44.35, 64.00 0, 100
Type A 113 59.2 (4.325) 50.19, 68.13 0, 100
Type B 124 55.6 (2.918) 49.57, 61.67 0, 90
a
SE robust allows for the clustering, and ANOVA allowing for clustering to compare the three means, gavep= 0.34
Table 2Multi-level mixed-effect linear regression
model—percentage compliance with recommendation 1 (the resident should be actively screened for urinary incontinence), with adjustment of standard errors to allow for clustering
Coefficient Std. Err. z pvalue 95% confidence interval
Type A 2.9293 3.1298 0.94 0.349 −3.2049, 9.0635
Type B −4.1688 3.6966 −1.13 0.259 −11.4141, 3.0765
Sweden −31.0840 4.0940 −7.59 0.000 −39.1082,−23.0599
Ireland 13.8449 4.5226 3.06 0.002 4.9808, 22.7091
England 10.3152 5.0742 2.03 0.042 0.3699, 20.2604
+ 6 months 0.1104 2.8436 0.04 0.969 −5.4630, 5.6837
+ 12 months 12.9885 4.4264 2.93 0.003 4.3130, 21.6641
+ 18 months 4.9052 3.3204 1.48 0.140 −1.6025, 11.4130
+ 24 months 9.3776 4.3632 2.15 0.032 0.8259, 17.9292
Constant 33.7259 4.2278 7.98 0.000 25.4396, 42.0122
N= 2313; model fit: Waldχ2(9)=1970.23,p< 0.001; post-estimation ICC 0.0910
[image:5.595.304.538.132.295.2]Table 4 reports the fitted model for compliance with recommendation 2. The intervention is not effective; nei-ther the type A facilitation or type B facilitation interven-tions had significant coefficients. Ireland was significantly different having higher compliance with recommendation 2, but the coefficients for the other countries were not sig-nificant, so England and Sweden are not significantly dif-ferent to the Netherlands after allowing for time point and intervention group. The 24-month data collection
param-eter is significant, with increased compliance by
24 months, but the other points are not significantly dif-ferent to baseline. The post-estimation ICC following the fitting of this model for compliance with recommendation
2 is 0.351. Table 5 shows mean percentage compliance
score for recommendation 2 by intervention group. Mean percentage compliance was low at baseline, in all groups, but improved by 24 months in the type A and type B intervention groups.
Compliance with recommendation 3: An individualised treatment plan should be in place
A score from 0 to 13 is possible for compliance with rec-ommendation 3. Percentage compliance is a score out of 13 as a percentage.
Table 6 reports the fitted model for compliance with
recommendation 3. The intervention was not effective, neither the type A facilitation or type B facilitation interventions had significant coefficients. All country pa-rameters were significant with Sweden, Ireland and England all having significantly higher compliance with recommendation 3 than the Netherlands. All time points were significant, and the parameter value increased for each successive time period, thus suggesting improvement over time in compliance with recommendation 3. This suggests learning over time in all countries, but no signifi-cant difference in the effectiveness of the three study in-terventions. The post-estimation ICC following the fitting of this model for compliance with recommendation 3 is 0.126. Table7shows mean percentage compliance for rec-ommendation 3 by intervention group. It can be seen that all three groups appear to improve over time, with little difference between the interventions as indicated by the regression model.
Recommendation 4: Specialist referral should be made if necessary
There were very few specialist referrals made and in the data collection it was not always clear whether a lack of documentation meant no referral was made or whether a referral was not necessary. It is therefore difficult to fully assess compliance with this guideline. However, the level of referral was so low that it is very unlikely that study arm has a significant impact on compliance with this recommendation. In only 4% of residents was a ferral recommended. Although these referrals were re-corded as specialist referrals, 17 were to a general practitioner (family doctor) and 6 to an unknown cialist. There were only 11 referrals to a continence spe-cialist nurse and 6 referrals to urology.
In summary, for the primary outcome (documented compliance score or percentage compliance with contin-ence recommendations), there was no significant differ-ence between study arms; all study arms improved over time in all countries.
Secondary (clinical) outcomes
[image:6.595.56.291.109.179.2]These data are being considered as two cross-sectional reviews of the resident populations in the long-term care Table 3Mean percentage compliance with recommendation 1
by intervention group for each time point Intervention
group
Mean score
Baseline 6 months 12 months 18 months 24 months
Control 28.4 22.3 29.2 27.0 23.2
Type A 19.2 21.5 38.8 30.6 35.5
Type B 14.1 17.0 44.4 23.4 28.7
[image:6.595.305.539.111.179.2]N= 2313 residents are included in this analysis
Table 4Multi-level mixed-effect linear regression model—percentage compliance with recommendation 2 (a detailed assessment should be carried out), with adjustment of standard errors to allow for clustering
Coefficient Std. Err. z pvalue 95% confidence interval
Type A 5.6514 4.0014 1.41 0.158 −2.1912, 13.4941
Type B 3.7903 4.4807 0.85 0.398 −4.9917, 12.5724
Sweden −1.9108 2.7374 −0.70 0.485 −7.2760, 3.4545
Ireland 14.9312 3.6627 4.08 0.000 7.7524, 22.1099
England 11.7997 7.0278 1.68 0.093 −1.9745, 25.5738
+ 6 months −0.2220 1.2763 −0.17 0.862 −2.7235, 2.2794
+ 12 months 3.3623 2.1118 1.59 0.111 −0.7767, 7.5014
+ 18 months −0.0031 1.6463 −0.00 0.998 −3.2298, 3.2235
+ 24 months 4.4827 2.1665 2.07 0.039 0.2364, 8.7290
Constant 30.1617 3.3204 9.08 0.000 23.6538, 36.6696
N= 2313; model fit: Waldχ2(9) = 64.76,p< 0.001; post-estimation ICC 0.3517 (se 0.0758)
Table 5Mean percentage compliance with recommendation 2 by intervention group for each time point
Intervention group
Mean score
Baseline 6 months 12 months 18 months 24 months
Control 37.5 34.6 36.5 34.1 34.4
Type A 34.6 35.1 45.1 39.7 44.6
Type B 35.3 34.8 43.2 38.2 45.9
[image:6.595.56.291.552.714.2]settings as there are very few individual residents in-cluded at both baseline and 24 months data collection. At 24 months, there was no significant difference between the three intervention groups with regard to the proportion of residents who had no documented record of the assessment of cognition (p= 0.076 from chi-square test). At 24 months, there was a significant difference between the three intervention groups with regard to the proportion of residents who had no documented record of the level of cognitive impairment (p< 0.001 from chi-squared test), the proportion being higher in the control group than in the type A and type B groups. At 24 months, there was a significant differ-ence between the three intervention groups with regard to the proportion of residents who had no documented record of the assessment of depression (p= 0.017 from chi-squared test), the proportion being higher in the control group than in the type A and type B groups. At 24 months, there was no significant difference between the three intervention groups with regard to the propor-tion of residents who had no documented record of the assessment of incontinence-related dermatitis (p= 0.479 from chi-square test).
Between baseline and 24 months, there was a statisti-cally significant decrease in the proportion of residents who had no documented record of an assessment of cognition in type B facilitation (p< 0.001) but no signifi-cant change for type A; there was a signifisignifi-cant decrease in the proportion of residents who have no documented record of the level of cognitive impairment in interven-tion type A (p< 0.001) and type B (p< 0.001); there was a significant reduction in the percentage of residents who had no documentation of assessment of depression in the type A (p< 0.001) and type B (p< 0.001) groups. There was a significant decrease in the percentage of residents who had no documentation of incontinence-associated dermatitis between baseline and 24 months in the type A (p< 0.001) and type B (p< 001) groups. There was no significant improvement in the control group for any of the secondary outcomes.
Whether the impact of urinary incontinence on quality of life been assessed was not documented for the majority of residents. It was not assessed more than seven times in any group, so this was not ex-plored further. Very few UTIs were documented. In the month prior to the baseline data collection, only 15 UTIs were recorded in all countries, decreasing to only seven at the 24 month data collection point. No further analysis was done.
It was not possible to reliably calculate the propor-tion of residents in each long-term care setting with incontinence, thus no further analysis was done. At baseline, pelvic floor exercises were not used with any residents, and at 24 month follow up pelvic, floor exercises were only used with three residents. With such low numbers, no further exploration of this is sensible.
In summary, for secondary outcomes, both the facilita-tion intervenfacilita-tion groups (type A and type B) showed significantly better documentation of three outcomes: the level of cognitive impairment, depression and incontinence-associated dermatitis between baseline and 24 months, and this improvement did not occur in the standard dissemination (control) group. Clinically, this change was not large, and a substantial proportion of residents still had no documented assessment of level of cognitive impairment (68% in type A and 65% in type B) depression (61% in type A and 65% in type B) and incontinence-associated dermatitis (66% in type A and 73% in type B).
There was a large amount of missing data on the Urinary Incontinence Quality of Life (I-QoL) outcome
measure [21] as residents found it too much to
[image:7.595.56.291.132.295.2]complete, so this is not reported further. It had been planned to report length of stay data, but it was not possible to collect this data consistently across all sites, so it is not reported further.
Table 6Multi-level mixed-effect linear regression model—percentage compliance with recommendation 3 (an individualised treatment plan should be in place), with adjustment of standard errors to allow for clustering
Coefficient Std. Err. z pvalue 95% confidence interval
Type A 0.3391 4.0168 0.08 0.933 −7.5336, 8.2118
Type B 1.0372 3.0579 0.34 0.734 −4.9562, 7.0305
Sweden 23.7959 1.9736 12.06 0.000 19.9278, 27.6640
Ireland 24.5448 3.9162 6.27 0.000 16.8692, 32.2204
England 15.3118 3.8489 3.98 0.000 7.7681, 22.8555
+ 6 months 9.8431 4.1862 2.35 0.019 1.6382, 18.0479
+ 12 months 14.2761 3.7488 3.81 0.000 6.9285, 21.6237
+ 18 months 15.9399 3.7804 4.22 0.000 8.5305, 23.3494
+ 24 months 19.9791 3.3984 5.88 0.000 13.3183, 26.6399
Constant 6.5831 3.0927 2.13 0.033 0.5216, 12.6446
N= 2313; model fit: Waldχ2(9)=387.72,p< 0.001; post-estimation ICC 0.1265
(se 0.0502)
Table 7Mean percentage compliance with recommendation 3 by intervention group for each time point
Intervention group
Mean score
Baseline 6 months 12 months 18 months 24 months
Control 20.9 30.8 40.9 45.0 48.9
Type A 23.8 32.2 41.9 42.7 45.2
Type B 26.7 38.6 40.7 41.1 45.9
[image:7.595.56.292.655.725.2]Health economics
Health economic analysis was undertaken, but since there was no significant difference in the primary outcome between the intervention groups, these data are not presented here in detail because the cost ana-lysis showed that, as expected, standard dissemination would be the least costly intervention to implement. (see Additional file1: File S3 for intervention cost tables).
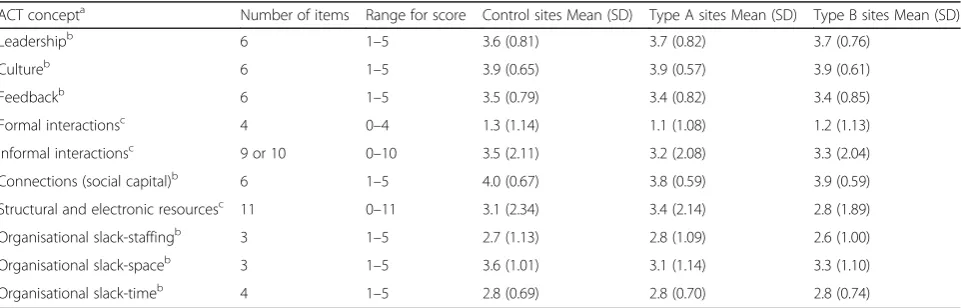
Alberta Context Tool
For all concepts, higher scores represent a better work context. All responses for a site (Nurse, LPN, HCA) were considered together to provide an overall picture of the site. The questionnaire completed by Nurses, LPN’s and HCAs were identical except with regard to informal interactions in which the HCA group had one less tion (9) than the other groups of staff who had 10 ques-tions in this section.
Table8shows for each concept the mean score given by all staff rating a site within the intervention arm. Formal interactions are notably lower than other scores. The lar-gest differences are for structural and electronic resources and for organisational slack-space. On the basis of the similarity of these mean scores, we conclude the study groups were similar with regard to ACT concepts.
Discussion
The 12 months type A and the 24 months type B facilita-tion intervenfacilita-tions did not have different levels of impact on documented compliance with recommendations. It was thus not possible to identify the type and“dose”of fa-cilitation that worked best within the highly varied con-textual conditions identified in this study. In addition, the process evaluation revealed important issues about the models of facilitation used and the characteristics of the facilitators [17,28].
So why was it that the facilitation intervention did not make a statistically significant difference to the docu-mented implementation of continence recommendations? Was an element of the PARIHS framework, facilitation, purported to be necessary for getting research evidence used in practice, actually not so important? Other research has found some type of help with getting research imple-mented does make a difference [29,30]. Baskerville et al.’s [31] systematic review of practice facilitation in primary care suggests facilitation improves uptake of clinical prac-tice guidelines by nearly three times. A facilitation inter-vention was found to reduce neonatal mortality by 50% [32]. Although the facilitation not working in this study is a possible explanation and the high ICCs meant the study was underpowered, the process evaluation qualitative re-search evidence [17] suggested this was not the most likely explanation. It may be facilitation works differently along the continuum of context. It could be that using only doc-umented evidence of compliance with the recommenda-tions under-estimated what might have happened in practice but was not documented. A lack of intervention fidelity is another possible explanation [17].
Although the intervention groups improved, it was not possible to say the improvement was due to the inter-vention as the control group also improved. We do not know why this was, but it could be that for control sites, being in the study, including six monthly follow-ups for 2 years, was enough of an incentive to improve. How-ever, the qualitative data suggests for most control sites they did not use the written recommendations or the implementation guide. One site mentioned to the re-searcher that they checked their documentation and practice knowing the researcher would be visiting, and thus even collecting follow-up data in the control group can be seen as having an effect.
[image:8.595.58.539.552.706.2]Etheridge et al. [33] concluded that four active ingredi-ents were required to effect change in long-term care
Table 8Mean scores on ACT concepts by intervention group at baseline (N= 725 staff are included in this analysis)
ACT concepta Number of items Range for score Control sites Mean (SD) Type A sites Mean (SD) Type B sites Mean (SD)
Leadershipb 6 1–5 3.6 (0.81) 3.7 (0.82) 3.7 (0.76)
Cultureb 6 1–5 3.9 (0.65) 3.9 (0.57) 3.9 (0.61)
Feedbackb 6 1–5 3.5 (0.79) 3.4 (0.82) 3.4 (0.85)
Formal interactionsc 4 0–4 1.3 (1.14) 1.1 (1.08) 1.2 (1.13)
Informal interactionsc 9 or 10 0–10 3.5 (2.11) 3.2 (2.08) 3.3 (2.04)
Connections (social capital)b 6 1–5 4.0 (0.67) 3.8 (0.59) 3.9 (0.59)
Structural and electronic resourcesc 11 0–11 3.1 (2.34) 3.4 (2.14) 2.8 (1.89)
Organisational slack-staffingb 3 1–5 2.7 (1.13) 2.8 (1.09) 2.6 (1.00)
Organisational slack-spaceb 3 1–5 3.6 (1.01) 3.1 (1.14) 3.3 (1.10)
Organisational slack-timeb 4 1–5 2.8 (0.69) 2.8 (0.70) 2.8 (0.74)
a
Definitions of ACT concepts and scaling are provided [21, 22], and relevant papers are listed athttps://trecresearch.ca/alberta_context_tool b
Scaled
c
settings: urgency, solidarity, intensity and accumulation. The continence programme they reviewed failed, and one of the reasons they identified may also apply in our study: there was no buy-in from participants. Although all sites agreed to take part in the study, the topic area and the intervention were already decided. In addition, participants changed during the study, so, for example, as managers changed, new managers did not necessarily see this study as a priority, thus reducing even further the extent of organisational buy-in and support [17].
The proposition that underpins the PARIHS frame-work is that successful implementation is a function of the nature of the evidence being implemented, the context into which it is being implemented and ap-propriate facilitation to help people implement the evidence. There was no weighting given to these three aspects of evidence, context and facilitation. This re-search suggested that facilitation with one or two people in a team may not easily overcome contextual factors. The level of experience and expertise of the IF, and relationship of the IF to managers in the
set-ting, may be more important [34] as may unravelling
how facilitation and context interact.
It was not possible to identify a “good enough” model of facilitation that affected the primary outcome (docu-mented compliance with continence recommendations) and could address the different contexts. Facilitation did however result in some identifiable practice changes (e.g. new assessment processes, new forms and awareness of the impact of incontinence on residents).
It may be that in practice, tailoring the type of facilita-tion to both the setting and the internal facilitator is im-portant. Just how one could map the contextual characteristics to a type of facilitation and to type of in-ternal facilitator would need further evaluation. Van der Zijpp et al. [34], part of this study, argued the interac-tions between managerial leaders and IFs were import-ant, summarised by three themes: realising commitment, negotiating conditions and encouraging to keep the mo-mentum going. The reciprocal relationships between managers and IFs influenced the process of implementa-tion, and future interventions should target managers in a focused way. In studies that evaluate implementation of complex interventions such as facilitation, it may be appropriate to adopt a theoretical perspective on fidelity, focusing on the intended mechanisms of the interven-tion. For example, in this study, the theory of type A fa-cilitation required IFs to develop skills and confidence in audit and feedback. Achieving this mechanism, even if it meant IFs needed varying levels of external facilitation, would demonstrate theoretical fidelity. This type of ap-proach has been proposed in public health [35] and is discussed in the linked papers (Rycroft-Malone et al. [17], Harvey et al. [28]).
ACT considers organisational concepts as a unit-based score. In this study, these were considered as site level variables. Mean baseline and follow-up mean scores were compared with either an ANOVA where multiple time points were available or with a t-test when only one follow-up time point was available. There were very few changes that were significant. We are thus not confident to make any claims about the effects of the intervention on organisational culture as assessed with ACT. Possible explanations for this include the organisations were stable and at site level the concepts were unaffected by the interventions.
Limitations
In reality, the planned interventions did not always work as originally envisaged, as revealed by the process evalu-ation [17] and our analysis of the facilitation interven-tion [28]. This was for several reasons, relating to initial selection and preparation of the IFs; engagement in the facilitation intervention; ability to progress according to plan. The linked papers illustrate the issues that compro-mised the fidelity of the intervention [17,28]. It was also challenging to recruit resident participants in some homes, so we had fewer than planned. In addition, al-though each of the long-term settings had agreed to take part, for individual staff within the home it was not ne-cessarily a priority. The unexpectedly high ICC meant the study was underpowered. Although we felt the ICC we used in the sample size calculation was reasonable, in planning future cluster RCTs with a more educational focus, it is important to be aware that not all ICCs will be as low as those reported for recent primary care trials [24]. In the design of the study, it was assumed that there would not be large country differences regarding compliance with the recommendations; hence, it would be viable to have a small number of sites from each country in each study arm. In practice, it appears the countries are behaving differently, but the study was not powered to investigate within country effect of the dif-ferent interventions on the primary outcome.
Conclusions
Pressman and Wildavsky [36] a long time ago reported that
“the study of implementation requires understanding that apparently simple sequences of events depend on complex chains of reciprocal interaction”(pxvii) and referred to the complexities of implementation as“the lumpy stuff of life” [37] (p165). This study supports those assertions.
of facilitation were broadly viable but were not signifi-cantly better than a control in improving documented compliance with recommendations to promote contin-ence. Contextual issues were not always overcome by the approaches to facilitation adopted in this study as our linked papers demonstrate (Rycroft-Malone et al., Harvey et al. [17,28]).
Additional file
Additional file 1:File S1 Underpinning theories and activities of type A and type B facilitation. File S2 List of all components of the continence recommendations. File S3 FIRE programme costs. File S4 Study Flow Diagram, Consort Checklist and Tidier checklist. (DOCX 71 kb)
Abbreviations
EF:External facilitator; FIRE: Facilitating Implementation of Research Evidence; IF: Internal facilitator; PARIHS: Promoting Action on Research Implementation in Health Services; UI: Urinary incontinence; UTI: Urinary tract infection
Acknowledgements
Thank you to all those who were involved in this study as participants or who advised us on the study.
Funding
The research leading to these results has received funding from the European Union’s Seventh Framework Programme (FP7/2007–2013) under grant agreement no. 223646.
Availability of data and materials
The datasets generated or analysed during the current study are not publicly available because consent to make data publicly available was not part of the consent by participants.
Authors’contributions
All authors read and approved the final manuscript. KS (principal investigator) led the application for funding. She contributed to the overall design of the study, designed the cluster RCT aspect of the study, and contributed to the analysis. She led the writing of this paper. JRM (collaborator) participated in designing the study. She led the design of the evaluation package and was country co-ordinator for England. She wrote the process evaluation aspects of this paper and reviewed the manuscript critically for important intellectual content. KC (collaborator) participated in designing the study and reviewed the manuscript critically for important intellectual content. She was country co-ordinator for the Netherlands. NC (statistician) advised on study design, contributed to the analysis plan and undertook the analysis within the cluster RCT, and reviewed the manuscript critically for important intellectual content. RTE and CJ (health economists) were responsible for the economic evaluation study design and reviewed the manuscript critically for important intellectual content. ACE (research fellow) participated in the design and analysis of the evaluation package, collected data in Sweden, contributed to the analysis and reviewed the manuscript critically for important intellectual content. CAE (collaborator) participated in study design and coordinated the use of the Alberta Context Tool including its translation into Swedish and Dutch. She reviewed the manuscript critically for important intellectual content. CH (research fellow) participated in the design of the process evaluation and associated data collection tools, the development of the economic evaluation, and was responsible for the day to day running of the process evaluation,
contributed to the data collection in England and the analysis and reviewed the manuscript critically for important intellectual content. GH (collaborator) participated in the design of the overall study and in the design of the facilitator intervention in particular. She co-led type A facilitation work package and reviewed the manuscript critically for important intellectual content. AK (collaborator) participated in the design of the overall study and in the design of the facilitator intervention in particular. She co-led type A facilitation work package and reviewed the manuscript critically for important intellectual content. BMcC (collaborator) participated in the design of the overall study
and in the design of the facilitation intervention in particular. He co-led type B facilitation work package and reviewed the manuscript critically for important intellectual content. He was also country coordinator for Ireland. CM (research fellow) participated in the design of the RCT and associated data collection tools, participated in the collection of data in England, contributed to the analysis and reviewed the manuscript critically for important intellectual content. AT (collaborator) participated in the design of the overall study, especially the Type B facilitation intervention. She co-led type B facilitation work package and reviewed the manuscript critically for important intellectual content. PS and CMcC (research fellows) participated in the collection of data in Republic of Ireland, contributed to the analysis and reviewed the manuscript critically for important intellectual content. TN and TvdZ (research fellows) participated in the collection of data in Netherlands, contributed to the analysis and reviewed the manuscript critically for important intellectual content. LW (collaborator) participated in the design of the overall study and in the design of the intervention evaluation in particular. He reviewed the manuscript critically for important intellectual content and was Country Coordinator for Sweden.
Ethics approval and consent to participate
Ethical Committee approval was obtained in England (10/WSE04/20), Sweden (2009/1806-31/2) and Republic of Ireland (ECM4(u)02/03/10). In the Netherlands, the researchers followed advice to get permission from either an ethical committee at site level, or where this did not exist, from a scientific or residents committee at the site (HAZ-11087777-JGS). Research Governance approval was also obtained in England and permission to collect data at the sites obtained in Sweden and Republic of Ireland.
Consent for publication
Consent form allowed the use of anonymised quotations in publications.
Competing interests
We acknowledge that CE is involved in the development of the Alberta Context Tool and AK GH JRM BMcC KS and AT have all been involved in the development of the PARIHS framework.
Publisher’s Note
Springer Nature remains neutral with regard to jurisdictional claims in published maps and institutional affiliations.
Author details
1Warwick Research in Nursing, Warwick Medical School, University of
Warwick, Coventry, UK.2School of Health Care Sciences, Bangor University, Bangor, UK.3Fontys School of People and Health Studies, Fontys University of Applied Sciences, Eindhoven, The Netherlands.4School of Health and Social Care, London South Bank University, 103 Borough Road, London SE1 0AA, UK.5Centre for Health Economics and Medicines Evaluation (CHEME), Bangor University, Bangor, UK.6Faculty of Medicine and Health Science, Department of Nursing, Linkoping University, Linkoping, Sweden. 7Department of Neurobiology, Care Sciences and Society, Division of
Nursing, Karolinska Institutet, Stockholm, Sweden.8Faculty of Nursing, University of Alberta, Edmonton, Alberta, Canada.9Adelaide Nursing School, University of Adelaide, Adelaide, Australia.10Clinical Trials Unit, Warwick Medical School, University of Warwick, Coventry, UK.11College of Nursing and Health Sciences, Flinders University, Adelaide, South Australia, Australia. 12Division of Nursing, Queen Margaret University, Edinburgh, UK.13Institute
of Applied Health Research, University of Birmingham, Birmingham, UK. 14Warwick Medical School, University of Warwick, Coventry, UK.15Institute of
Nursing and Health Research, Ulster University, Shore Rd, Belfast, Northern Ireland.16School of Education, Health and Social Studies, Dalarna University, Falun, Sweden.17Department of Health and Care Sciences, The Sahlgrenska Academy, University of Gothenburg, Gothenburg, Sweden.
Received: 13 April 2018 Accepted: 22 October 2018
References
1. Grol R. Success and failures in the implementation of evidence-based guidelines for clinical practice. Med Care. 2001;39(8 Suppl 2):1146–54. 2. McGlynn EA, Asch SM, Adams J, Keesey J, Hicks J, DeCristofaro A, Kerr EA.
3. Katikreddi SV, Higgins M, Bond L, Bonnell C, Macintyre S. How evidence based is English public health policy? BMJ. 2011;343:d7310.
4. Kitson A, Rycroft-Malone J, Harvey G, McCormack B, Seers K, Titchen A. Evaluating the successful implementation of evidence into practice using the PARIHS framework: theoretical and practical challenges. Implement Sci. 2008;3:1.https://doi.org/10.1186/1748-5908-3-1.
5. Seers K, Cox K, Crichton NJ, Tudor-Edwards R, Eldh A, Estabrooks CA, Harvey G, Hawkes C, Kitson A, Linck P, McCarthy G, McCormack B, Mockford C, Rycroft-Malone J, Titchen A, Wallin L. FIRE (Facilitating Implementation of Research Evidence): a study protocol. Implement Sci. 2012;7:25.https://doi. org/10.1186/1748-5908-7-25.
6. Seers K, Cox K, Crichton NJ, Tudor-Edwards R, Eldh A, Estabrooks CA, Harvey G, Hawkes C, Kitson A, Linck P, McCarthy G, McCormack B, Mockford C, Rycroft-Malone J, Titchen A, & Wallin L. (2013) Final report summary - FIRE (Facilitating Implementation of Research Evidence).http://cordis.europa.eu/ result/rcn/149765_en.html. Accessed 3 Apr 2018.
7. Eccles MP, Armstrong D, Baker R, Cleary K, Davies H, Davies S, Glasziou P, Ilott I, Kinmonth AL, Leng G, Logan S, Michie S, Rogers H, Rycroft-Malone J, Sibbald B. An implementation research agenda. Implement Sci. 2009;4:18. https://doi.org/10.1186/1748-5908-4-18.
8. Grimshaw JM, Thomas RE, MAcLennan G, Fraser C, Ramsay CR, Vale L,
Whitty P, Eccles M, Matowe L, Shirran L, Wensing M, Dijkstra R, Donaldson C. Effectiveness and efficiency of guideline dissemination and
implementation strategies. Health Technol Assess. 2004;8:6. 9. Thompson DS, Estabrooks CA, Scott-Findlay S, Moore K, Wallin L.
Interventions aimed at increasing research use in nursing: a systematic review. Implement Sci. 2007;2:15http://www.implementationscience.com/ content/pdf/1748-5908-2-15.pdf.
10. Medves J, Godfrey C, Turner C, Paterson M, Harrison M, MacKenzie L, Durando P. Systematic review of practice guidelines dissemination and implementation strategies for healthcare teams and team-based practice. Int J Evidence Based Healthcare. 2010;8:78–89.https://doi.org/10.1136/bmj.a2390.
11. Dogherty EJ, Harrison MB, Graham ID. Facilitation as a role and process in achieving evidence-based practice in nursing: a focused review of concept and meaning. Worldviews Evidence Based Nursing. 2010;7(2):76–89. 12. Berta W, Cranley L, Dearing JW, Dogherty EJ, Squires JE, Estabrooks CA. Why
(we think) facilitation works: insights from organizational learning theory. Implement Sci. 2015;10:141.https://doi.org/10.1186/s13012-015-0323-0. 13. Brittain KR, Shaw C. The social consequences of living with and dealing
with incontinence–a carers perspective. Soc Sci Med. 2007;65:1274–83. 14. Ouslander JG, Schnelle JF. Incontinence in the nursing home. Ann Intern
Med. 1995;122(6):438–49.
15. National Guideline Clearinghouse. Guideline for Urinary Incontinence in the long term setting. American Medical Directors Association. Agency For Healthcare Research and Quality. 2012;http://www.guideline.gov/content. aspx?id=45526. Archived. https://www.ahrq.gov/professionals/clinicians-providers/guidelines-recommendations/archive.htm. Accessed 3 Apr 2018. 16. Perry L, Bellchambers H, Howie A, Moxey A, Parkinson L, Capra S, Byles J.
Examination of the utility of the Promoting Action on Research Implementation in health Services framework for implementation of evidence based practice in residential aged care settings. Journal of Advanced Nursing. 2011;67(10):2139–50.
17. Jo Rycroft-Malone; Kate Seers; Ann Catrine Eldh; Karen Cox; Nicola Crichton; Gill Harvey; Claire Hawkes; Alison Kitson; Brendan George McCormack; Christel McMullan; Carole Mockford; Theo Niessen; Paul Slater; Angie Titchen; Teatske van der Zijpp; Lars Wallin. A realist process evaluation within the Facilitating Implementation of Research Evidence (FIRE) cluster randomised controlled international trial: an exemplar. Implement Sci. https://doi.org/10.1186/s13012-018-0811-0.
18. Rycroft-Malone J, Seers K, Crichton N, Chandler J, Hawkes C, Allen C, Bullock I, Strunin L. A pragmatic randomised controlled trial evaluating three implementation interventions. Implement Sci. 2012;7:80.
19. DuBeau CE, Kuchel GA, Johnson T, Palmer MH, Wagg A. Committee 11.
Incontinence in the frail elderly. In: Abrams P, Cardozo L, Khoury S, Wein A, editors. Incontinence. 4th International Consultation on Incontinence: Health Publications Limited; 2009. pp961–1024 and pp1796–1789.http:// www.icsoffice.org/Publications/ICI_4/book.pdf. Accessed 3 Apr 2018. 20. Devlin N, Parkin D, Browne J. Using the EQ-5D as a performance
measurement tool in the NHS. Health Econ. 2010;19(8):886–905.
21. Patrick DL, Martin ML, Bushnell DM, Yalcin I, Wagner TH, Buesching DP. Quality of life with women with urinary incontinence: further development of the incontinence quality of life instrument (I-QOL). Urology. 1999;53:71–6. 22. Estabrooks CA, Squires JE, Cummings GG, Birdsell JM, Norton PG.
Development and assessment of the Alberta Context Tool. BMC Health Serv Res. 2009;9:234.https://doi.org/10.1186/1472-6963-9-234.
23. Squires JE, Hayduk L, Hutchinson AM, Mallick R, Norton PG, Cummings GG, Estabrooks CA. Reliability and validity of the Alberta Context Tool (ACT) with professional nurses: findings from a multi-study analysis. PLoS One. 2015; 10(6):e0127405.
24. Campbell MK, Mollison J, Steen N. Grimshaw JM & Eccles MAnalysis of cluster randomized trials in primary care: a practical approach. Fam Pract. 2000;17:192–6.
25. Donner A, Klar N. Design and analysis of cluster randomized trials in health research. London: Arnold; 2000.
26. Pawson R. The science of evaluation: a realist manifesto. London: Sage; 2013. 27. Brooks G, Burton M, Cole P, Miles J, Torgerson C, Torgerson D. Randomised
controlled trial of incentives to improve attendance at adult literacy classes. Oxf Rev Educ. 2008;34:493–504.
28. Harvey G McCormack B Kitson A Lynch E Titchen A. Designing and
implementing two facilitation interventions within the‘Facilitating Implementation of Research Evidence (FIRE)’study: a qualitative analysis from an external facilitators’perspective. Implement Sci.https://doi.org/10. 1186/s13012-018-0812-z.
29. Eriksson L, Huy TQ, Duc DM, Ekholm Selling K, Hoa DP, Thuy NT, Nga NT, Wallin L. Process evaluation of a knowledge translation intervention using facilitation of local stakeholder groups to improve neonatal survival in the Quang Ninh province, Vietnam. Trials. 2016;17:23.
30. McCormack B, Rycroft-Malone J, DeCorby K, Hutchinson AM, Bucknall T, Kent B, Schultz A, Snelgrove-Clarke E, Stetler C, Titler M, Wallin L, Wilson L. A realist review of interventions and strategies to promote evidence-informed healthcare: a focus on change agency. Implement Sci. 2013;8:107.https:// doi.org/10.1186/1748-5908-8-107.
31. Baskerville B, Liddy C, Hogg W. Systematic review and meta-analysis of practice facilitation within primary care settings. Ann Fam Med. 2012;37(8):63–74.
32. Persson LÅ, Nguyen TN, Målqvist M, Dinh Thi Phuong H, Eriksson L,
Wallin L, Tran QH, Duong MD, Tran VT, Vu Thi Thu T, Ewald U. Effect of facilitation of local maternal-and-child stakeholder groups on neonatal mortality. The NeoKIP cluster-randomised trial in Quang
Ninh province, Vietnam. PLoS Med. 2013:10(5)https://doi.org/10.1371/
journal.pmed.1001445.
33. Etheridge F, Couturier Y, Denis JL, Tremblay L, Tannenbaum C. Explaining the success or failure of quality improvement initiatives in long term care organisations from a dynamic perspective. J Appl Gerontol. 2014;33(6):672–89. 34. Van der Zijpp TJ, Niessen T, Eldh A, Hawkes C, McMullan C, Mockford C,
Wallin L, McCormack B, Rycroft-Malone J, Seers K. A bridge over turbulent waters - illustrating the interaction between managerial leaders and facilitators when implementing research evidence. Worldviews Evid-Based Nurs. 2016;13(1):25–31.https://doi.org/10.1111/wvn.12138.
35. Hawe P. Lessons from complex interventions to improve health. Annu Rev
Public Health. 2015;36:307–23.
36. Pressman JL, Wildavsky A. Implementation, How great expectations in Washington are dashed in Oakland or why it’s amazing that federal programs work at all this being a saga of the economic development administration as told by two sympathetic observers who seek to build morals on a Foundation of Ruined Hopes. Berkeley: University of California Press; 1973.