warwick.ac.uk/lib-publications
Original citation:
Kim, Gi Hyun, Li, Haitao and Zhang, Weina. (2017) The CDS-bond basis arbitrage and the cross section of corporate bond returns. Journal of Futures Markets
Permanent WRAP URL:
http://wrap.warwick.ac.uk/83258
Copyright and reuse:
The Warwick Research Archive Portal (WRAP) makes this work by researchers of the University of Warwick available open access under the following conditions. Copyright © and all moral rights to the version of the paper presented here belong to the individual author(s) and/or other copyright owners. To the extent reasonable and practicable the material made available in WRAP has been checked for eligibility before being made available.
Copies of full items can be used for personal research or study, educational, or not-for profit purposes without prior permission or charge. Provided that the authors, title and full bibliographic details are credited, a hyperlink and/or URL is given for the original metadata page and the content is not changed in any way.
Publisher’s statement:
"This is the peer reviewed version of the following articleKim, Gi Hyun, Li, Haitao and Zhang, Weina. (2017) The CDS-bond basis arbitrage and the cross section of corporate bond
returns. Journal of Futures Markets which has been published in final form at
http://doi.org/10.1002/fut.21845 This article may be used for non-commercial purposes in accordance with Wiley Terms and Conditions for Self-Archiving."
A note on versions:
The version presented here may differ from the published version or, version of record, if you wish to cite this item you are advised to consult the publisher’s version. Please see the ‘permanent WRAP URL’ above for details on accessing the published version and note that access may require a subscription.
The CDS-Bond Basis Arbitrage and the Cross Section of Corporate
Bond Returns
Gi H. Kim, Haitao Li, Weina Zhang1
December 2016
1 Kim is from Warwick Business School, University of Warwick, Coventry, CV4 7AL, United Kingdom. His email
is [email protected], telephone: +44 (0)24 7652 3849, fax: +44 (0)24 7652 3779. Li is from Cheung Kong Graduate School of Business, Beijing, 100738, China. His email is [email protected]. Zhang is from NUS Business School, National University of Singapore, Singapore. Her email is [email protected].
The authors would like to thank Yakov Amihud, Warren Bailey, Tarun Chordia, Bing Han, Robert Jarrow, Paul H. Kupiec, Thomas Noe, Jun Pan, Jayendu Shantilal Patel, Neil Pearson, Marti G. Subrahmanyam, Stuart Turbnull, Jason Wei, Feng Zhao, and participants at the 2010 McGill Risk Management Conference, the FDIC-Cornell-University of Houston Derivative Securities and Risk Management Conference, the 2010 China International Conference in Finance, the Junior Workshop at Fourth Singapore International Conference in Finance 2010, and the 12th Conference of Asia-Pacific Association of Derivatives for their helpful comments and suggestions. Zhang
1
The CDS-Bond Basis Arbitrage and the Cross Section of
Corporate Bond Returns
Abstract
We provide a comprehensive empirical analysis on the implication of CDS-Bond basis arbitrage for the pricing of corporate bonds. Basis arbitrageurs introduce new risks such as funding liquidity and counterparty risk into the corporate bond market, which was dominated by passive investors before the existence of CDS. We show that a basis factor, constructed as the return differential between LOW and HIGH quintile basis portfolios, is a superior empirical proxy that captures the new risks. In the cross section of investment grade bond returns, the basis factor carries an annual risk premium of about 3% in normal periods.
JEL Classification: G10, G12
Keywords: Credit Default Swap, CDS-Bond Basis Arbitrage, Corporate Bond Returns, Basis
2 The credit derivatives markets have experienced tremendous growth during the past decade. According to the Bank for International Settlements (BIS, 2010), the notional value of outstanding credit derivatives by the end of 2007 was 58 trillion dollars, more than six times that of the corporate bond market as shown in Figure 1. Credit derivatives have fundamentally changed market practices in the investment, trading, and management of credit risk. Traditionally, institutional investors, such as pension funds and insurance companies, typically adopt a buy-and-hold strategy in their investments in cash corporate bonds. Nowadays, speculators, such as hedge funds and proprietary trading desks of investment banks, can easily long and short the credit risk of individual companies or portfolios of companies using credit derivatives.2
The single-name credit default swap (CDS) is the most liquid and popular product and accounts for more than two thirds of all outstanding credit derivatives. Since its first appearance in late 1990s, CDS has been widely used to "arbitrage" the mispricing of the credit risk of the same company in the cash and derivatives markets through the so-called CDS-Bond basis trade. The CDS-Bond basis (the basis hereafter) is defined as the difference between the CDS spread of a reference firm and the spread of the firm's cash corporate bond with similar maturity. Many studies have shown that CDS and bond spread should follow a co-integrated process since they measure the credit risk of the same company.3 Investors can easily arbitrage away non-zero basis if the two markets are expected to converge in the future. When the basis is negative (positive), one can long (short) the underlying corporate bond and buy (sell) CDS to bet on the narrowing of
2 See Rajan, McDermott, and Roy (2007) and D'Arcy, McNichols, and Zhao (2009) for a review of the credit
derivatives markets.
3 Hull, Predescu and White (2004), Norden and Weber (2004), and Blanco, Brennan, Marsh, (2005), and
3 the basis. Since it is generally more difficult to short corporate bonds, the negative basis trade has been more popular in practice.
Unlike standard textbook arbitrage, arbitrage in practice is always risky. Arbitrageurs in the basis trade face a wide variety of risks. First, non-zero basis could be due to contractual differences between cash bond and CDS and does not necessarily represent pure arbitrage profits. Second, due to the well-known limits-to-arbitrage constraints of Shleifer and Vishny (1997), arbitrageurs could lose money even in potentially profitable trades. For example, levered arbitrageurs in the basis trade could face funding liquidity risk. Arbitrageurs could also face counterparty risk, mostly from sellers of CDS contracts, liquidity risks in both bond and CDS markets, as well as deleveraging risks from other levered players. Therefore, in practice, the basis trade is never a pure arbitrage, but a risky investment with its own risks and rewards.
The huge losses in the basis trade suffered by Deutsche Bank, Merrill Lynch, Citadel and others during the 2007-2008 financial crisis highlight the risks involved in this trade. The equal- and value-weighted index of the basis for investment grade bonds in Figure 2 exhibit wild fluctuations during extreme market turmoil in 2007 and 2008. The widening of the negative basis was further accelerated by the unwinding of levered arbitrageurs due to heightened uncertainty and their funding constraints, creating significant disruptions in the credit market. The basis only started to revert back to a normal level after the U.S. government stepped in and injected capital to major financial firms through the Troubled Asset Relief Program and the Supervisory Capital Assessment Program.4
Given the dramatic disruptions in the credit market caused by the unwinding of the basis trade, in this paper, we study the potential impacts of the basis trade on the pricing of underlying cash corporate bonds. The basis arbitrage attracts arbitrageurs to the bond market, which has
4 been dominated by buy-and-hold investors. Consequently, the risks involved in the basis trade could affect the pricing of cash corporate bonds through trading activities of the arbitrageurs. The existence of arbitraging channel can transmit not only the new risk from CDS market but also the risk of basis trade into corporate bond pricing.5 Such pricing impact is very similar to that of foreign speculators on emerging market equity returns documented in Bekaert and Harvey (2000). While one can test whether each individual risk involved in the basis trade affects corporate bond returns, it is more important to understand the total pricing effect of these new risks on corporate bond returns together with existing systematic risk factors. Recent literature also suggests that these new risk factors may not capture all the risks involved in the basis trade and these risk factors can reinforce each other.6 Hence, we construct a new risk factor based on predicted basis, i.e. the level of basis due to market frictions and risks, and use it as a convenient empirical proxy to test whether it plays a role for pricing corporate bonds.
Our paper provides several interesting new empirical findings on the basis and its relation to both the time series and cross section of corporate bond returns. First, we show that the basis level of each individual bond can outperform conventional bond characteristics in predicting its future return. We compute the basis for each corporate bond in our sample using CDS spread from Markit and bond prices from TRACE and NAIC between 2001 and 2008. We have about
5 For example, Liu and Mello (2011) argue that the capital fragility of arbitrageurs such as hedge funds can disrupt
the pricing of their traded financial assets. Gârleanu and Pedersen (2011) also predict that the sudden increase of margin requirements for some assets can cause the price to deviate from its fundamental value and margin requirements are common in arbitrage activities. Moreover, Arora, Gandhi, and Longstaff (2012) show that counterparty risk is non-negligibly priced in CDS. Intuitively, the expected return of a given asset mainly depends on its exposure to systematic risk factors that influence the marginal rate of substitution (hereafter MRS) of the dominant investors in the asset. Without CDS, expected returns of cash corporate bonds should depend mainly on their exposures to risk factors that influence the MRS of traditional buy-and-hold investors. With CDS and the basis trade, expected returns of corporate bonds should depend also on the risk factors that influence the MRS of basis arbitrageurs.
6 For example, Bai and Collin-Dufresne (2014) find that a few risks in the basis trade explain less than 50% of the
5 500 investment grade bonds in each year. The time series average of the basis for individual bonds is negative at -40 basis points, suggesting a somewhat permanent discrepancy between CDS and bond spread. Using Fama-Macbeth (1973) regression, we find that the basis level is negatively related to future returns of individual bonds.
Second, we provide strong evidence that the basis is the source of a new risk in explaining the cross section of expected corporate bond returns. We form five bond portfolios based on past average basis and find that the return of longing the LOW quintile basis portfolio and shorting the HIGH one (i.e., a LMH strategy) is significantly positive. The profitability of a LMH strategy is robust to several bond characteristics. Using the LMH portfolio formed on all bonds as a new basis risk factor, we run Fama-Macbeth (1973) regression for twenty bond portfolios sorted on rating and maturity on this basis risk factor after controlling for all existing systematic risk factors. We find that the risk premium associated with the basis risk factor is significantly positive at about 3% per annum for 20-day holding periods between 2002 and 2006.
Third, we provide more direct evidence that the basis risk factor is still significant once we control for the existing empirical proxies for the new risks from basis arbitrage. Following the literature, we use TED spread, FINRET, and VIX to proxy for funding liquidity, counterparty risk, and aggregate collateral risk respectively.7 The basis risk premium remains to be significant when we run standard asset pricing tests by including these new risk proxies. The success of the basis risk factor in the horse race confirms our conjecture that the basis factor may be a superior empirical proxy for new risks. We also verify that the basis factor is not significantly priced in speculative grade bonds, which are less popular among arbitrageurs for the basis trade.
7 Specifically, TED spread is the difference between 3-month uncollateralized LIBOR rate minus 3-month T-bill
6 Finally, we provide interesting evidence on the breakdown of normal pricing relation in the corporate bond market during the 2007-2008 financial crisis, for which period the basis risk premium tends to be negative. Other systematic risk factors, such as the market, HML, DEF, and liquidity factors, exhibit negative risk premiums as well during the crisis. The negative basis risk premium indicates that the corporate bond market experienced significant price disruptions as it was abandoned by investors during the financial crisis. The normal price-adjusting mechanism fails to correct for the mispricing of these bonds. The heightened counterparty risk, funding risk, and uncertainty after the Lehman bankruptcy drive corporate bond prices far away from their fundamental values. Further forced sale of highly leveraged arbitrageurs in credit market drives the demand for corporate bonds further down. As a result, the risk premiums become negative during the crisis. Our findings show the severity of market imperfections in the financial market during the financial crisis.
7 constraints faced by bond investors. Trapp (2009) shows that the basis is related to bond, CDS, and market-wide liquidity measures.
Our paper differs from the above studies in fundamental ways. Instead of focusing on the determinants of the basis, we study the potential impacts of the basis arbitrage trade on the pricing of cash corporate bonds. By constructing a new risk factor based on the basis level for corporate bond returns, our paper contributes to the well-established asset pricing literature on corporate bonds. Fama and French (1993) find that a two-factor model with TERM and DEF factors captures almost all the common variations in investment grade bond excess returns.8 Gebhardt, Hvidkjaer and Swaminathan (2005) find that systematic risk factors such as TERM and DEF are more important than the characteristics measures such as ratings and duration in explaining the cross-sectional returns of bond portfolios and individual bonds.
Many recent papers also demonstrate that liquidity risk is an important systematic risk in the returns of corporate bonds.9 We demonstrate that even after controlling for all the systematic risk and liquidity factors, the basis factor still carries significant positive risk premium during normal market conditions. It is important to note that our basis risk factor is not a simple proxy for liquidity effect (but certainly can be affected by it through funding liquidity as suggested by Brunnermeier and Pedersen (2009) and Aragon and Strahan (2012)) because we extensively control for both liquidity factors and liquidity risks in our tests. Moreover, a recent paper by Friewald, Jankowitsch, and Subrahmanyam (2012) shows that liquidity effect is more pronounced for speculative grade bonds during crisis period. Similarly, Dick-Nielsen, Feldhütter and Lando (2012) also find that illiquidity increases more for speculative bonds than investment
8TERM is the difference between long-term government bond return and the one-month Treasury bill rate, and DEF
is the difference between long-term corporate and government bond return.
9 See e.g., Ericsson and Renault (2006), Chen, Lesmond and Wei (2007), Edwards, Harris and Piwowar (2007),
8 grade bonds from 2005 to 2009. In contrast, our basis risk factor is only significantly priced in investment grade bonds but not speculative bonds. Therefore, our basis risk factor is likely to represent a new risk factor in corporate bond returns due to basis arbitrage activities.
Our study also sheds lights on the impacts of the introduction of derivatives and associated arbitrage activities on the pricing of the underlying securities. While many studies have examined potential impacts of options on underlying securities, our paper is one of the first studies to examine the pricing impact of CDS and CDS-bond basis arbitrage on cash corporate bonds. Kim, Li, and Zhang (2016) construct the level of residual basis, the part of CDS-bond basis that cannot be explained by market frictions and risks, and use it as a proxy of pure mispricing to predict a price convergence in corporate bonds. While Arora, Gandhi, and Longstaff (2012) show that counterparty risk is priced in CDS market, we find that it is relevant in cash bond market. Moreover, as prior studies (e.g., Mitchell and Pulvino, 2001; Duarte, Longstaff, and Yu, 2007) have documented the risk and return properties of different arbitrage strategies, our paper is one of the first to show that the pricing impacts of basis arbitrage trade on the cross-sectional returns of corporate bonds are significant.
The rest of the paper is organized as follows. In section 1, we discuss the basis arbitrage trade and the risks involved. Section 2 describes the data and the construction of the sample. Section 3 documents that the basis is a new risk factor in determining the cross-sectional returns of corporate bonds. Section 4 discusses the results during the 2007-2008 financial crisis and the results for speculative grade bonds. Section 5 concludes.
1. The CDS-Bond Basis Arbitrage
9
1.1. The CDS-Bond Basis Trade
A CDS is essentially an insurance contract, in which the protection buyer pays a premium (called the CDS spread) to the protection seller periodically for protection against the default of a reference entity. A credit event, such as bankruptcy, triggers a contingent payment from the protection seller to the buyer. The payment could be in the form of physical settlement, in which the seller receives the defaulted bond and pays par to the buyer, or cash settlement, in which the seller pays the difference between par and the recovery value of the bond. CDS makes it much more convenient to trade the credit risk of a reference entity. While in the past one has to borrow and sell the cash bond of a company to short its credit risk, right now this can be easily accomplished by buying the CDS of the company.
10 The basis trade was very popular among hedge funds and proprietary trading desks at Wall Street firms before the 2007-2008 financial crisis (see e.g., Choudhry, 2006; JP Morgan, 2006). Traders, while deciding on candidate bonds for the basis trade, tend to consider bonds with funding spreads between -500 basis points (bps) and 1000 bps, which would rule out distressed and speculative grade bonds (see Deutsche Bank, 2009). A positive funding spread can usually lead to a negative basis, which indicates that a bond is cheaper than CDS. During the few years before the crisis when credit was easily available, speculators tend to lever up the basis trade many times to magnify the profits from small price discrepancies.
1.2. Risks Involved in the Basis Trade
It is important to realize that non-zero basis may arise due to market imperfections and does not necessarily represent pure arbitrage profits. As pointed out by Blanco, Brennan and Marsh (2005), one main reason for non-zero basis is contractual differences between cash bond and CDS contract. For example, one might not be able to find a CDS with exactly the same maturity as the cash bond. Second, in case of default, although the accrued interest is paid upon default in CDS, it is not paid for defaulted bond. Moreover, the interest payment of CDS is on a quarterly frequency whereas it is semi-annual for most cash bonds. The cheapest-to-deliver option embedded in CDS contract can be extremely valuable in some default events.10 Investors in CDS may not enjoy the same rights as those in cash corporate bonds either. Bolton and Oehmke (2011) highlight the empty creditor problem where debtholders with CDS protection might desire for quick bankruptcy resolution whereas it might hurt the rights of debtholders without CDS. The cash bond holder might prefer to restructure rather than bankruptcy resolution.
10 The option gives the buyer the right to deliver the cheapest bond for the single name entity when a credit event
11 Non-zero basis could also be due to more efficient price discovery in the CDS market. Acharya and Johnson (2007) show that private information of informed banks tends to be reflected in CDS but not cash bond market. Alexopoulou, Andersson and Georgesu (2009) show that the CDS market usually lead corporate bond market in price discovery. But during the recent financial crisis, the CDS market reacts more towards systematic risk whereas the corporate bond market reacts more to liquidity and idiosyncratic risk.
In addition to the above reasons for non-zero basis, arbitrageurs in the basis trade are also exposed to a wide variety of risks. One important risk is funding liquidity risk for arbitrageurs who purchase cash bonds using borrowed money. Margin requirements, perceived changes to margin requirements, terms of financing, conditions under which financing can be renewed or terminated, actual financing cost (such as repo or reverse repo rate) are all important considerations for evaluating funding risk. Arbitrageurs also face counterparty risk in the basis trade, the majority of which arises from the default risk of protections sellers. When highly levered arbitrageurs face a sudden shortage of capital or funding liquidity, their deleveraging activities can affect the basis level in a significant way, which could lead to deleveraging risk. The liquidity risks in both CDS and bond markets might affect the unwinding of the basis arbitrage positions.11 Given that Brunnermeier and Pedersen (2009) and Aragon and Strahan (2012) both suggest that market liquidity can interact with funding liquidity, such joint effect can complicate the risks involved in the basis arbitrage. Lastly, it is possible that the underlying firms are selling the cash bond and their affiliated financial institutions are also the sellers of the CDS contract. Hence the default risk of the cash bond and the counterparty risk embedded in the CDS can be highly correlated.
11 Many studies, such as Collin-Dufresne, Goldstein and Martin (2001), Elton, Gruber, Agrawal and Mann (2001),
12 While default risk can be hedged to some extent in the basis trade, it is difficult to completely eliminate all other risks involved. Therefore, the seemingly profitable basis arbitrage is not risk free as standard textbook arbitrages. Instead, it is an investment like any other investments, with its own risks and rewards. Since arbitrageurs face all the risks involved in the basis trade and actively trade the cash bonds through the basis trade, these risks might affect corporate bond returns through the trading of the arbitrageurs. Given that the CDS market is many times larger than the cash bond market and that the CDS market often leads bond market in price discovery, basis risk could have big impacts on the pricing of cash corporate bonds through the activities of basis arbitrage.
On the other hand, these risks could not have affected corporate bond returns before the introduction of CDS because passive buy-and-hold investors are not exposed to these risks. Instead of explicitly discussing each individual component of the risks in the basis trade, it is more important to understand the total pricing impact of these new risks on the corporate bond returns. To some extent, the compensation for new risks is reflected in the magnitude of the basis level because arbitrageurs demand discounts to enter the trade to be compensated for the risks they bear. Moreover, we can also construct a reduced-form risk factor in the spirit of Fama-French SMB and HML factors based on the basis to capture the overall pricing impact of basis arbitrage on bond returns since the new risks and traditional systematic risks in corporate bond returns can reinforce each other.
2. Data and Sample Construction
13 restructuring clauses. The daily CDS spreads are aggregated from major CDS dealers and quoted in basis points per year for a notional amount of $10 million. The corporate bond data come from three different sources. The transaction price is from TRACE and NAIC, which is further merged with the Fixed Investment Securities Database (FISD) to obtain bond characteristics, such as coupon and maturity.12 Focusing on senior-unsecured, fixed-rate, straight bonds with semi-annual coupon payments and credit rating information, we remove bonds with embedded options (callable, puttable, or convertible bonds), floating coupons, and less than one year to maturity.
The basis for a given firm i at time t for a given maturity τ is defined as the CDS spread (CDSi,t,τ) minus the bond spread (Zi,t,τ), both of which are measured at time t for maturity τ. While there are many different ways to compute the bond spread, in our empirical analysis, we mainly use Z-spread, which has been widely used in industry in defining the basis according to Choudhry (2006).13 To construct the basis, we first compute the Z-spread for each bond on each day, and then match the computed Z-spread with the CDS spread with the same maturity. In case we do not have the exact match for maturity, we linearly interpolate the CDS curve to obtain a CDS spread that has the same maturity as the bond. Then the basis for each bond is constructed by subtracting the Z-spread from the CDS spread.
Once the basis is computed, we measure the predicted basis following an empirical model in Bai and Collin-Dufresne (2014). The predicted basis is the part of CDS-bond basis (i.e., total basis) that can be explained by a set of market frictions and risks involved in the basis arbitrage, such as funding liquidity, counterparty risk, and collateral quality. We attribute the non-zero
12 Due to limited coverage by TRACE in early years, we supplement the bond transaction information from the
NAIC database. When TRACE has no record of a bond's transaction, we keep the observation from NAIC if it is available
14 level of predicted basis, rather than total basis, to the basis arbitrage risk.14 As such, the predicted basis (BASIS) is our main variable for all empirical analyses throughout the paper.
[Insert Table 1 about Here]
After matching, cleaning, and winsorizing of main variables by 1% at the bottom and the top, our final dataset has a total of 218,168 observations. The sample period is between January 2, 2001 and December 31, 2008. Panel A of Table 1 provides summary statistics for our sample of bonds and time series patterns of the basis. The average bond in our sample has a rating between A and A-, 6.5 years to maturity, 3.9 years of age, a coupon rate of 6%, an issue size of 0.3 billion dollars, a duration of 5.9 years. The average of predicted basis is –40 bps with a max of 17 bps and a min of –222 bps.
3. Is the Basis a New Risk Factor for Corporate Bond Returns?
In this section, we test whether the predicted basis can contain a new source of information for the cross-section of expected corporate bond returns. In doing so, we follow a standard procedure of asset pricing tests: first, we explore the relation between the predicted basis level and future bond returns in the setting of both a regression and portfolio formation. Second, we construct a factor-mimicking portfolios based on the predicted basis. Third, we employ a two-step procedure of Fama and MacBeth (1973) to see if the new factor carries a significant risk premium. For robustness tests, we perform all analysis based on three different holding periods, i.e., 20-, 40- and 60-day horizons, which approximate for monthly, bi-monthly, and quarterly frequency, respectively.
14 More details on the model and its estimation procedures can be found in a companion paper (Kim, Li, and Zhang,
15
3.1 Basis Level and Bond Returns: Individual Bond
To see the relation between the predicted basis and bond returns, we first examine whether the level of predicted basis can predict future bond returns. If we interpret the basis level as a reflection of the compensation for the risks in the basis trade, then investors should be compensated in future bond returns by arbitraging away the non-zero basis. In other words, we expect current negative basis leads to higher future bond returns. For each bond i, we compute its k-day holding period return HPRi,t,t+k using the following equation,
, , , , , , , , , , ( ) ( ) , ( )
i t k i t k i t t k i t i t
i t t k
i t i t
P AI C P AI
HPR
P AI
(1)
when Pi,t+k is the closest available transaction price of bond i on day t+k, AIi,t+k is the accrued interest on day t+k, Ci,t,t+k is the coupon payment during the period from day t to t+k, Pi,t is the closest available transaction price on day t, and AIi,t is the accrued interest on day t.15
We consider the following Fama-MacBeth regression of future individual bond excess returns on its past predicted basis level, bond characteristics, and one liquidity measure:
, , , , 1 , 2 , 3 , 4 ,
5 , 6 , 7 _ , , ,
i t t k f t t k i t i t i t i t
i t i t i t i t
HPR r BASIS RATING MATURITY AGE
COUPON ISSUE INDLIQ k
(2)
where HPRi,t,t+k is the k-day (where k = 20, 40, 60) holding period return for individual bond i from day t to t+k, rf,t,t+k is the cumulative risk free rate from day t to t+k, BASISi,t, RATINGi,t, MATURITYi,t, AGEi,t, COUPONi,t, ISSUEi,t, and INDLIQ_ki,t is the predicted basis level, credit rating, maturity, age, coupon, issue size, and liquidity of bond i on day t, respectively. The
15 If there is no price available on day t, we check whether there is any transaction price on day t-1, 2, 3, 4 and
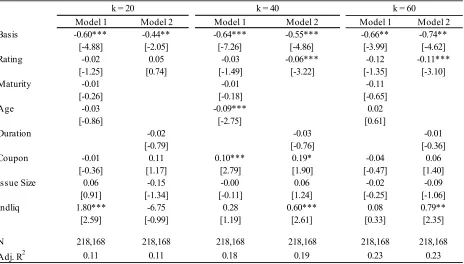
16 liquidity factor INDLIQ_ki,t is the sum of the turnover of bond i that is defined as the total trading volume divided by the total amount outstanding for the bond between day t-k to day t. We run cross-sectional regression on each day and report the time series averages of the estimates of the coefficients. The results are reported in Model 1 in Table 2. For robustness checks, we also replace age and maturity by duration (DURATIONi,t) in Model 2 in Table 2.
[Insert Table 2 about Here]
17 transactions and logarithmic of trading volume for each bond from day t-k to day t) for robustness checks and the results are similar.16
3.2Basis Level and Bond Returns: Portfolio Approach
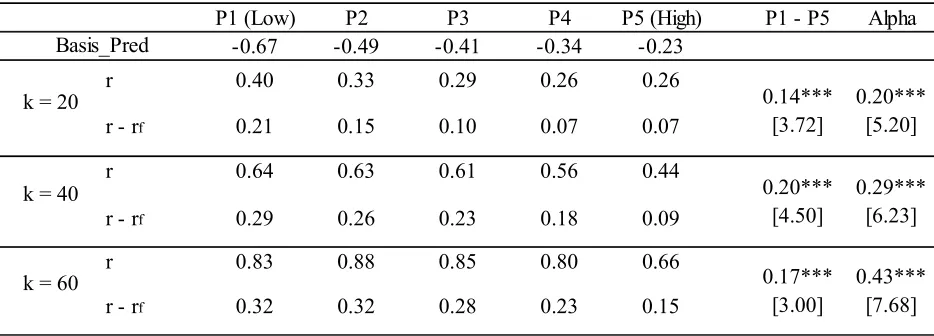
In this section, we form quintile portfolios of bonds based on their past predicted basis level and examine their subsequent returns over different holding periods. We sort bonds into five basis portfolios based on the predicted basis of each bond. We then compute the subsequent value-weighted k-day holding period returns of each basis portfolio on day t, HPRt,t+k, where k = 20, 40, and 60 days respectively. We compute the value-weighted portfolio return by weighting each bond's return by the ratio of its market value to the total market value of all the bonds within the portfolio.
[Insert Table 3 about Here]
Table 3 reports the raw and excess holding period returns of the five equal-weighted basis portfolios. The excess return is the difference between the raw return and the risk free rate during the same holding period. On average each basis portfolio contains about 18 bonds. The levels of the basis of the five portfolios range from –67 bps (lowest) to –23 bps (highest). We find that the lowest basis portfolio has significantly higher raw and excess returns than the highest basis portfolio over all three holding periods. The return differentials between the two basis portfolios are statistically significant at the 1% significance level and amount to 14 bps, 20 bps, and 17 bps for 20-, 40-, and 60-day holding periods, respectively. This result indicates that buying the lowest basis portfolio and selling the highest basis portfolio can generate positive return, which amounts to the positive alpha ranging from 20 bps to 43 bps. On an annual basis, the portfolio strategy (the LMH basis portfolio of buying low basis bonds and selling short high basis bonds)
18 would generate a maximum abnormal return of 2.52% , which is an economically significant number.17
3.3New Risk Factor for Corporate Bond Returns: Basis LMH
In this section, we test explicitly whether the LMH basis factor, constructed as return differential between the LOW and HIGH basis portfolios formed from all available investment grade bonds, is a new risk factor priced in corporate bond returns. Due to the dramatic disruptions to all major financial markets during the crisis, we conduct our analysis in two separate periods, one for normal market conditions before the crisis between 2001 and 2006, and another during the crisis between 2007 and 2008.18 In this section, we present our main results for the normal time, and the results for the during-crisis period will be presented in the subsequent section.
Following Gebhardt, Hvidkjaer, and Swaminathan (2005), we form twenty bond portfolios sorted on rating (AAA, AA, A, and BBB) and maturity (1-3, 3-5, 5-7, 7-10, and more than 10 years) and use their 20-, 40-, and 60-day value-weighted holding period returns to conduct our asset pricing tests. We also construct the new basis risk factors over corresponding holding horizons. We then perform the rolling regression for each of the twenty rating-maturity bond portfolio, q, to obtain the betas of the all the factors using the data over the past 240 trading days.
, , , , , , , , , , ,
, , , , , , , ,
, , , ,
_ _ _
_ _ _ _
_ ,
q t k t f t k t q k b q k t m q k t size q k t
bm q k t def q k t term q k t l q k t
amh q k t q k t
HPR r BASIS k MKT k SMB k
HML k DEF k TERM k LIQ k
AMH k
(3)
where HPRq,t-k,t is the k-day holding period return of the bond portfolio q formed on four credit rating classes and five maturity groups (q=1,2,…,20) from day t-k to t, BASIS_kt is the k-day
17 In unreported results, we also show that the profitability of the short-long portfolio strategy based on the predicted
basis level is robust to a wide set of bond characteristics such as rating, maturity, coupon, age, and issue size.
18 Since we consider daily portfolio returns, we can still perform a robust sub-period study for the 2007 and 2008
19 holding period return of the basis factor from day t-k to t, MKT_kt, SMB_kt, and HML_kt are the three standard factors used in Fama and French (1993) from day t-k to day t, DEF_kt and TERM_kt are the two standard bond factors of Fama and French (1993) from day t-k to day t, LIQ_kt measures the turnover in the bond market as the ratio of total trading volume divided by the total number of bonds outstanding from day t-k to day t, and AMH_kt is the Amihud (2002) liquidity risk factor measured from day t-k to day t. βb,q,k is the beta for the basis risk factor for portfolio q for time horizon k, βm,q,k is the market beta, βsize,q,k is the size beta, βbm,q,k is the BM beta, βdef,q,k is the default beta, βterm,q,k is the term beta, βl,q,k is liquidity beta, and βamh,q,k is the Amihud liquidity beta.19 The summary statistics on pricing factors and the correlations between them are provided in Panel B and Panel C of Table 1 respectively. Panel B shows that the basis risk factor is highly positively correlated with MKT, DEF, and AMH (with correlation coefficient above 0.10).
After obtaining the estimated betas from equation (3), we run the following Fama-Macbeth (1973) regression to obtain the estimates of the risk premium for each of the risk factors:
, , , , , ,
, , , , 0 ,
, , , , , , , , , , , ,
b q k m q k size q k q t t k f t t k q k b m size
bm q k def q k term q k l q k amh q k
bm def term l amh q k
HPR r
(4)
where HPRq,t,t+k represents the realized return of bond portfolio q from day t to t+k and is a proxy for the expected return from day t to day t+k (where q =1,2,…,20, and k =20, 40, or 60), all the betas with the hat sign are the estimated betas for various risk factors for portfolio q for the time horizon k from the first-stage time series regression from day t-240 to t. Hence, the regression results from equation (6) report the risk premiums of eight systematic risk factors, which are denoted by γs.
19 We follow the procedures in Lin, Wang and Wu (2011) to construct the Amihud (2002) liquidity measure for the
20 [Insert Table 4 about Here]
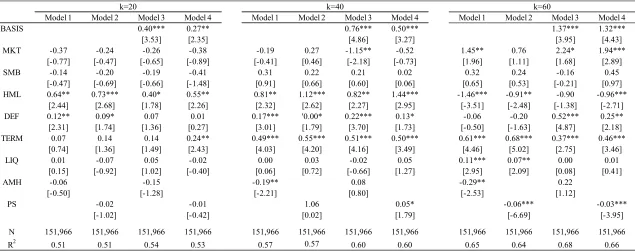
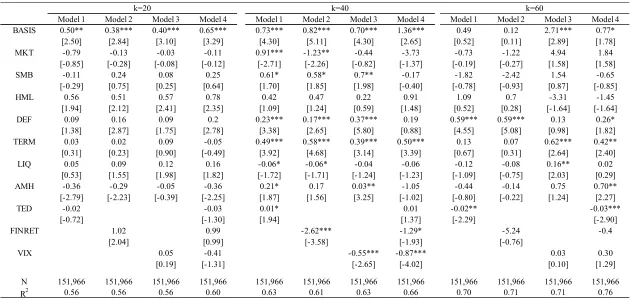
Table 4 reports the Fama-MacBeth regression results for the asset pricing test from 2001 to 2006. Model 1 and Model 2 show the results of seven-factor asset pricing model without the basis factor. Consistent with the literature, it is shown that HML, DEF, and TERM carry significant positive risk premia. The adjusted R2s of the seven factor model range from 51% to 65%. After including the basis risk factor in Model 3 and Model 4, we find that the basis risk premium is significantly positive during this time period. The basis risk premia range from 3.15% to 5.75% on an annual basis. On average, the basis risk carries an annual basis risk premium of 4.61% across different time horizons. Moreover, the new basis risk factor continues to be significant in the presence of other existing systematic risk factors across all time horizons. This result confirms our conjecture that the basis risk factor represents new sources of risks that are independent of the existing systematic risk factors. We will further verify the source of the basis risk in relation to the new risks arisen from basis arbitrage in the following section.
3.4 Horse-race of the Basis Factor with the Proxies of New Risks
21 trade. They define basis in a general way as the price gap between securities with identical cash flows but different margins. They show that the required return on a high-margin security such as corporate bond is greater than that of a low-margin security with the same cash flow such as a CDS. Fontana (2009) shows that funding liquidity dried up during the crisis. Moreover, Fontaine and Garcia (2009) also argue that funding liquidity can potentially be an important missing aggregate risk factor that commands a risk premium. Moreover, Arora, Gandhim, and Longstaff (2012) show that counterparty risk is priced in CDS market. Bai and Collin-Dufresne (2014) aim to explain the basis level by their constructs of funding liquidity measure, counterparty risk measure, liquidity, and collateral risk measure and find that these proxies can explain up to 50% of the total basis in time series but less than 25% in cross sections.
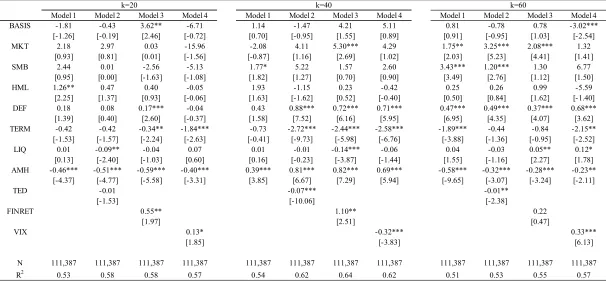
In addition to the traditional seven systematic risk factors, we construct three empirical risk factors to proxy for the (aforementioned) new risks involved in CDS and basis trade, such as funding liquidity, counterparty risk and collateral risk. First, funding liquidity is proxied by TED spread, which is the difference between 3-month uncollateralized LIBOR rate minus 3-month T-bill rate. Second, counterparty risk is proxied by FINRET, which is the value-weighted excess return of all investment bank equities from CRSP with SIC code 6211. Third, aggregate collateral risk is proxied by VIX, which is the S&P500 option implied volatility from CBOE. We conduct an asset pricing test for the basis risk factor in the presence of the existing systematic risk factors as well as the three new risk factors. The results are reported in Table 5.
[Insert Table 5 about Here]
22 2001-2006. Model 2 includes FINRET and shows a similar result. The basis risk premium carries a significant annual risk premium of 4.79% to 5.17%. Model 3 with VIX included shows a stronger result: a significant annual basis risk premium for all three horizons, ranging from 4.40% to 11.34%. Finally, Model 4 includes all three new risk factors together with the basis risk factor. The basis risk factor still survives across all time horizons and carries an average annual risk premium of 6.65%. There is also some indication that the basis risk factor is the most dominant risk factor in the 20-day horizon as the three new risks are jointly insignificant.
In summary, based on the sample of investment grade bonds from 2001 to 2006, our results provide the novel evidence that the basis risk is a new risk factor for the expected corporate bond returns even after controlling for well-known risk factors documented by Fama and French (1993), Gebhardt, Hvidkjaer and Swaminathan (2005), and Lin, Wang and Wu (2011).
4. Discussion: Financial Crisis and Speculative-Grade Bond
4.1Results During the Financial Crisis (2007-2008)
23 risk reflects the arbitrage risk conveniently and not completely. During the crisis period, the arbitrage risk can last for a long time as price discovery can be very slow (i.e., Duffie, 2010) and more direct proxies for funding liquidity and the counterparty risk can capture risk-return relationship in the bond returns as arbitrage activities are frozen during the crisis since the terms and availability of financing deteriorate significantly. This may dramatically reduce the demand for the basis trade. Furthermore, many levered players in the trade have been forced to unwind their positions due to the tightening of credit. As a result, the basis widens and becomes hugely negative in the height of the crisis.20
[Insert Table 6 about Here]
A further demonstration of the collapse of the market mechanism in the crisis is also revealed from the negative risk premia for the well-known systematic risk factors such as MKT, HML, and DEF. These results imply that the financially-constrained bond investors are willing to take huge price discounts to cash out from the credit market even though they know that the expected return in the long-run would be positive if they can hold on to their investments.
The widening of the basis has also created serious disruptions in the credit market even for investors who have not invested in CDS. For example, traditional investors in cash bonds suffer huge losses as well due to the unwinding of the basis trade. As a result, investment-grade corporate credit spreads, such as CDX.IG index rose from 50 bps in early 2007 to about 250 bps by the end of 2008. The spread of even the safest tranche, such as CDX.IG super senior tranche, widens to about 100 bps from 5 bps. Figure 3 provides time series plots of BAA and AAA credit spreads and their difference, as well as the LIBOR-OIS spread between 2001 and 2008. The
20 As shown in Figure 2, the basis of investment grade index in late 2008 is about -250 basis points. Many banks and
24 LIBOR-OIS spread is the difference between LIBOR and the overnight indexed swap rate and measures the counterparty risk in the financial system. The difference between BAA and AAA spreads increases from 100bps to 330 bps from January 2007 to December 2008. The LIBOR-OIS spread shoots up from about 10 bps to more than 80 bps in early July 2007 and increases further to more than 360 bps in October 2008, before settling back to about 10bps in August 2010.
On the other hand, the potential cash-rich investors are reluctant to step in to bring the price back to its fundamental value. They also enter into a massive fear as they are not sure whether the market might collapse and they might lose all their investments. The joint effects of deleveraging by the financial-constrained arbitrageurs and fearful investors make the prices of corporate bonds deviate significantly from their equilibrium values for a prolonged period and arbitrageurs fail to step in to bring the price back to equilibrium. Only when the government steps in to restore the confidence in the financial system, the bond market starts to revert back to its equilibrium level.
4.2 Results for Speculative Grade Bonds
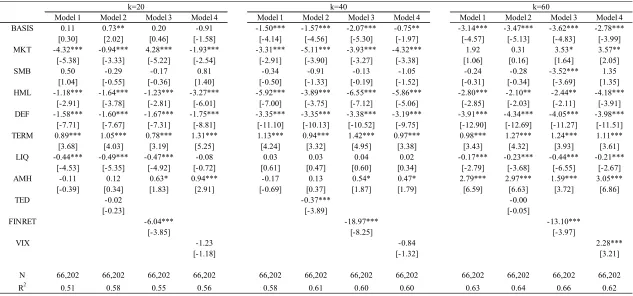
According to Deutsche Bank (2009), arbitrageurs tend to favor investment grade bonds over speculative grade bonds when conducting the basis trade. As a result, we do not expect the basis risk to play an important role for pricing speculative grade bonds. Table 7 performs the standard asset pricing tests for high-yield bonds for the normal time (Panel A) and the crisis period (Panel B) respectively. There are altogether twenty bond portfolios with five maturity groups as defined before and four rating classes (BB, B, CCC, and CC-C).
25 Overall, the results for high yield bonds are almost non-existent. As expected, the basis risk premium is indifferent from zero for the most of the model specifications in either the normal period or the crisis period. Other new risks such as counterparty risk and collateral risk carry significant risk premia for the 20-day horizon during the normal period, similar to investment grade bonds. But the results are more mixed across other holding horizons. During the financial crisis, these new risks can have positive or negative risk premia at different time horizons as well. These results indicate that bonds that are not widely used in the basis trade are not heavily affected by the basis risk. The other new risks can also affect speculative bonds, but plausibly through different channels other than the basis arbitrage and therefore the risk premiums are not consistently negative or positive.
We also conduct extensive robustness checks on the alterative empirical proxies of funding liquidity, counterparty risk and uncertainty measures.21 For example, we use LIBOR minus OIS and LIBOR minus REPO to replace TED spread. We also construct the sensitivity measure of the investment bank equity returns with respect to the interest rate change to capture the counterparty risk of the financial intermediaries. We also employ alternative basis measures by using adjusted Z-spread and asset swap spread. Lastly, we also test the results on the alternative twenty bond portfolios formed on duration and ratings. The prevailing results are largely consistent with our conjecture. The results are available upon requests.
5 Conclusion
In this paper, we have identified a new risk factor, the basis factor, for pricing corporate bonds. In contrast to well-known systematic risk factors, the basis factor affects corporate bond returns only after the introduction of CDS and the associated CDS-Bond basis arbitrage trade. The basis
26 factor, constructed as the return differential between LOW and HIGH quintile basis portfolios, is priced in the cross section of investment grade bonds with an annual risk premium of about 3% in normal periods. Our result shows that the introduction of CDS has fundamentally changed the pricing of cash corporate bonds. It also highlights the inter-connections of different financial markets, arbitrageurs in credit derivatives can affect the pricing of cash corporate bonds through their trading activities. Hopefully these effects can be incorporated more explicitly into the future asset pricing theories.
27
References:
Acharya, Viral V., and Johnson Timothy C., 2007. Insider Trading in Credit Derivatives, Journal of Financial Economics, 84, 110-141.
Alexopoulou, Ioana, Andersson, Magnus, and Georgescu, Oana Maria, 2009, An Empirical Study on the Decoupling Movements between Corporate Bond and CDS Spreads. ECB Working Paper No. 1085.
Amihud, Yakov, 2002, Illiquidity and Stock Returns: Cross-Section and Time Series Effects, Journal of Financial Markets 5, 31-56.
Aragon, George O., and Philip E. Strahan, 2012, Hedge Funds as Liquidity Providers: Evidence from the Lehman Bankruptcy, Journal of Financial Economics 103, 570-587.
Arora, Navneet, Priyank Gandhi, and Francis A. Longstaff, 2012, Counterparty Credit Risk and the Credit Swap Market, Journal of Financial Economics 103, 280-293.
Bai, Jennie and Pierre Collin-Dufresne, 2014, The CDS-Bond Basis, AFA 2013 San Diego Meetings Paper.
Bao, Jack, Jun Pan, and Jiang Wang, 2011, The Illiquidity of Corporate Bonds, Journal of Finance 66, 911-946.
Bekaert, Geert and Campbell Harvey, 2000, Foreign Speculators and Emerging Markets, Journal of Finance 55, 565-613.
BIS Credit Risk Transfer Statistics, 2010, Bank of International Settlements.
Blanco, Robert, Simon Brennan, and Ian Marsh, 2005, An Empirical Analysis of the Dynamic Relationship between Investment Grade Bonds and Credit Default Swaps, Journal of Finance 60, 2255-2281.
Board of Governors of the Federal Reserve System, 2009, The Supervisory Capital Assessment Program: Overview of Results.
28 Brunnermeier, Markus K. and Lasse Heje Pedersen, 2009, Market Liquidity and Funding Liquidity, Review of Financial Studies 22, 2201-2238.
Chen, Long, David Lesmond, and Jason Wei, 2007, Corporate Yield Spreads and Bond Liquidity, Journal of Finance 62, 119-149.
Choudhry, Moorad, 2006, The Credit Default Swap Basis, Bloomberg Press, New York.
Collin-Dufresne, Pierre, Robert Goldstein, and Spencer Martin, 2001, The Determinants of Credit Spread Changes, Journal of Finance 56, 2177--2207.
D'Arcy, Stephen, James McNichols, and Xinyan Zhao, 2009, A Primer on Credit Derivatives, Working paper, University of Illinois.
D. E. Shaw Group, 2009, The Basis Monster That Ate Wall Street, Market Insights 1, 1-9.
Deutsche Bank, 2009, CDS-Bond Basis Update, Quantitative Credit Strategy, Global Markets Research.
De Wit, Jan, 2006, Exploring the CDS-Bond Basis, Working paper, National Bank of Belgium. Dick-Nielsen, Jens, Peter Feldhütter, and David Lando, 2012, Corporate Bond Liquidity before and After the Onset of the Subprime Crisis, Journal of Financial Economics 103, 471-492. Duarte, Jefferson, Francis Longstaff, and Fan Yu, 2007, Risk and Return in Fixed-Income Arbitrage: Nickels in Front of a Steamroller? Review of Financial Studies 20, 769-811.
Duffie, Darrell, 2010, Presidential Address: Asset Pricing Dynamics with Slow-Moving Capital, Journal of Finance 65, 1237-1267.
Edwards, Amy K., Lawrence E. Harris, and Michael S. Piwowar, 2007, Corporate Bond Market Transaction Costs and Transparency, Journal of Finance, 62(3), pp. 1421-1451.
Elton, Edwin, Martin Gruber, Deepak Agrawal, and Christopher Mann, 2001, Explaining the Rate Spread on Corporate Bonds, Journal of Finance 56, 247-277.
Ericsson, Jan and Olivier Renault, 2006, Liquidity and Credit Risk, Journal of Finance 61, 2219-2250.
29 Fama, Eugene and James MacBeth, 1973, Risk, Return and Equilibrium: Empirical Tests, Journal of Political Economy 81, 607-636.
Fontaine, Jean-Sébastien and René Garcia, 2009, Bond Liquidity Premia, Working paper, Université de Montréal.
Fontana, Alessandro, 2009, The Persistent Negative CDS-Bond Basis during the 2008/09 Financial Crisis, Working paper, Ca'Foscari University of Venice.
Friewald, Nils, Rainer Jankowitsch, and Marti G. Subrahmanyam, 2012, Illiquidity or Credit Deterioration: A Study of Liquidity in the US Corporate Bond Market during Financial Crisis, Journal of Financial Economics 105, 18-36.
Gârleanu, Nicolae and Lasse Heje Pedersen, 2011, Margin-Base Asset Pricing and Deviations from the Law of One Price, Review of Financial Studies 24, 1980-2022.
Gebhardt, William, Soeren Hvidkjaer, and Bhaskaran Swaminathan, 2005, The Cross-section of expected corporate bond returns: Betas or characteristics? Journal of Financial Economics 75, 85-114.
Goldstein, M., E. Hotchkiss and E. Sirri, 2007, Transparency and Liquidity: A Controlled Experiment on Corporate Bonds, Review of Financial Studies, 235-273.
Hull, John, Mirela Predescu, and Alan White, 2004, Relationship Between Credit Default Swap Spreads, Bond Yields, and Credit Rating Announcements, Journal of Banking and Finance 28, 2789-2811.
JP Morgan, 2006, Credit Derivative Handbook, Corporate Quantitative Research.
Kim, G. H., Haitao Li, and Weina Zhang, 2016, CDS-Bond Basis and Bond Return Predictability, Journal of Empirical Finance 38, 2016, 307-337.
Liu, Xuewen, and Antonio S. Mello, 2011, The Fragile Capital Structure of Hedge Funds and the Limits to Arbitrage, Journal of Financial Economics 102, 491-506.
Lin, Hai, Junbo Wang, and Chunchi Wu, 2011, Liquidity Risk and the Cross-Section of Expected Corporate Bond Returns, Journal of Financial Economics 99, 628-650.
30 Mitchell, Mark and Todd Pulvino, 2012, Arbitrage Crashes and the Speed of Capital, Journal of Financial Economics 104, 469-490.
Nashikkar, Amrut, Marti G. Subrahmanyam, and Sriketan Mahanti, 2011, Liquidity and Arbitrage in the Market for Credit Risk, Journal of Financial and Quantitative Analysis 46, 627-656.
Newey, Whitney and Kenneth West, 1987, A Simple, Positive Definite, Heteroskedasticity and Autocorrelation Consistent Covariance Matrix, Econometrica 55, 703-708.
Norden, Lars and Martin Weber, 2004, The Comovement of Credit Default Swap, Bond and Stock Markets: An Empirical Analysis, CFS Working paper, University of Mannheim, Germany. Oehmke, Martin and Adam Zawadowski, 2013a, Synthetic or Real? The Equilibrium Effects of Credit Default Swaps on Bond Markets, Working Paper, Columbia University.
Oehmke, Martin, and Adam Zawadowski, 2013b, The Anatomy of The CDS Market, Working Paper, Columbia University.
Pástor, Lubos , and Stambaugh, Robert F., 2003, Liquidity Risk and Expected Stock Returns, Journal of Political Economy 111, 642-685.
Rajan, Arvind, Glen McDermott, and Ratul Roy, 2007, The Structured Credit Handbook. John Wiley & Sons, Inc.
Shleifer, Andrei and Robert W. Vishny, 1997, The Limits to Arbitrage, Journal of Finance 52, 35-55.
Tang, Dragon Yongjun and Yan Hong, 2007, Liquidity and Credit Default Swap Spreads, Working paper, University of South Carolina.
31
Table 1. Summary Statistics
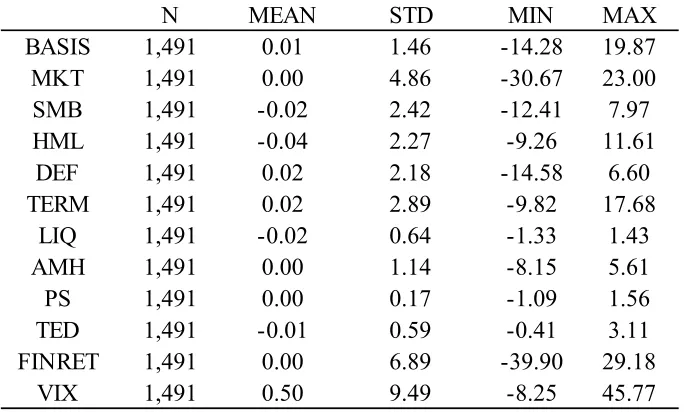
The table reports summary statistics of main variables used in the analyses. Panel A reports the statistics at the individual bond level. Basis, reported in a percentage term, is the level of CDS-bond predicted basis, which is measured by the predicted value from the empirical model of Bai and Dufresne (2014). Rating is bond ratings by the S&P whenever available, or by Moody’s or Fitch otherwise. Maturity is the log of time to maturity, Coupon is the bond’s annual amount of coupon, and Age is the log of bond age. Issue size is the natural logarithm of issuance amount in billions. Duration is bond duration in years. Indliq is a bond liquidity measure defined the sum of the turnover of the individual bond defined as the total trading volume divided by the total number outstanding for the bond. Panel B reports the statistics on the asset pricing factors. MKT is the cumulative excess daily market return for 20-day horizon, and SMB and HML are defined similarly. TERM is the difference between the daily return of the Barclays long-term government bond index and the daily T-bill return. DEF is the daily difference between the return of the Barclays long-term corporate bond index and that of the Barclays long-term government bond index.
LIQ is the sum of the turnover defined as the total trading volume divided by the total number outstanding for all corporate bonds. AMH is the Amihud (2002) bond market liquidity risk factor, and PS is the Pastor-Stambaugh (2003) bond market liquidity risk factor.TED is the average of 3-month uncollateralized LIBOR rate minus 3-month T-bill rate, FINRET is the cumulative excess return of value-weighted financial firms’ equity returns, VIX is the average of S&P500 option volatility. All factors measured based on returns are computed using the data for the k -day (k=20,40,60) horizon, and the value reported in this table is based on 20-day horizon. Panel C reports the correlation coefficient matrix of pricing factors and the statistically significant numbers are in gray. The sample span the period from January 2001 to December 2008.
Panel A: Bond Characteristics
N MEAN STD MIN MAX
Basis 218,168 -0.40 0.48 -2.22 0.17
Rating 218,168 7.16 2.04 1.00 10.00
Maturity 218,168 1.87 0.88 0.00 3.40
Coupon 218,168 0.06 0.01 0.00 0.11
Issue Size 218,168 12.83 0.61 9.85 14.51
Age 218,168 1.36 1.04 -5.90 3.26
Indliq 218,168 0.04 0.06 0.00 1.13
Duration 218,168 5.96 3.53 0.92 14.84
Panel B: Bond Pricing Factors
N MEAN STD MIN MAX
BASIS 1,491 0.01 1.46 -14.28 19.87
MKT 1,491 0.00 4.86 -30.67 23.00
SMB 1,491 -0.02 2.42 -12.41 7.97
HML 1,491 -0.04 2.27 -9.26 11.61
DEF 1,491 0.02 2.18 -14.58 6.60
TERM 1,491 0.02 2.89 -9.82 17.68
LIQ 1,491 -0.02 0.64 -1.33 1.43
AMH 1,491 0.00 1.14 -8.15 5.61
PS 1,491 0.00 0.17 -1.09 1.56
TED 1,491 -0.01 0.59 -0.41 3.11
FINRET 1,491 0.00 6.89 -39.90 29.18
32
Panel C: Pricing Factor Correlations
(1) (2) (3) (4) (5) (6) (7) (8) (9) (10) (11) (12) (1) BASIS 1 0.17 -0.01 0.05 0.14 0.03 -0.01 0.13 0.00 -0.12 0.14 -0.05 (2) MKT 1 0.31 -0.03 0.70 -0.10 0.25 0.35 0.12 -0.43 0.79 -0.29 (3) SMB 1 0.20 0.30 -0.06 0.09 0.18 0.05 -0.21 0.27 -0.18 (4) HML 1 0.05 0.06 0.02 0.11 0.15 -0.15 0.03 -0.26 (5) DEF 1 -0.19 0.27 0.48 0.25 -0.6 0.53 -0.38 (6) TERM 1 -0.25 0.15 -0.16 0.14 -0.13 0.30
(7) LIQ 1 0.15 0.08 -0.41 0.20 -0.58
(8) AMH 1 0.19 -0.41 0.26 -0.31
(9) PS 1 -0.32 0.01 -0.20
(10) TED 1 -0.26 0.62
(11) FINRET 1 -0.20
33
Table 2. The CDS-Bond Basis and Individual Bond Returns
The table reports the predicting power of the predicted basis for bond returns. We run a standard Fama-Macbeth regression on future individual bond returns at k-day horizon (where k = 20, 40, 60) from day t onwards. A dependent variable is the excess return in a percentage form for the k-day holding period, and independent variables include the predicted basis (Basis), and a set of bond characteristics. Basis, in a percentage term, is the level of CDS-bond predicted basis, which is measured by the predicted value from the empirical model of Bai and Dufresne (2014). Rating is bond ratings by the S&P whenever available, or by Moody’s or Fitch otherwise. Maturity is the log of time to maturity, Coupon is the bond’s annual amount of coupon, and Age is the log of bond age. Issue size is the natural logarithm of issuance amount in billions. Duration is bond duration in years. Indliq is a bond liquidity measure defined the sum of the turnover of the individual bond defined as the total trading volume divided by the total number outstanding for the bond for k-day horizon. The t-statistics are reported in square brackets. An ***, **, and * denotes significance at the 1%, 5%, and 10% level, respectively.
Model 1 Model 2 Model 1 Model 2 Model 1 Model 2 Basis -0.60*** -0.44** -0.64*** -0.55*** -0.66** -0.74**
[-4.88] [-2.05] [-7.26] [-4.86] [-3.99] [-4.62] Rating -0.02 0.05 -0.03 -0.06*** -0.12 -0.11***
[-1.25] [0.74] [-1.49] [-3.22] [-1.35] [-3.10]
Maturity -0.01 -0.01 -0.11
[-0.26] [-0.18] [-0.65]
Age -0.03 -0.09*** 0.02
[-0.86] [-2.75] [0.61]
Duration -0.02 -0.03 -0.01
[-0.79] [-0.76] [-0.36]
Coupon -0.01 0.11 0.10*** 0.19* -0.04 0.06 [-0.36] [1.17] [2.79] [1.90] [-0.47] [1.40] Issue Size 0.06 -0.15 -0.00 0.06 -0.02 -0.09 [0.91] [-1.34] [-0.11] [1.24] [-0.25] [-1.06] Indliq 1.80*** -6.75 0.28 0.60*** 0.08 0.79** [2.59] [-0.99] [1.19] [2.61] [0.33] [2.35] N 218,168 218,168 218,168 218,168 218,168 218,168
Adj. R2 0.11 0.11 0.18 0.19 0.23 0.23
34
Table 3. Returns of the Quintile Basis Portfolios
The table reports the average of k-day (k = 20, 40, 60) holding period returns for the quintile basis portfolios, which are constructed based on the predicted basis with P1 of the lowest basis and P5 of the highest basis. Portfolios are rebalanced daily and value-weighted by market capitalization using the last available transaction price of the bond. When computing the holding period return for the basis portfolio, we use the starting price from the formation date t
whenever available, and the latest price within a five-day window prior to the formation date, otherwise. We use the ending transaction price on day t+k whenever available, and the last available transaction price within a five day window prior to day t+k, otherwise. Bonds without the starting and ending prices are removed from the analysis. We report both raw returns (r) and excess returns (r-rf) for each of quintile portfolios. The column “P1-P5” refers to
the difference in returns between P1 and P5. Basis and portfolio returns are reported in percentage terms. Alpha is abnormal returns for the portfolio, P1-P5, which are measured against the 6-factor pricing models with MKT, SMB, HML, DEF, TERM, and AMH. There are about 18 bonds in each quintile portfolio. The t-statistics are reported in square brackets. An ***, **, and * denotes significance at the 1%, 5%, and 10% level, respectively.
P1 (Low) P2 P3 P4 P5 (High) P1 - P5 Alpha
-0.67 -0.49 -0.41 -0.34 -0.23
r 0.40 0.33 0.29 0.26 0.26
r - rf 0.21 0.15 0.10 0.07 0.07
r 0.64 0.63 0.61 0.56 0.44
r - rf 0.29 0.26 0.23 0.18 0.09
r 0.83 0.88 0.85 0.80 0.66
r - rf 0.32 0.32 0.28 0.23 0.15
Basis_Pred
0.14*** [3.72]
0.20*** [4.50]
0.17*** [3.00]
0.20*** [5.20]
0.29*** [6.23]
0.43*** [7.68] k = 20
k = 40
35 Table 4. Asset Pricing Tests with the Basis Risk Factor
The table reports the estimated risk premium on bond pricing factors, based on asset pricing tests using the basis factor as a new risk factor along with existing factors. The test assets are twenty rating/maturity portfolios constructed by double-sorting bonds on their rating and maturity. The basis factor, BASIS, is defined as the k-day (k = 20, 40, 60) holding period (value-weighted) returns on the LMH portfolio (i.e., P1-P5), the portfolio of buying the lowest quintile basis portfolio and selling short the highest quintile basis portfolio as shown in Table 3. The existing risk factors are MKT, SMB, HML, TERM, DEF, LIQ, AMH, and PS. MKT is the cumulative excess daily market return from k-day horizon, SMB and HML are the cumulative daily returns of the SMB portfolio and the HML portfolio for k-day horizon, respectively. TERM is the difference between the daily return of the Barclays long-term government bond index and the daily T-bill return. DEF is the daily difference between the return of the Barclays long-term corporate bond index and that of the Barclays long-term government bond index. For TERM and DEF, daily values are cumulated to have the k-day value. LIQ is the level of bond market-level liquidity, measured as the sum of daily turnover for k-day horizon, which is computed as the total trading volume divided by the total number outstanding for all corporate bonds. AMH is the Amihud (2002) bond market liquidity risk factor, and PS is the Pastor-Stambaugh (2003) bond market liquidity risk factor. We also compute the value of liquidity risk factors for a time horizon of k. All factors are demeaned and are in percentage terms. All the systematic risk factors are measured based on data from day t-k to t and the returns on the twenty rating/maturity portfolios are measure based on data from day t to t+k. When estimating the betas, we employ the standard Fama-MacBeth procedure with a 240-day rolling window. The t-statistics are reported in square brackets. An ***, **, and * denotes significance at the 1%, 5%, and 10% level, respectively.
Model 1 Model 2 Model 3 Model 4 Model 1 Model 2 Model 3 Model 4 Model 1 Model 2 Model 3 Model 4
BASIS 0.40*** 0.27** 0.76*** 0.50*** 1.37*** 1.32***
[3.53] [2.35] [4.86] [3.27] [3.95] [4.43]
MKT -0.37 -0.24 -0.26 -0.38 -0.19 0.27 -1.15** -0.52 1.45** 0.76 2.24* 1.94***
[-0.77] [-0.47] [-0.65] [-0.89] [-0.41] [0.46] [-2.18] [-0.73] [1.96] [1.11] [1.68] [2.89]
SMB -0.14 -0.20 -0.19 -0.41 0.31 0.22 0.21 0.02 0.32 0.24 -0.16 0.45
[-0.47] [-0.69] [-0.66] [-1.48] [0.91] [0.66] [0.60] [0.06] [0.65] [0.53] [-0.21] [0.97] HML 0.64** 0.73*** 0.40* 0.55** 0.81** 1.12*** 0.82** 1.44*** -1.46*** -0.91** -0.90 -0.96***
[2.44] [2.68] [1.78] [2.26] [2.32] [2.62] [2.27] [2.95] [-3.51] [-2.48] [-1.38] [-2.71] DEF 0.12** 0.09* 0.07 0.01 0.17*** '0.00* 0.22*** 0.13* -0.06 -0.20 0.52*** 0.25** [2.31] [1.74] [1.36] [0.27] [3.01] [1.79] [3.70] [1.73] [-0.50] [-1.63] [4.87] [2.18] TERM 0.07 0.14 0.14 0.24** 0.49*** 0.55*** 0.51*** 0.50*** 0.61*** 0.68*** 0.37*** 0.46***
[0.74] [1.36] [1.49] [2.43] [4.03] [4.20] [4.16] [3.49] [4.46] [5.02] [2.75] [3.46]
LIQ 0.01 -0.07 0.05 -0.02 0.00 0.03 -0.02 0.05 0.11*** 0.07** 0.00 0.01
[0.15] [-0.92] [1.02] [-0.40] [0.06] [0.72] [-0.66] [1.27] [2.95] [2.09] [0.08] [0.41]
AMH -0.06 -0.15 -0.19** 0.08 -0.29** 0.22
[-0.50] [-1.28] [-2.21] [0.80] [-2.53] [1.12]
PS -0.02 -0.01 1.06 0.05* -0.06*** -0.03***
[-1.02] [-0.42] [0.02] [1.79] [-6.69] [-3.95]
N 151,966 151,966 151,966 151,966 151,966 151,966 151,966 151,966 151,966 151,966 151,966 151,966
R2 0.51 0.51 0.54 0.53 0.57 0.57 0.60 0.60 0.65 0.64 0.68 0.66
36 Table 5. Horse-race of the Basis Risk Factor versus Other New Risk Factors
The table reports the estimated risk premium on bond pricing factors, based on asset pricing tests using the basis factor as a new risk factor along with existing factors and other basis arbitrage-related factors. The test assets are twenty rating/maturity portfolios constructed by double-sorting bonds on their rating and maturity. The basis factor, BASIS, is defined as the k-day (k = 20, 40, 60) holding period (value-weighted) returns on the LMH portfolio (i.e., P1-P5), the portfolio of buying the lowest quintile basis portfolio and selling short the highest quintile basis portfolio as shown in Table 3. The existing risk factors are MKT, SMB, HML, TERM, DEF, LIQ, AMH, and PS. MKT is the cumulative excess daily market return from k-day horizon, SMB and HML are the cumulative daily returns of the SMB portfolio and the HML portfolio for k-day horizon, respectively. TERM is the difference between the daily return of the Barclays long-term government bond index and the daily T-bill return. DEF is the daily difference between the return of the Barclays long-term corporate bond index and that of the Barclays long-term government bond index. For TERM and DEF, daily values are cumulated to have the k-day value. LIQ is the level of bond market-level liquidity, measured as the sum of daily turnover for k-day horizon, which is computed as the total trading volume divided by the total number outstanding for all corporate bonds. AMH is the Amihud (2002) bond market liquidity risk factor, and PS is the Pastor-Stambaugh (2003) bond market liquidity risk factor. We also compute the value of liquidity risk factors for a time horizon of k. TED is the average of 3-month uncollateralized LIBOR rate minus 3-month T-bill rate, FINRET is the cumulative excess return of value-weighted financial firms’ equity returns, VIX is the average of SP500 option volatility. All factors are demeaned and are in percentage terms. All the systematic risk factors are measured based on data from day t-k to t and the returns on the twenty rating/maturity portfolios are measure based on data from day t to t+k. When estimating the betas, we employ the standard Fama-MacBeth procedure with a 240-day rolling window. The t-statistics are reported in square brackets. An ***, **, and * denotes significance at the 1%, 5%, and 10% level, respectively.
Model 1 Model 2 Model 3 Model 4 Model 1 Model 2 Model 3 Model 4 Model 1 Model 2 Model 3 Model 4 BASIS 0.50** 0.38*** 0.40*** 0.65*** 0.73*** 0.82*** 0.70*** 1.36*** 0.49 0.12 2.71*** 0.77*
[2.50] [2.84] [3.10] [3.29] [4.30] [5.11] [4.30] [2.65] [0.52] [0.11] [2.89] [1.78] MKT -0.79 -0.13 -0.03 -0.11 0.91*** -1.23** -0.44 -3.73 -0.73 -1.22 4.94 1.84
[-0.85] [-0.28] [-0.08] [-0.12] [-2.71] [-2.26] [-0.82] [-1.37] [-0.19] [-0.27] [1.58] [1.58]
SMB -0.11 0.24 0.08 0.25 0.61* 0.58* 0.7** -0.17 -1.82 -2.42 1.54 -0.65
[-0.29] [0.75] [0.25] [0.64] [1.70] [1.85] [1.98] [-0.40] [-0.78] [-0.93] [0.87] [-0.85]
HML 0.56 0.51 0.57 0.78 0.42 0.47 0.22 0.91 1.09 0.7 -3.31 -1.45
[1.94] [2.12] [2.41] [2.35] [1.09] [1.24] [0.59] [1.48] [0.52] [0.28] [-1.64] [-1.64] DEF 0.09 0.16 0.09 0.2 0.23*** 0.17*** 0.37*** 0.19 0.59*** 0.59*** 0.13 0.26*
[1.38] [2.87] [1.75] [2.78] [3.38] [2.65] [5.80] [0.88] [4.55] [5.08] [0.98] [1.82] TERM 0.03 0.02 0.09 -0.05 0.49*** 0.58*** 0.39*** 0.50*** 0.13 0.07 0.62*** 0.42** [0.31] [0.23] [0.90] [-0.49] [3.92] [4.68] [3.14] [3.39] [0.67] [0.31] [2.64] [2.40]
LIQ 0.05 0.09 0.12 0.16 -0.06* -0.06* -0.04 -0.06 -0.12 -0.08 0.16** 0.02
[0.53] [1.55] [1.98] [1.82] [-1.72] [-1.71] [-1.24] [-1.23] [-1.09] [-0.75] [2.03] [0.29]
AMH -0.36 -0.29 -0.05 -0.36 0.21* 0.17 0.03** -1.05 -0.44 -0.14 0.75 0.70**
[-2.79] [-2.23] [-0.39] [-2.25] [1.87] [1.56] [3.25] [-1.02] [-0.80] [-0.22] [1.24] [2.27]
TED -0.02 -0.03 0.01* 0.01 -0.02** -0.03***
[-0.72] [-1.30] [1.94] [1.37] [-2.29] [-2.90]
FINRET 1.02 0.99 -2.62*** -1.29* -5.24 -0.4
[2.04] [0.99] [-3.58] [-1.93] [-0.76]
VIX 0.05 -0.41 -0.55*** -0.87*** 0.03 0.30
[0.19] [-1.31] [-2.65] [-4.02] [0.10] [1.29]
N 151,966 151,966 151,966 151,966 151,966 151,966 151,966 151,966 151,966 151,966 151,966 151,966
R2 0.56 0.56 0.56 0.60 0.63 0.61 0.63 0.66 0.70 0.71 0.71 0.76