Characterization of a First-Pass Gradient-Echo
Spin-Echo Method to Predict Brain Tumor
Grade and Angiogenesis
Kathleen M. Schmainda, Scott D. Rand, Allen M. Joseph, Rebecca Lund, B. Doug Ward, Arvind P. Pathak, John L. Ulmer, Michael A. Baddrudoja, and Hendrikus G. J. Krouwer
BACKGROUND AND PURPOSE: No widespread clinical method provides specific informa-tion about the angiogenic characteristics of gliomas. We characterized blood volume and vascular morphologic parameters from combined gradient-echo (GE) and spin-echo (SE) MR imaging and assessed their relationship to tumor grade, a known correlate of glioma angiogenesis.
METHODS: Simultaneous GE and SE echo-planar imaging was performed with bolus gadolinium administration (0.20 – 0.25 mmol/kg) in 73 patients with glioma. To diminish possible T1 changes due to contrast agent extravasation, a preload (0.05– 0.10 mmol/kg) was administered before the study, and a postprocessing correction algorithm was applied. Image maps of total (GE) and microvascular (SE) relative cerebral blood volume (rCBV) and the mean vessel diameter (mVD) calculated from the ratio of GE and SE relaxation rate changes (⌬R2*/⌬R2) were compared with tumor grade. A nonparametricKnearest-neighbor decision rule was applied to determine if the combined data could be used to distinguish low-grade (I–II) from high-grade (III–IV) tumors on a per-patient basis.
RESULTS: For whole tumors, significant correlations were found between GE rCBV and grade (P< .0001) and between mVD and grade (Pⴝ.0001) but not between SE rCBV and grade (Pⴝ.08). For areas of highest SE rCBV (microvascular hotspots), SE rCBV and tumor grade were significantly correlated (Pⴝ.0007). In terms of differentiation, 69% of low-grade tumors and 96% of high-grade tumors were correctly classified.
CONCLUSION: Combined GE and SE MR imaging provides information consistent with neoplastic angiogenesis, demonstrating its potential to aid in optimizing treatments, catego-rizing lesions, and influencing patient care.
Although the incidence of brain tumors is only about 17,000 cases per year, they represent a considerable medical problem, as 60% of these tumors are malig-nant (1). Maligmalig-nant gliomas represent the second leading cause of cancer mortality in people younger than 35 years, the fourth leading cause in those younger than 54 years, and a leading cause of lost productivity in this population (2). Despite standard therapies such as surgery, radiation therapy, and
che-motherapy and despite the considerable effort spent to optimize such treatments, the median survival of patients with malignant gliomas ranges from 8 –9 months to 2–3 years. The most aggressive gliomas are those characterized by the formation of new blood vessels, a process called angiogenesis. Tumor angio-genesis is a pathophysiologic process that has been linked to tumor viability, as well as tumor grade (3, 4). Consequently, a noninvasive measure of these param-eters offers the potential to optimize treatments, cat-egorize lesions, and influence their management. In addition, the noninvasive assessment of angiogenesis could provide a way to efficiently evaluate new drugs that inhibit angiogenesis (i.e., antiangiogenic agents) (5– 8), which are particularly promising alternatives for patients with these tumors.
The current practice of obtaining contrast-en-hanced MR images of brain tumors does not provide specific information about tumor angiogenesis, be-cause most contrast agents in current clinical use
Received September 2, 2003; accepted after revision February 20, 2004.
From the Departments of Radiology (K.M.S., S.D.R., J.L.U.), Biophysics (K.M.S., A.M.J., R.L., B.D.W., A.P.P.), and Neurology and Neurosurgery (M.A.B., H.G.J.K.), Medical College of Wiscon-sin, and the Department of Biomedical Engineering, Marquette University (A.M.J., R.L., A.P.P.), Milwaukee, WI.
Address reprint requests to Kathleen M. Schmainda, PhD, Med-ical College of Wisconsin, Department of Biophysics, 8701 Water-town Plank Rd, Milwaukee, WI 53226.
©American Society of Neuroradiology
highlight disruptions in the blood-brain barrier. Al-ternatively, dynamic susceptibility contrast-enhanced MR imaging methods, which allow the creation of cerebral blood volume (CBV) maps, have the poten-tial to provide more specific information about vas-cular morphology and physiology. With this ap-proach, a bolus of a gadolinium-chelated contrast agent is administered to induce a gradient of suscep-tibility between the contrast agent– containing vessel and tissue. Image signal intensity, which transiently decreases (9), is converted into a relaxation rate change, which is assumed to be proportional to the fraction of blood volume within each image pixel. Since the arterial contrast agent concentration is typ-ically not measured, the resulting image maps show relative (regional) CBV (rCBV) values and are there-fore referred to as rCBV maps. Several laboratories have demonstrated the feasibility of determining rCBV in patients with brain tumors (10 –22). Prelim-inary findings suggest that MR imaging-derived rCBV may better differentiate histologic tumor types than conventional MR imaging and may provide in-formation to predict glial tumor grade (10, 12, 14, 19, 21, 23–29). In addition, rCBV maps may aid in the differentiation of post-treatment changes from tumor recurrence (15, 22, 30) and be predictive of early local recurrence or malignant transformation (31).
Although the standard approach has been to acquire rCBV maps by using either gradient-echo (GE) or spin-echo (SE) imaging methods, our approach was to ac-quire GE and SE rCBV maps simultaneously. The ra-tionale for this approach is based on numerical simulations (32, 33) and measurements (34) indicating that SE and GE images have different sensitivities to the size scale of field inhomogeneities, resulting in a differ-ential sensitivity to vessel diameter. Consequently, SE changes are assumed to be maximally sensitive to the microvascular blood volume (vessel diameters less than about 25m), whereas GE changes are sensitive to total blood volume. Although microvascular den-sity has been the histologic criterion standard for assessing the degree of angiogenesis, one may hypoth-esize that SE rCBV maps may be more clinically useful for in vivo monitoring.
In addition to obtaining total and microvascular blood volume maps, GE and SE information can be combined to provide an index of vessel diameter. An animal tumor model demonstrated that the ratio of GE and SE relaxation rates (⌬R2*/⌬R2), measured in the presence of a long-lived intravascular contrast agent, is significantly correlated with vessel diameter (35, 36). The feasibility of determining this ratio in patients by using a gadolinium-chelated contrast agent has been suggested in an initial pilot study (19). The purpose of this study was to characterize the parameters derived from combined GE and SE dy-namic susceptibility contrast-enhanced MR imaging and their relationship to tumor grade. Given the known relationship between tumor grade and angio-genesis (3), this may serve as a first step in determin-ing the role of this approach in the evaluation of
angiogenesis as well as conventional and antiangio-genic therapies.
Methods
Patients
Patients with suspected cerebral neoplasm owing to prior imaging findings or a history of a biopsy-proved neoplasm were referred for rCBV studies. Patients who elected not to partic-ipate or who were too ill to remain still during imaging were excluded. All patients who underwent rCBV mapping provided informed written consent under guidelines approved by our institutional review board. Studies were excluded if a tissue diagnosis was not available or did not reveal a glioma, if they were follow-up rCBV studies (as we were limiting this investi-gation to one rCBV study per patient), or if the data were corrupted by patient motion or an archive error that precluded postprocessing.
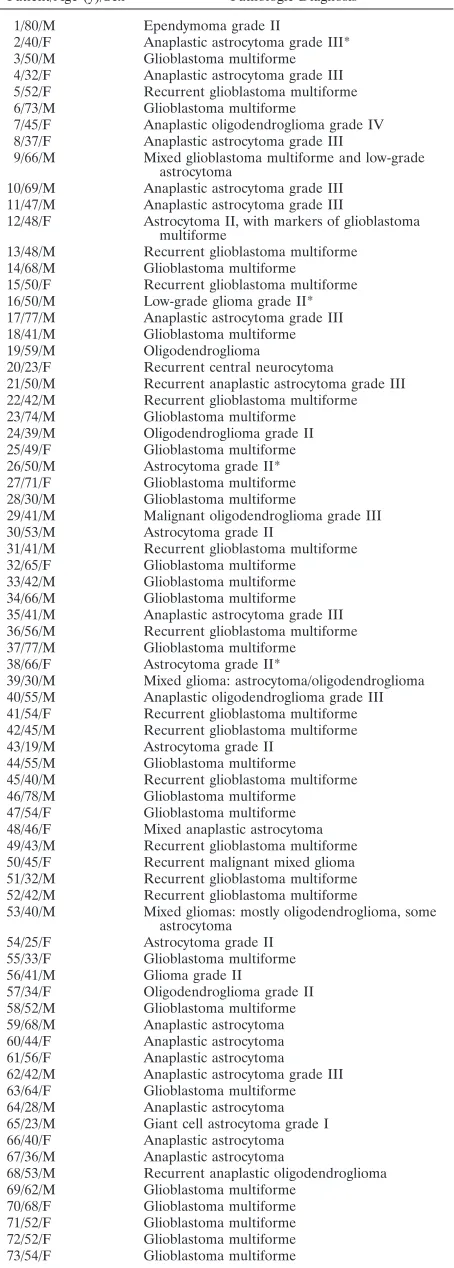
Given these criteria, results from 73 patients with confirma-tion of tissue diagnosis were evaluated. The Table lists the age, sex, and pathologic diagnosis for all patients who had tissue confirmation of the diagnosis. The patient group consisted of 46 men and 27 women, with an age range of 19 – 80 years. Tumors were classified and graded according to the World Health Organization (WHO) 1993 classification (37). With respect to the astrocytoma, a four-tiered system was applied. At our institution, oligodendroglial subtypes are graded with a similar four-tiered system, and one oligodendroglial tumor was indeed given grade IV, as it demonstrated all the features of a glioblastoma but with a strong preponderance of oligodendro-glial neoplastic cells (Table, patient 7). The ependymoma in our series was a grade II lesion. It demonstrated some foci of necrosis and mitoses, although not necessarily indicative of malignancy. One grade I lesion was included in this series (Table, patient 65). The grade II tumors included one ependy-moma, 10 astrocytomas, three oligodendrogliomas, and one neurocytoma. The grade III tumors included 16 anaplastic astrocytomas and two malignant oligodendrogliomas. The grade IV tumors included 38 de novo and recurrent glioblas-toma multiforme and one anaplastic oligodendroglioma.
MR Imaging
Data Analysis
Using image analysis programs developed at our institution, we simultaneously collected GE and SE data, which were reconstructed and divided into individual image datasets for GE and SE signal intensity time course data for each image section. Both GE and SE rCBV maps (corrected for contrast agent extravasation) and ratio (⌬R2*/⌬R2) maps were created from these data (19). Only the corrected rCBV and ratio maps are presented herein.
From these maps, rCBV, and ratio data were extracted from regions of interest (ROIs) placed in the whole tumor, in con-tralateral (reference) brain, and in tumor hot spots, as deter-mined from the SE rCBV maps. Areas of necrosis, as visualized on contrast-enhanced T1-weighted images, were not included in the tumor ROIs. The reference brain ROIs were placed in the same location on the side opposite the tumor, either in the left-right or anterior-inferior directions depending on the loca-tion of the tumor. The goal was for the reference brain ROIs to contain approximately the same amount of gray matter and white matter as would be in the tumor area. The hot-spot ROIs, which were visually chosen, represented the highest 10 –20% of SE rCBV values (Fig 1). This subjective approach was chosen to emulate the standard method of assessing an-giogenesis (i.e., counting only microvessels from areas of high-est microvessel density) (4). The tumor rCBV and ratio results are presented as normalized to those in contralateral brain.
A statistical correlation between the MR imaging– derived parameters and histopathologic tumor grade was determined with the Spearman rank correlation test, by usingP⫽.05 as the significance threshold. In addition, a nonparametric K-nearest-neighbor decision rule (39), withk⫽5, was applied to deter-mine whether the GE and SE data could be used to distinguish low-grade (I–II) from high-grade (III–IV) tumors on a per-patient basis.
Results
Figure 2 shows examples of T1-weighted, contrast-enhanced images, along with GE rCBV, SE rCBV, and ratio image maps for two patients: one with an anaplastic oligodendroglioma and the other with gli-oblastoma multiforme. These results demonstrated the general finding of this study (i.e., more aggressive tumors had higher blood volumes and larger vessel diameters, as indicated by the GE rCBV and ratio maps). Contrast enhancement in the anaplastic oligo-dendroglioma was negligible, but the increase in blood volume and ratio was obvious. As is well known, T1-weighted images demonstrate contrast enhancement only when the blood-brain barrier is disrupted. Al-though tumor vessels are often highly permeable, this is not always the case as demonstrated here (Fig 2). Fur-thermore, the blood-brain barrier can be altered by steroid treatment, a common part of the treatment reg-imen for patients with brain tumors. Consequently, con-trast-enhanced T1-weighted images do not provide re-liable information about tumor angiogenesis.
Results from 72 of the 73 patients are presented here. Four of the 73 cases had a tissue diagnosis based on biopsy findings rather than total or partial surgical resection. (These are indicated by asterisks in the Table.) Patient 18 had vascular thrombosis, as visual-ized during surgery, which explained the apparent lack of contrast agent distribution in the tumor area Patient histology and imaging results
Patient/Age (y)/Sex Pathologic Diagnosis
1/80/M Ependymoma grade II
2/40/F Anaplastic astrocytoma grade III* 3/50/M Glioblastoma multiforme 4/32/F Anaplastic astrocytoma grade III 5/52/F Recurrent glioblastoma multiforme 6/73/M Glioblastoma multiforme
7/45/F Anaplastic oligodendroglioma grade IV 8/37/F Anaplastic astrocytoma grade III
9/66/M Mixed glioblastoma multiforme and low-grade astrocytoma
10/69/M Anaplastic astrocytoma grade III 11/47/M Anaplastic astrocytoma grade III
12/48/F Astrocytoma II, with markers of glioblastoma multiforme
13/48/M Recurrent glioblastoma multiforme 14/68/M Glioblastoma multiforme 15/50/F Recurrent glioblastoma multiforme 16/50/M Low-grade glioma grade II* 17/77/M Anaplastic astrocytoma grade III 18/41/M Glioblastoma multiforme 19/59/M Oligodendroglioma
20/23/F Recurrent central neurocytoma
21/50/M Recurrent anaplastic astrocytoma grade III 22/42/M Recurrent glioblastoma multiforme 23/74/M Glioblastoma multiforme 24/39/M Oligodendroglioma grade II 25/49/F Glioblastoma multiforme 26/50/M Astrocytoma grade II* 27/71/F Glioblastoma multiforme 28/30/M Glioblastoma multiforme
29/41/M Malignant oligodendroglioma grade III 30/53/M Astrocytoma grade II
31/41/M Recurrent glioblastoma multiforme 32/65/F Glioblastoma multiforme 33/42/M Glioblastoma multiforme 34/66/M Glioblastoma multiforme 35/41/M Anaplastic astrocytoma grade III 36/56/M Recurrent glioblastoma multiforme 37/77/M Glioblastoma multiforme 38/66/F Astrocytoma grade II*
39/30/M Mixed glioma: astrocytoma/oligodendroglioma 40/55/M Anaplastic oligodendroglioma grade III 41/54/F Recurrent glioblastoma multiforme 42/45/M Recurrent glioblastoma multiforme 43/19/M Astrocytoma grade II
44/55/M Glioblastoma multiforme 45/40/M Recurrent glioblastoma multiforme 46/78/M Glioblastoma multiforme 47/54/F Glioblastoma multiforme 48/46/F Mixed anaplastic astrocytoma 49/43/M Recurrent glioblastoma multiforme 50/45/F Recurrent malignant mixed glioma 51/32/M Recurrent glioblastoma multiforme 52/42/M Recurrent glioblastoma multiforme
53/40/M Mixed gliomas: mostly oligodendroglioma, some astrocytoma
54/25/F Astrocytoma grade II 55/33/F Glioblastoma multiforme 56/41/M Glioma grade II
57/34/F Oligodendroglioma grade II 58/52/M Glioblastoma multiforme 59/68/M Anaplastic astrocytoma 60/44/F Anaplastic astrocytoma 61/56/F Anaplastic astrocytoma 62/42/M Anaplastic astrocytoma grade III 63/64/F Glioblastoma multiforme 64/28/M Anaplastic astrocytoma 65/23/M Giant cell astrocytoma grade I 66/40/F Anaplastic astrocytoma 67/36/M Anaplastic astrocytoma
68/53/M Recurrent anaplastic oligodendroglioma 69/62/M Glioblastoma multiforme
70/68/F Glioblastoma multiforme 71/52/F Glioblastoma multiforme 72/52/F Glioblastoma multiforme 73/54/F Glioblastoma multiforme
[image:3.585.55.282.81.715.2]during imaging. Therefore, the data from that study were not included in subsequent analyses. In five of 72 cases, only GE data were obtained because of an error in setting the SE parameters.
Data from whole tumor, normalized to data in
contralateral brain, are given in Figure 3. While sig-nificant correlations with grade were found for GE rCBV (P⬍ .0001,rs⫽ 0.52,n ⫽ 72) and ratio data (P ⫽ .0001, rs ⫽ 0.46, n ⫽ 67), the correlation be-tween SE rCBV and tumor grade was not significant
FIG 1. Sample SE rCBV map shows hot-spot ROIs (black outlinesandarrows), which represent the highest approximate 10 –20% of microvascular rCBVs. These were used to mask the image maps and perform hot-spot analysis.
FIG 2. T1-weighted contrast-enhanced images (aande) GE rCBV maps (bandf), SE rCBV maps (candg), and ratio maps (dandh) obtained in a 53-year-old man with an anaplastic oligodendroglioma (a– d) and a 55-year-old man with a glioblastoma multiforme (e– h).
FIG 3. Whole-tumor ROI analysis for gliomas.
A, GE rCBV, which is sensitive to total blood volume, is sig-nificantly correlated with tumor grade (n⫽72).
B, Conversely, SE rCBV, which is sensitive to microvascular blood volume, is not significantly correlated with tumor grade (n⫽67).
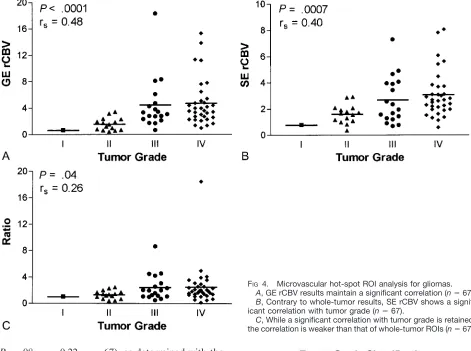
(P⫽ .08,rs ⫽0.22,n⫽ 67), as determined with the Spearman rank correlation test. Interestingly, when we considered only microvascular hot spots (Fig 4), a significant correlation with grade emerged for SE rCBV data (P⫽.0007,rs⫽0.40,n⫽67). Although the correlation remained significant for GE rCBV data (P ⬍ .0001, rs ⫽ 0.48, n ⫽ 67), mean vessel diameter (mVD) was only weakly correlated with tumor grade (P ⫽ .03, rs ⫽ 0.26, n ⫽ 67) when we considered tumor microvascular hot spots. (Hot-spot analysis was done for 67 of 72 patients in whom GE data were collected, because SE data were not avail-able for five, and SE rCBV maps were needed to determine hot-spot microvascular ROIs.)
When we applied the Knearest-neighbor decision rule (k⫽ 5) on the combined GE and SE data, 11 (69%) of 16 low-grade tumors were correctly classi-fied, and 49 (96%) of 51 high-grade tumors were correctly classified (Fig 5). Of five low-grade tumors that were misclassified with this algorithm, two had a tissue diagnosis based on biopsy samples. (These data points are indicated by thearrowsin Fig 5.) Findings in patient 38 (long arrowin Fig 5) revealed the infor-mation that rCBV mapping may add to that obtained with standard imaging and tissue diagnosis methods. For this patient, the tumor diagnosis based on CT-guided biopsy was low-grade astrocytoma. However, GE rCBV and mVD values were greater than the means of the low-grade group. Consistent with the rCBV finding, the clinical course of the tumor was
aggressive. In fact, the patient died just 1 year after the rCBV study, the results of which are shown in Figure 6. These results suggest that MR rCBV infor-mation may improve the accuracy of diagnosis and help in directing the site of biopsy to ensure accurate representation.
FIG 5. SE rCBV data as a function of GE rCBV data. TheK nearest-neighbor analysis (K⫽5) resulted in correct classifica-tion of five (69%) of 16 grade I–II tumors (circles) and 49 (95%) of 51 grade III–IV tumors (squares).Asteriskindicates misclassified data points; the arrows indicate two low-grade tumors where diagnosis was based on biopsy.
FIG 4. Microvascular hot-spot ROI analysis for gliomas.
A, GE rCBV results maintain a significant correlation (n⫽67).
B, Contrary to whole-tumor results, SE rCBV shows a signif-icant correlation with tumor grade (n⫽67).
[image:5.585.58.529.61.412.2] [image:5.585.309.532.410.593.2]Discussion
We demonstrated that, for whole tumors exclusive of any central cystic or necrotic core, total and micro-vascular blood volume are increased relative to con-tralateral brain, and mVD is enlarged. These findings are consistent with neoplastic angiogenesis that may follow an initial period of vascular cooption (40). For whole tumors, total blood volume and mVD are pre-dictive of tumor grade, whereas the microvascular blood volume is not. However, when we considered tumor microvascular hot spots, the microvascular blood volume was predictive of tumor grade. This finding is consistent with those of previous imaging studies in which SE rCBV techniques alone were used (12, 21), and those in which the standard histologic approach of using the highest microvessel count to predict tumor angiogenesis and grade was applied (4, 41). In contrast, the ratio was only weakly correlated with grade when we considered only SE rCBV hot spots. This result is consistent with the idea that the GE-SE ratio is a marker of mVD. Therefore, when we look at hot spots only, we are preselecting for vessels within a certain range of diameters (i.e., those to which SE is primarily sensitive). Thus, in this case, a strong correlation between the ratio (mVD) and tumor grade is not expected.
Although a strong correlation with grade was noted for several of the MR imaging parameters, there was also an obvious amount of overlap between the grade categories. Therefore, to begin to assess whether this combined information could distinguish tumor grade on a per-patient basis, K nearest-neighbor analysis was applied. A fairly good distinction between the low- and high-grade tumors emerged, indicating that combined GE-SE data has promise to provide rele-vant information on a per-patient basis. However, while 96% of high-grade tumors were correctly
clas-sified, only 69% of low-grade tumors were. It is likely that classification accuracy for low-grade tumors will improve, as thistraining dataset includes many more low-grade tumors. This is the advantage of an ap-proach like this. No assumptions were made regard-ing underlyregard-ing distributions; rather, real data were used to dictate future classifications. Yet, this ap-proach relied on an accurate pathologic diagnosis. It is well known that the current tumor grading system has inherent difficulties.
Regarding the classification of astrocytic tumors according to the WHO system (37), an astrocytoma is a generic term applied to diffusely infiltrating tumors composed of well-differentiated neoplastic astrocytes. An anaplastic (malignant) astrocytoma has focal or diffuse anaplasia defined as increased cellularity, pleo-morphism, nuclear atypia, and mitotic activity, for example. The presence of prominent vascular prolif-eration or necrosis, or both, is essential for the diag-nosis of glioblastoma. Here, vascular proliferation is considered to be multilayered endothelial cell prolif-eration, not quantitative determination of the number of vessels (i.e., microvessel count [MVC]). Although MVC is strongly correlated with grade in brain tu-mors (4), it is not used in establishing diagnosis. However, as more and better molecular diagnostic approaches become available, the WHO grading scheme for tumor classification will continue to be updated (42).
Sampling is a significant problem in the study of surgically excised gliomas (43). Therefore, some le-sions designated as anaplastic astrocytoma might, and probably do, contain necrosis (a key criterion used to distinguish glioblastoma multiforme from anaplastic astrocytoma) in tissue not excised or submitted for microscopic study. Furthermore, tissue diagnosis based on biopsy alone has an even greater likelihood of misdiagnosis because of incomplete tissue sam-pling. Therefore, the classification accuracy of our approach would likely improve if the surgically sam-pled tissue and rCBV image values were spatially matched by means of stereotactic correlation.
Although these tumors were graded by using the WHO system, they are actually a heterogeneous group of lesions within each grade. Consequently, it is not surprising that some lesions respond to some therapies, other lesions respond to other therapies, and still other lesions respond to no therapy, although all have the same grade. The advantage of noninva-sively obtaining information about the entire tumor cannot be overstated. At the least, MR imaging mea-sures of vascular parameters should aid in the selec-tion of biopsy and excision sites, guiding the surgeon to the areas of most aggressive tumor.
Capturing the spatially heterogeneous nature of the growing tumor has the additional advantage of providing information about the angiogenic changes and mechanisms, which should aid in accurately eval-uating and optimizing new therapies (44). The grow-ing tumor front, typically at the tumor periphery, is characterized by an increase in the number of mi-crovessels, whereas larger glomerular vessels, which
often are associated with more advanced tumors (40), are found more centrally (but not in areas of necro-sis). In addition to being invasive and having the same tissue sampling errors described earlier, microvessel-counting methods tend to cause underestimation of the number of microvessels because of the presence of these glomeruloid vascular structures (4). In the MVC, the glomeruloid vascular structures are counted as a single brown-staining cluster, despite the fact that several individual microvascular lumens could have existed within the cluster. Alternatively, SE or GE MR imaging methods used alone empha-size different vessel populations. Consequently, tu-mor diagnosis could benefit from a technique, such as the GE and SE techniques used in this study, to provide spatially specific information about both mi-crovascular growth and the existence of larger glo-merular vessels.
In addition, evaluating changes in vessel diameter over time may potentially aid in optimizing the choice and timing of therapy. The concept that a measure of tumor vascular morphological findings is an impor-tant indicator of the tumor angiogenic process and possibly a predictor of tumoral response to therapy is becoming increasingly evident. Changes in vascular architecture have been shown to occur, with tumor growth paralleling the balance of angiogenic growth factors (40). Distinct differences in vessel morpholog-ical findings have been observed among tumors formed by cells expressing three different isoforms of the vascular endothelial growth factor (45), an impor-tant angiogenic growth factor in brain tumors (46). Also, vascular morphological findings have been shown to vary with tumor type, tumor site, and type or timing of conventional or antiangiogenic treatment (7, 8, 47–50). Whether a therapy proves successful is largely the result of choosing to inhibit the right growth factor responsible for tumor angiogenesis (51).
In addition to providing a noninvasive way to eval-uate angiogenesis and antiangiogenic therapies, the GE and SE parameters can potentially affect a broader range of clinical applications and problems. For example, low-grade tumors commonly convert to higher-grade tumors focally located within larger low-er-grade tumor beds. This is difficult to identify with standard imaging unless new focal enhancement or increased edema or growth of the mass is present. Given that the GE and SE parameters are correlated with tumor grade, this may be a marker of conversion that may direct biopsy for confirmation. Also, the GE and SE parameters may serve as indicators of recur-rence and also differentiate between radiation necro-sis and recurrent neoplasms. These parameters, in conjunction with findings from MR spectroscopy and CT or positron emission tomography, offer a poten-tially powerful set of tools to detect and confirm biopsy results and treat recurrent disease. Moreover, the distinction between the microvasculature and ma-crovasculature and the location of neovascularity could be useful in preoperative planning to avoid undue hemorrhage. For example, larger vessels may
be easier to cauterize during surgery than those in a hypervascular microvascular bed.
The accuracy of classification may also improve as our characterization and optimization of the MR im-aging dynamic susceptibility methods improve (19, 52–57). For example, while it is assumed that the relationships between the T2 and T2* relaxation rates and tissue contrast agent concentration are indepen-dent of dose, tissue type, and condition in the healthy brain, this assumption has yet to be validated for tumor tissue (52, 58). Another source of error was the confounding T1 effect that results when contrast agent leaks out of the vessels; this occurs when the blood-brain barrier is disrupted and is often the case in tumors. Susceptibility methods, like the one used in this study, rely on compartmentalization of the con-trast agent within the vessels. In this regard, we made great efforts to diminish the effects of contrast agent extravasation by using a preload dose of contrast agent and by performing postprocessing steps to cor-rect for this leakage. As we previously demonstrated, this postprocessing step is critical; if it is not used, the correlation between rCBV and tumor grade is lost (19, 59, 60). Besides enhancing the T1 effect, contrast agent leakage may result in an apparently larger sus-ceptibility compartment, resulting in an overestima-tion of blood volume and mVD. Determinaoverestima-tion of the importance of these issues in first-pass studies re-quires further study. However, the eventual approval of large-molecular-weight, intravascular susceptibili-ty-based contrast agents for clinical use should elim-inate these concerns (61).
Conclusion
The combined dynamic GE and SE MR imaging approach we describe herein has the potential to provide another diagnostic feature with which tumors can be more completely evaluated, with the promise of doing so on an individualized basis. Accordingly, the multiparametric measurements with differing sen-sitivities to vessel diameter should supplement histo-logic diagnosis and aid in monitoring and elucidating the actions of the various antiangiogenic inhibitors alone or combined with conventional therapies, thereby influencing patient care.
References
1. 1996 Annual Report. Central Brain Tumor Registry for the United States.1996
2. Third National Cancer Survey.US National Cancer Institute; 1989 3. Leon SP, Folkerth RD, Black P.Microvessel density is a prognostic indicator for patients with astroglial brain tumors. Cancer 1996;77:362–372
4. Assimakopoulou M, Sotiropoulou-Bonikou G, Maraziotis T, Pa-padakis N, Varakis I.Microvessel density in brain tumors. Anti-cancer Res1997;17:4747– 4754
5. Bello L, Carraba G, Giussani C, et al.Low-dose chemotherapy combined with antiangiogenic drug reduces human glioma growth in vivo.Cancer Res2001;61:7501–7506
6. Bergers G, Javaherian K, Lo K, Folkman J, Hanahan D.Effects of angiogenesis inhibitors on multistage carcinogenesis in mice. Sci-ence1999;284:808 – 812
De-layed vascular changes after angiogenic therapy with antivascular endothelial growth factor antibodies in human glioma xenografts in nude mice.Neurosurgery1998;43:570 –576
8. Bernsen HJ, Rijken PF, Peters JP, et al. Suramin treatment of human glioma xenografts; effects on tumor vasculature and oxy-genation status.J Neuro-Oncol1999;44:129 –136
9. Rosen BR, Belliveau JW, Vevea JM, Brady TJ.Perfusion imaging with NMR contrast agents.Magn Reson Med1990;14:249 –265 10. Maeda M, Itoh S, Kimura H, et al.Tumor vascularity in the brain:
evaluation with dynamic susceptibility-contrast MR imaging. Ra-diology1993;189:233–238
11. Aronen HJ, Cohen MS, Belliveau JW, Fordham JA, Rosen BR.
Ultrafast imaging of brain tumors. Top Magn Reson Imaging 1993;5:14 –24
12. Aronen HJ, Gazit IE, Louis DN, et al.Cerebral blood volume maps of gliomas: comparison with tumor grade and histologic findings.
Radiology1994;191:41–51
13. Guckel F, brix G, Rempp K, Deimling M, Rother J, Georgi M.
Assessment of cerebral blood volume with dynamic susceptibility contrast enhanced gradient-echo imaging.J Comput Assist Tomogr 1994;18:344 –351
14. Bruening R, Kwong KK, Vevea MJ, et al.Echo-planar MR deter-mination of relative cerebral blood volume in human brain tumors: T1 versus T2 weighting.AJNR Am J Neuroradiol1996;17:831– 840 15. Siegal T, Rubinstein R, Tzuk-Shina T, Gomori JM. Utility of relative cerebral blood volume mapping derived from perfusion magnetic resonance imaging in the routine follow up of brain tumors.J Neurosurg1997;86:22–27
16. Boxerman JL, Rosen BR, Weisskoff RM.Signal-to-noise analysis of cerebral blood volume maps from dynamic NMR imaging stud-ies.J Magn Reson Imaging1997;7:528 –537
17. Hacklander T, Reichenbach JR, Modder U.Comparison of cere-bral blood volume measurements using the T1 and T2* methods in normal human brains and brain tumors.J Comput Assist Tomogr 1997;21:857– 866
18. Hou L, Yang Y, Mattay VS, Frank JA, Duyn JH.Optimization of fast acquisition methods for whole-brain relative cerebral blood volume (rCBV) mapping with susceptibility contrast agents.
J Magn Reson Imaging1999;9:233–239
19. Donahue KM, Krouwer HGJ, Rand SD, et al.Utility of simulta-neously acquired gradient-echo and spin-echo cerebral blood vol-ume and morphology maps in brain tumor patients.Magn Reson Med2000;43:845– 853
20. Zhu XP, Li KL, Kamaly-Asl ID, et al.Quantification of endothelial permeability, leakage space, and blood volume in brain tumors using combined T1 and T2* contrast-enhanced dynamic MR im-aging.J Magn Reson Imaging2000;11:575–585
21. Aronen HJ, Pardo FS, Kennedy DN, et al. High microvascular blood volume is associated with high glucose uptake and tumor angiogenesis in human gliomas.Clin Cancer Res2000;6:2189 –2200 22. Sugahara T, Jorogi Y, Tomiguchi S, et al. Posttherapeutic in-traaxial brain tumor: the value of perfusion-sensitive contrast-enhanced MR imaging for differentiating tumor recurrence from nonneoplastic contrast-enhancing tissue.AJNR Am J Neuroradiol 2000;21:901–909
23. Sugahara T, Korogi Y, Kochi M, Ushio Y, Takahashi M. Perfusion-sensitive MR imaging of gliomas: comparison between gradient-echo and spin-gradient-echo gradient-echo-planar imaging techniques.AJNR Am J Neuroradiol2001;22:1306 –1315
24. Law M, Yang S, Wang H, et al.Glioma grading: sensitivity, spec-ificity and predictive values of perfusion MR imaging and proton MR spectroscopic imaging compared to conventional imaging.
AJNR Am J Neuroradiol2003;24:1989 –1998
25. Knopp EA, cha S, Johnson G, et al. Glial neoplasms: dynamic contrast-enhanced T2*-weighted MR imaging.Radiology1999;211: 791–798
26. Lam WW, Chan KW, Wong WL, Poon WS, Metreweli C. Pre-operative grading of intracranial glioma.Acta Radiol2001;42:548 –554 27. Yang D, Korogi Y, Sugahara T, et al.Cerebral gliomas: prospective comparison of multivoxel 2D chemical-shift imaging proton MR spectroscopy, echoplanar perfusion and diffusion-weighted MRI.
Neuroradiology2002;44:656 – 666
28. Kremer S, Grand S, Remy C, et al.Cerebral blood volume mapping by MR imaging in the initial evaluation of brain tumors.J Neuro-radiol2002;29:105–113
29. Sugahara T, Korogi Y, Shigematsu Y, et al.Value of dynamic suscep-tibility contrast magnetic resonance imaging in the evaluation of intracranial tumors.Top Magn Reson Imaging1999;10:114 –124
30. Cha S, Knopp EA, Johnson G, et al.Dynamic contrast-enhanced T2-weighted MRI imaging of recurrent malignant gliomas treated with thalidomide and carboplatin. AJNR Am J Neuroradiol 2000;21:881– 890
31. Fuss M, Wenz F, Essig M, et al.Tumor angiogenesis of low-grade astrocytomas measured by dynamic susceptibility contrast-en-hanced MRI (DSC-MRI) is predictive of local tumor control after radiation therapy.Int J Radiat Oncol Biol Physics2001;51:478 – 482 32. Fisel CR, Ackerman JL, Buxton RB, et al.MR contrast due to microscopically heterogeneous magnetic susceptibility: numerical simulations and applications to cerebral physiology.Magn Reson Med1991;17:336 –347
33. Boxerman JL, Hamberg LM, Rosen BR, Weisskoff RM.MR con-trast due to intravascular magnetic susceptibility perturbations.
Magn Reson Med1995;34:555–566
34. Majumdar S, Zoghbi S, Gore JC.The influence of pulse sequence on the relaxation effects of superparamagnetic iron oxide contrast agents.Magn Reson Med1989;10:289 –301
35. Dennie J, Mandeville JB, Boxerman JL, Packard SD, Rosen BR, Weisskoff RM.NMR imaging of changes in vascular morphology due to tumor angiogenesis.Magn Reson Med1998;40:793–799 36. Tropres I, Grimault S, Vaeth A, et al.Vessel size imaging.Magn
Reson Med2001;45:397– 408
37. Kleihues P, Burger PC, Scheithauer BW.Histological Typing of Tu-mours of the Central Nervous System.New York: Springer-Verlag, 1993 38. Weisskoff RM, Boxerman JL, Sorensen AG, Kulke SM, Campbell TA, Rosen BR.Simultaneous blood volume and permeability map-ping using a single Gd-based contrast injection.Presented at: 2nd Annual Meeting of the Society of Magnetic Resonance in Medi-cine; 1997; San Francisco, CA
39. Webb A.Statistical Pattern Recognition.New York: Oxford Univer-sity Press, 1999
40. Holash J, Maisonpierre PC, Compton D, et al. Vessel cooption, regression, and growth in tumors mediated by angiopoietins and VEGF.Science1999;284:1994 –1998
41. Plate KH, Mennei HD.Vascular morphology and angiogenesis in glial tumors.Exp Toxicol Pathol1995;47:89 –94
42. Kleihues P, Louis DN, Scheithauer BW, et al.The WHO classifi-cation of tumors of the nervous system.J Neuropathol Exp Neurol 2002;61:215–225
43. Burger PC, Vogel FS, Green SB, Strike TA.Glioblastoma multi-forme and anaplastic astrocytoma: pathologic criteria and prog-nostic implications.Cancer1985;56:1106 –1111
44. Vajkoczy P, Menger MD.Vascular microenvironment in gliomas.
J Neuro-Oncol2000;50:99 –108
45. Guo P, Xu L, Pan S, et al.Vascular endothelial growth factor isoforms display distinct activities in promoting tumor angiogen-esis at different anatomic sites.Cancer Res2001;61:8569 – 8577 46. Plate KH, Breier G, Weich HA, Mennel HD, Risau W.Vascular
endothelial growth factor and glioma angiogenesis: coordinate induc-tion of VEGF receptors, distribuinduc-tion of VEGF protein and possible in vivo regulatory mechanisms.Int J Cancer1994;59:520 –529 47. Yuan F, Chen Y, Dellian M, Safabakhsh N, Ferrara N, Jain RK.
Time-dependent vascular regression and permeability changes in established human tumor xenografts induced by an antivascular endothelial growth factor/vascular permeability factor antibody.
Proc Natl Acad Sci1996;93:14765–14770
48. Allegrini PR, Muller-Driver R, Wittig C, Konerding M, Drevs J, Wood J. Effect of PTK787, a specific VEGF receptor tyrosine kinase inhibitor, on anatomy, density and permeability of tumor vessels in murine renal cell carcinoma (RENCA).Presented at: 10th Annual Meeting of the International Society of Magnetic Resonance in Medicine; 2002; Honolulu, HI
49. Teicher BA, Dupuis N, Kusomoto T, et al.Antiangiogenic agents can increase tumor oxygenation and responses to radiation ther-apy.Radiat Oncol Invest1995;2:269 –276
50. Kakeji Y, Teicher BA.Preclinical studies of the combination of angiogenic inhibitors with cytotoxic agents. Invest New Drugs 1997;15:39 – 48
51. Novak K.Angiogenesis inhibitors revised and revived at AACR.
Nat Med2002;8:427
52. Kiselev VG.On the theoretical basis of perfusion measurements by dynamic susceptibility contrast MRI. Magn Reson Med2001;46: 1113–1122
53. Pathak AP, Schmainda KM, Ward BD, Linderman JR, Rebro KJ, Greene AS.MR-derived cerebral blood volume maps: issues re-garding histological validation and assessment of tumor angiogen-esis.Magn Reson Med2001;46:735–747
singular value decomposition.Mag Reson Med2000;44:466 – 473 55. Pathak AP, Ward BD, Rebro KJ, Schmainda KM.The effect of
brain tumor angiogenesis on the in vivo relationship between con-trast agent (MION) and the gradient-echo relaxation rate change (DR2*).Presented at: 10th Annual Meeting of the International Society of Magnetic Resonance in Medicine; 2002; Honolulu, HI 56. Perkio J, Aronen HJ, Kangasmaki A, et al. Evaluation of four
postprocessing methods for determination of cerebral blood vol-ume and mean transit time by dynamic susceptibility contrast imaging.Magn Reson Med2002;47:973–981
57. Cha S, Knopp EA, Johnson G, Wetzel SG, Litt AW, Zagzag D.
Intracranial mass lesions: dynamic contrast-enhanced susceptibil-ity-weighted echo-planar perfusion MR imaging. Radiology 2002;223:11–29
58. Pathak AP, Rand SD, Schmainda KM.The effect of brain tumor angiogenesis on the in vivo relationship between the gradient-echo relaxation rate change (⌬DR2*) and contrast agent (MION) dose.
J Magn Reson Imaging2003;18:397– 403
59. Schmainda KM, Rand SD, Joseph AM, et al.Dynamic gradient-echo and spin-gradient-echo measurements of tumor blood volume and vascular morphology predict grade in patients with brain tumors.
Presented at: International Society of Magnetic Resonance in Med-icine–Workshop on In Vivo Functional and Molecular Assessment of Cancer. Santa Cruz, CA; 2002
60. Schmainda KM, Rand SD, Joseph AM, et al.A combined gradient-echo / spin-gradient-echo DSC method: a surrogate marker for brain tumor histologic grade and angiogenesis in patients.Presented at: 11th Annual Meeting of International Society of Magnetic Resonance in Medicine. 2003; Toronto, Ontario, Canada