Management summary
Problem description
The operating room (OR) department of UMC Utrecht faces a high demand for surgery time. However, the amount of surgery time it can offer is limited, because both surgical technologists and anesthesia assistants are scarce. The shortage of personnel is caused by a shortage of qualified OR- and anesthesia-assistants in the Netherlands. This leads to cancelled days of surgery because of personnel shortage. Therefore, the production quota is not met.
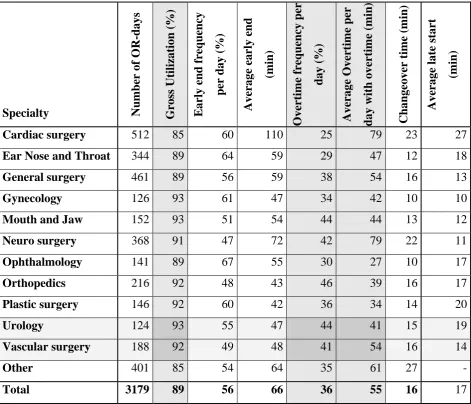
However, the available surgery time in UMC Utrecht is not utilized completely. In 2008, the gross utilization of the ORs was 89%, so 11% of the available time was not used for surgeries or changeovers. On the other hand, overtime occurred on 36% of the OR-days (an OR-day is one day of surgery in one OR), with an average duration of almost one hour. On top of this, 8.3% of the surgeries were cancelled on the day they were scheduled. Despite that other hospitals encounter the same problems, we strive to improve this situation.
Simulation
The high amount of resources involved when scheduling the OR and the stochastic nature of surgery durations make it hard to use an analytical approach to improve surgery scheduling. Simulation handles stochastic processes well and is able to evaluate several alternative solutions, whilst producing quantitative results. E.W. Hans developed a simulation model for the OR, which we adapt to serve as a basis for a simulation model in this research, and for other research projects in the OR of UMC Utrecht.
Research objectives
To restrict the scope of this research, we focus on the surgeries of urology and vascular surgery. We want to improve the problems we mentioned with the following objectives:
Decrease the percentage of cancelled surgeries and increase utilization while not increasing
overtime.
Adapt and implement a simulation model of urology and vascular surgery in the operating
Approach
We have studied related literature and designed several interventions that may improve OR performance. These interventions include a change of the number of working hours per day, the scheduling heuristic used, the use of a Master Surgery Schedule (MSS), and a combination of these interventions. An MSS contains slots for surgery types that recur regularly and is cyclically executed [Van Oostrum et al. 2009]. We adapted and implemented a simulation tool for two specialties (urology and vascular surgery) of the OR department of UMC Utrecht based on software developed in cooperation with University of Twente, called OR Manager. We used this tool to evaluate the effects of the interventions.
Conclusions
We performed a simulation study of the aforementioned interventions, from which we have drawn several conclusions:
• Adapting working hours to the MSS (for example, schedule one surgery of 7 hours
and 3 surgeries of 3 hours respectively in one day of 7 hours and one day of 9 hours, instead of two days of 8 hours) helps to reduce the number of cancellations by 1 percentage point, with a loss of utilization of 1.4 percentage points.
• Longer working days allow a higher utilization with a lower amount of overtime,
while the number of cancellations is not influenced. Utilization increases up to 5 percentage point for vascular surgery and overtime decreases up to 68% for urology, when twelve hours of surgery are scheduled per OR per day.
• Moving delayed surgeries at the end of the day from one OR to the other helps to decrease the number of cancellations by 1.4 percentage points and increase utilization by 0.8 percentage points.
• A combination of the interventions can reduce the number of cancellations by 50%,
does not increase overtime and at the same time increase the utilization by 0.9 to 1.5 percentage points.
Recommendations
Preface
A couple of years ago, in the second year of the bachelor Industrial Engineering and Management, all students had to choose whether they wanted to be in the health care track. For me, this was one of rare occasions that a choice was easy: “I’m not doing the health care track!”
In the past year, I found out that health care is actually an interesting field of research in the track I did choose, production and logistic management. UMC Utrecht has several interesting and complex challenges in production management. Even more interesting was, of course, the opportunity I got to watch live surgeries.
My assignment was to adapt and implement a computer simulation model of the OR department of UMC Utrecht. This simulation model forms the basis for my research and for further research, which my colleague Sabrina Ramwadhdoebe will perform during 2010.
I thank Arjan van Hoorn and Sabrina Ramwadhdoebe for their unremitting support during my internship in UMC Utrecht. I thank Mariken and Mitch for their pleasant company and Marco Schutten for his critical look and comments on this report. Finally, I thank Erwin Hans from University of Twente, for his support in both the research and the simulation tool, and the enthusiasm he showed during the discussions we had about the simulation tool.
Table of contents
CHAPTER 1 INTRODUCTION ... 7
1.1HISTORY AND FACTS ABOUT UMCUTRECHT ... 7
1.2PROBLEM DESCRIPTION ... 8
1.3GOALS AND RESEARCH QUESTIONS ... 8
CHAPTER 2 DESCRIPTION OF THE OR DEPARTMENT ... 12
2.1DESCRIPTION OF THE SURGERY PROCESS ... 12
2.2DESCRIPTION OF THE PLANNING PROCESS ... 22
2.3PERFORMANCE INDICATORS ... 24
2.4MEASURED PERFORMANCE ... 26
2.5CONCLUSION, BOTTLENECK ANALYSIS ... 27
CHAPTER 3 DESIGN OF INTERVENTIONS ... 29
3.1LITERATURE ... 29
3.2DESIGN OF INTERVENTIONS ... 31
CHAPTER 4 SIMULATION OF THE CURRENT SITUATION ... 35
4.1DESIGN OF THE SIMULATION MODEL ... 35
4.2DATA PREPARATION ... 38
4.3VALIDATION OF THE SIMULATION MODEL ... 44
4.4CONCLUSIONS ... 49
CHAPTER 5 COMPUTATIONAL RESULTS ... 50
5.1EXPERIMENT APPROACH ... 50
5.2RESULTS ... 53
5.3CONCLUSIONS ... 60
CHAPTER 6 CONCLUSIONS AND DISCUSSION ... 62
6.1CONCLUSIONS ... 62
6.2IMPLEMENTATION ... 63
6.3FUTURE ... 64
6.4DISCUSSION ... 66
APPENDIX A LITERATURE CITED ... 68
APPENDIX B SIMULATION SETTINGS ... 70
APPENDIX C SURGERY CANCELLATION ... 75
APPENDIX E SURGERY GROUPS ... 79
APPENDIX F NUMBER OF REPLICATIONS ... 81
APPENDIX G INTERVENTIONS ... 83
Chapter 1 Introduction
University Medical Centre Utrecht (UMC Utrecht) has an operating room (OR) department, which handles 23,000 surgeries per year. There are waiting lists for surgeries, which can be long for surgeries that are not urgent. This is not caused by a shortage of ORs, but due to a shortage of OR staff. We aim to maximize the number of surgeries performed with the limited number of OR staff. This may however not harm the job satisfaction of personnel and should go hand in hand with a reduction of the number of cancelled surgeries. In this research, we use a simulation study to search for interventions that help to reach these goals, by changing the scheduling of elective surgeries.
Early 2009, UMC Utrecht granted funding for a research project, as part of the second round of the ‘Slimmer Beter’ (smarter better) program, which focuses on organizing hospital processes in a smarter way to improve productivity of personnel and create better patient care. This research project uses the large amount of available data in UMC Utrecht, in combination with a simulation tool that is being developed by University of Twente, to investigate interventions that may improve OR performance.
This chapter starts with a short introduction of UMC Utrecht in Section 1.1. Section 1.2 describes the main problems that currently exist in UMC Utrecht. In Section 1.3, we list the project goals and research questions.
1.1 History and facts about UMC Utrecht
UMC Utrecht is one of the eight University Medical Centers in the Netherlands. It was founded as Stads- en Academisch Ziekenhuis Utrecht (AZU) in 1817 and has moved to a new location at De Uithof in 1989. In 1999 it merged with pediatric Wilhelmina Kinderziekenhuis (WKZ) and the medical faculty of University of Utrecht. WKZ and AZU are located next to each other at De Uithof.
1.2 Problem description
The OR department of UMC Utrecht has a high demand for surgery time. The amount of surgery time it can offer is however limited, because both surgical technologists and anesthesia assistants are scarce. This results in a conflict, which has two aspects:
• The limited number of personnel is a problem in the operating department. Some
planned OR-days (an OR-day is one day of surgery in one OR) are cancelled because of personnel shortage. Therefore, the production quota is not met. The shortage of personnel is caused by a shortage of qualified OR- and anesthesia-assistants in the Netherlands. Some vacancies are filled by hiring temporary personnel. This is very costly.
• The second aspect of the conflict is the amount of surgeries that the personnel can do
in a certain amount of time. During working hours in 2008, the gross utilization of the ORs in regular time was 89%, so 11% of the available time was not used for surgeries or changeovers. On the other hand, overtime occurred on 36% of the days, averaging 55 minutes per day with overtime. On top of this, 8.3% of the surgeries were cancelled within 24 hours before the planned start, which affects quality of care.
1.3 Goals and research questions
The problems described in Section 1.2 call for measures to improve OR performance. This is the first goal of this research:
Decrease the percentage of cancelled surgeries and increase utilization while not increasing
overtime.
In Chapter 2 we explain which indicators we will use to measure performance. In this research, we will investigate several interventions that may improve the OR performance, for which we use a simulation model. This simulation model will also be used in further research to OR performance in UMC Utrecht, by other researchers. To enable this research, we formulate a second goal:
Adapt and implement a simulation model of urology and vascular surgery in the operating
To reach both goals, we pose several research questions. Between brackets, we denote the chapter or section that answers a question.
The first step in this research is to analyze the processes, the control, and the logistical performance of the OR department.
1. How is the OR department currently organized? (Ch.2)
a. How can the operating room process be described? (2.1) b. How is the planning process organized? (2.2)
c. How does the OR department perform? (2.3)
i. Which performance indicators describe OR performance best? (2.3) ii. On which indicators does the OR department under-perform? (2.4)
We observe some surgeries to learn about the working procedures. To investigate the current planning procedures, we interview planners. We obtain further information in informal meetings with surgical technologists and OR management. We also obtain information from the hospital information system.
2. Which interventions may improve the OR department’s performance? (Ch. 3) a. Which literature is relevant to this research? (3.1)
We search the literature for interventions that may improve OR performance. We apply these interventions to the OR department and try to come up with more interventions. To evaluate the effect of the interventions, we use a simulation tool, which will be developed in cooperation with University of Twente (E.W. Hans). This tool is called OR Manager. We pose the following questions:
3. How can we model the current situation? (Ch.4) a. How can we design a simulation model? (4.1)
b. How can we analyze data in such a way that the input of the simulation model resembles practice? (4.2)
We describe the OR manager and make some improvements to adapt it to UMC Utrecht’s situation as closely as possible. We develop a base scenario of the current situation. For the simulation model, we need input of surgery data. We will derive this input from historical data of surgeries in 2008. We simplify data when this is possible without loss of generality and filter out any erroneous data. Therefore, we group surgeries in cooperation with a surgeon. We make sure that all surgeries are grouped in representative groups. We validate the model by comparing simulation outcomes with the results in the year 2008 and ask the planning surgeons whether the simulation resembles practice.
4. How do the interventions affect OR performance? (Ch. 5)
With the model, we simulate the interventions and interpret the resulting performance.
5. How can we use the obtained results to improve performance in practice? (Ch. 6)
We select the appealing interventions and investigate how to implement these.
1.3.1 Demarcation
This research is subject to several restrictions. Some of the restrictions are a consequence of UMC Utrecht’s environment; others are to demarcate the research scope.
1. The focus of this research will be on the tactical and operational planning.
2. We focus on elective surgeries in the inpatient OR-department, which mainly serves large and complex surgeries.
• This is the largest department, so it has the highest improvement potential. Leaving
out the outpatient OR-department, which serves less complex surgeries, and the pediatric hospital reduces research complexity.
3. We focus on two specialties: urology and vascular surgery.
4. We will not consider the effects of the surgery schedule on the use of intensive care and ward beds.
Chapter 2 Description of the OR department
This chapter describes the main processes in the clinical operating room department. Section 2.1 describes the current surgery process, followed by Section 2.2 with the control and planning processes. Section 2.3 describes the performance indicators and Section 2.4 describes the performance of the system. Section 2.5 concludes this chapter and states several bottlenecks.
2.1 Description of the surgery process
A patient who needs a surgery must first be screened by an anesthesiologist. For many patients, this can be done in the outpatient department. In this pre-operative screening, the anesthesiologist screens the patient for allergies and fitness for surgery and determines the type of anesthesia.
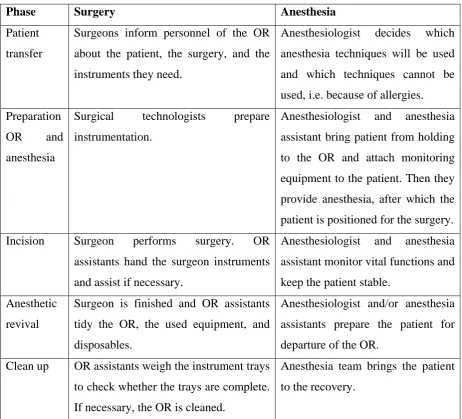
Before surgery, the patient arrives and receives a bed on the ward. The patient is not allowed to eat after midnight the day before the surgery. On the day of the surgery, the patient is brought to the holding. Table 2.2 shows the process in the OR department.
During the surgery process, the duration of the surgery and the duration of different phases during the surgery are registered. Illustration 2.1 shows the phases of a surgery the hospital registers.
Induction Positioning Incision Anesthetic revival
Patient arrives at OR
Patient is under anesthesia
First
incision Closure
Patient leaves OR Surgical time
Total surgery duration
Phase Surgery Anesthesia
Patient transfer
Surgeons inform personnel of the OR about the patient, the surgery, and the instruments they need.
Anesthesiologist decides which anesthesia techniques will be used and which techniques cannot be used, i.e. because of allergies.
Preparation OR and anesthesia
Surgical technologists prepare instrumentation.
Anesthesiologist and anesthesia assistant bring patient from holding to the OR and attach monitoring equipment to the patient. Then they provide anesthesia, after which the patient is positioned for the surgery. Incision Surgeon performs surgery. OR
assistants hand the surgeon instruments and assist if necessary.
Anesthesiologist and anesthesia assistant monitor vital functions and keep the patient stable.
Anesthetic revival
Surgeon is finished and OR assistants tidy the OR, the used equipment, and disposables.
Anesthesiologist and/or anesthesia assistants prepare the patient for departure of the OR.
Clean up OR assistants weigh the instrument trays to check whether the trays are complete. If necessary, the OR is cleaned.
[image:14.595.65.528.67.486.2]Anesthesia team brings the patient to the recovery.
Table 2.2: the surgery process
Start of the day
Last patient leaves Late start Surgery 1 Change over Surgery 2 Early end Overtime
First patient arrives
First patient leaves
Second patient arrives
Second patient leaves
Planned end of the day
Patient on OR No patient on OR
Illustration 2.3: registration of an OR-day [Hoorn and Wendt 2008]
A surgery may consist of several surgical procedures. A surgical procedure is for example the placement of a vascular prosthesis. If the surgeon places several prostheses in different vessels, these will be regarded as different surgical procedures. The main purpose of the surgery, the most important surgical procedure, is called the main surgical procedure. All other surgical procedures are auxiliary surgical procedures.
2.1.1 Work force
With a standard surgery in the inpatient department, at least five people are necessary: a surgeon, an anesthesiologist, an anesthesia assistant, and two surgical technologists. The surgeon performs the surgery, often accompanied by a doctor assistant or a co-assistant. Surgeons are grouped in 11 specialties (see Table 2.4).
Specialty Abbreviation
Cardiac surgery CAC
General surgery CHI
Plastic surgery CHP
Gynecology GYN
Ear Nose and Throat (ENT) KNO
Mouth and Jaw (Orthognathic surgery) MND
Neuro surgery NEC
Ophthalmology OOG
Orthopedics ORT
Urology URO
Vascular surgery VAT
The scrub surgical technologist hands the operator the instruments he needs from the sterile table with instruments. The circulation surgical technologist restocks the table with instruments. An extra circulation surgical technologist can bring instruments and supplies from outside the OR. An anesthesiologist is responsible for the vital functions and anesthesia, mostly in two rooms at the same time. In each OR, the anesthesiologist is assisted by an anesthesia assistant, who stays with the patient all the time. All personnel and equipment is shown in Illustration 2.5. For larger surgeries, more personnel may be required. Sometimes several surgeons operate a patient at the same time or in succession. In these cases, sometimes more OR-assistants and anesthesia assistants are needed.
1 computer 5 anesthesiologist 9 scrub surgical technologist
2 surgeon 6 litter bin 10 stock
3 anesthesia equipment 7 instrument tables 11 stock
In the morning, every OR team starts with a briefing, in which the surgeries of the day are considered. The first patient usually arrives in the OR around 8:15. At 16:00, the last patient should have left the OR.
Some specialties, for example cardiac surgery, have surgeries that take longer than a normal working day and many surgeries that take over half a working day. The involved specialties sometimes have longer working days and are allowed to finish at 17:00, 18:00, or later. Three teams of OR personnel starting at 12:30 cover these hours. Additionally, these teams take over the duties of different OR teams during the day for their lunch break and afternoon tea. Another exception to the usual working hours are the “parent-ORs”. These ORs have working hours from 9:15 to 14:45. Working parents can get these special working hours to be able to pick up their children from school.
During the night, three teams of surgical technologists can be present and will be called, in case they are needed. If there are no emergency surgeries, no surgical technologists are present. In this case, only an anesthesia assistant and an anesthesiologist are present.
The weekend is divided in three shifts per day. During these shifts, one surgical technologist and one anesthesia assistant are present. Additionally, three more surgical technologists and anesthesia assistants are on call. When an emergency surgery is performed, the surgical technologist from the involved specialty is called in. Both working day and weekend shifts are shown in Illustration 2.6.
“Anders Roosteren”
Parallel to this research, hospital management performs another project called “Anders Roosteren” (scheduling differently). This project aims at scheduling the work force in such a way that individual wishes can be met. These wishes can include a different number of working hours per day, or a different moment to start the working day. Some of the findings of this project that may be useful for our research are (source: Anders Roosteren):
1. A nine hour working day may convince personnel who work four days of eight hours to work four days of nine hours, which results in an increase of capacity.
8:00 24:00
Day
8:00 16:00
Parent
Evening
Night Anesthesia Evening Anesthesia
Normal working day
Weekend
Day
Evening
Night On call day
On call night
Illustration 2.6: working hours. Dotted lines represent shifts on call
2.1.2 Surgery statistics
In 2008, around 23.000 surgeries were performed in UMC Utrecht. This is about the same number as the years before (see Table 2.7). The surgeries were performed in three locations. In 2008, 9605 of these surgeries were performed in the clinical OR.
Location
Year Outpatient Inpatient WKZ (children) Total
2005 7286 10095 5879 23260
2006 7039 9740 5838 22617
2007 6977 9794 5795 22566
2008 7441 9605 5889 22935
[image:18.595.78.435.69.307.2]Total 28743 39234 23401 91378
Table 2.7: surgeries in UMC Utrecht (source: ZIS)
urgent surgery. Semi-urgent surgeries are surgeries that need to start within 24 hours of their arrival. All other surgeries are considered to be elective surgeries. These surgeries are normally scheduled over a week in advance.
0 200 400 600 800 1000 1200 1400 1600 1800 2000 Car diac sur ger y Ear Nos e and Thr oat Gen eral sur gery Gynaec olog y Mout h and
Jaw Neur o s urge ry Oph talm ology Ortho pedi cs Pla stic su rger y Urol ogy Vas cular sur ger y Other s Num ber of patients
Elective Semi-urgent Urgent
Illustration 2.8: inpatient surgeries in 2008 (source: ZIS)
Specialty Av. Surgery duration (min)
Cardiac surgery 242
Ear Nose and Throat 131
General surgery 167
Gynecology 124
Mouth and Jaw 224
Neuro surgery 245
Ophthalmology 75
Orthopedics 149
Plastic surgery 118
Urology 176
Vascular surgery 172
Others 66
[image:20.595.75.512.417.626.2]Total 165
Table 2.9: average inpatient surgery duration per specialty in 2008 (source: ZIS)
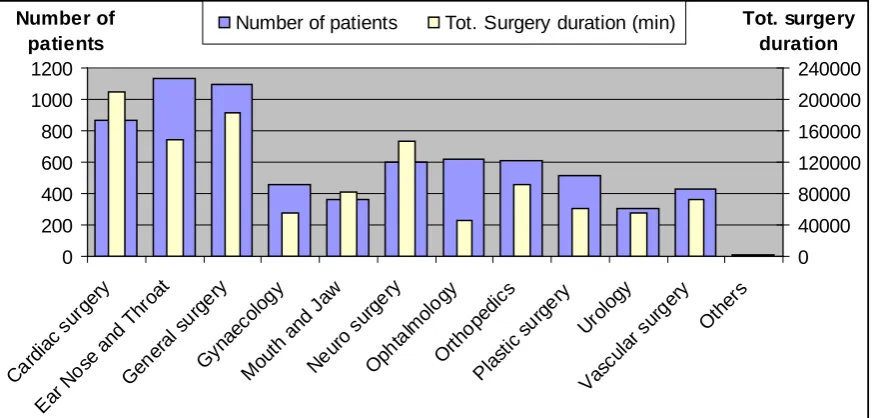
0 200 400 600 800 1000 1200 Car diac sur ger y Ear Nos e and Thr oat Gen eral sur gery Gynaec olog y Mout h and
Jaw Neur o s urge ry Oph talm ology Ortho pedi cs Pla stic su rger y Urol ogy Vas cul
ar s urger y Other s Number of patients 0 40000 80000 120000 160000 200000 240000 Tot. surgery duration
Number of patients Tot. Surgery duration (min)
Illustration 2.10: inpatient surgery duration per specialty in 2008 (source: ZIS)
number of urological surgeries, while the number of different (main) surgical procedures is approximately the same for both specialties. The number of surgical procedures is larger for urology. This is caused by a number of small surgical procedures that urologists often perform as an auxiliary surgical procedure, for example chromocystoscopy (looking in the bladder).
Urology Vascular surgery
Number of surgeries 340 500
Average duration (min) 169 165
Average standard deviation 132 80
Number of different main surgical procedures 118 112
Number of different surgical procedures 159 148
Number of unique combinations of surgical
procedures
210 200
Average number of surgical procedures per
surgery
[image:21.595.65.521.172.387.2]1.9 1.6
Table 2.11: characteristics of inpatient vascular and urology surgeries in 2008 (source: ZIS)
Specialty 2005 2006 2007 2008
Cardiac surgery 150 188 201 165
Ear Nose and Throat 100 101 105 132
General surgery 730 744 761 790
Gynecology 89 86 95 73
Mouth and Jaw 65 73 96 93
Neuro surgery 412 395 396 583
Ophthalmology 54 48 86 74
Orthopedics 188 198 170 210
Plastic surgery 54 77 73 73
Urology 38 60 69 90
Vascular surgery 295 220 201 235
Others 13 14 8 5
[image:22.595.70.473.90.391.2]Total 2188 2204 2261 2523
Table 2.12: number of inpatient emergency surgeries per specialty per year (source: ZIS)
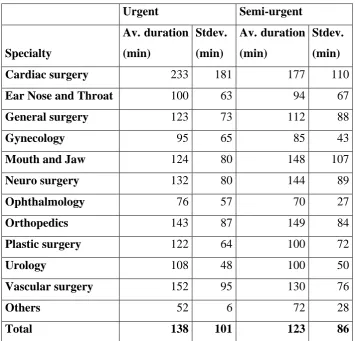
Urgent Semi-urgent
Specialty
Av. duration
(min)
Stdev.
(min)
Av. duration
(min)
Stdev.
(min)
Cardiac surgery 233 181 177 110
Ear Nose and Throat 100 63 94 67
General surgery 123 73 112 88
Gynecology 95 65 85 43
Mouth and Jaw 124 80 148 107
Neuro surgery 132 80 144 89
Ophthalmology 76 57 70 27
Orthopedics 143 87 149 84
Plastic surgery 122 64 100 72
Urology 108 48 100 50
Vascular surgery 152 95 130 76
Others 52 6 72 28
[image:23.595.69.425.88.429.2]Total 138 101 123 86
Table 2.13: average duration and standard deviation of (semi-) urgent inpatient surgeries in 2008 (source: ZIS)
2.2 Description of the planning process
We divide the planning process roughly into four main steps. Strategic planning (Section 2.2.1), tactical planning (Section 2.2.2), operational off-line planning (Section 2.2.3), and operational on-line planning (Section 2.2.4)[Hans and Wullink 2006].
2.2.1 Strategic planning: management contract / production agreement
Once a year, the hospital management and the specialties decide how many hours of OR time will be assigned to each specialty. This is mainly based on historical production and gets adjusted only incrementally. These production agreements are written down in a management contract.
2.2.2 Tactical planning: assigning OR-days to specialties
This rough-cut division of capacity is refined by making a yearly provisional schedule in which individual OR-days are assigned, in such a way that the production agreements are met. In the resulting schedule, some OR-days are parent-ORs-days, some have longer working hours (see Section 2.1.1), and some are not used.
The planner makes the final schedule on a monthly basis. In this schedule, availability of personnel and some wishes of specialties are taken into account. Due to the shortage of personnel, this usually leads to the cancellation of some OR-days.
2.2.3 Operational planning off-line: assigning surgeries to OR-days
The planning of individual surgeries is done by planners from each specialty. Their way of working differs between the specialties. The aim of these planners is to fit as many surgeries as possible into the assigned OR time, and to create a workable schedule for the surgeons.
The planner of vascular surgery uses a master surgery schedule (MSS). An MSS contains slots for surgery types that recur regularly and is cyclically executed [Van Oostrum et al. 2009]. This schedule is presented in Table 2.14. Note that the number of abdominal aneurysms planned on Tuesdays depends on the expected complexity of the surgeries and is decided by the planner.
Day Surgeries
Monday Open Aneurysm + Small surgeries Tuesday 2 or 3 * Abdominal Aneurysm Wednesday Nefrectomy + Kidney transplant Thursday 3 * Carotid
[image:24.595.67.526.502.632.2]Friday Other surgeries (if Friday is assigned) Table 2.14: Vascular surgery MSS
priority. The availability of (specialized) surgeons and other resources fix the MSS in its current form. A change of schedule would cause changes in several other departments.
The planner of Urology does not use an MSS. She schedules the surgeries based on the availability of specific surgeons. A surgery is selected based on its urgency and the amount of time is has been on the waiting list.
Every Thursday, next week’s operating schedules of all specialties are brought together and evaluated in a central meeting. If there are any resource conflicts, these should appear in this meeting, so the schedule can be adjusted.
2.2.4 Operational planning on-line: dealing with emergencies
If there are any changes in schedule during the day of surgery, or in case of emergency surgeries, this is coordinated by an OR-coordinator. Upon an emergency surgery arrival, the OR-coordinator discusses with surgeons and anesthesiologists to find a suitable place, time, and surgeon. Disturbances during the day can also cause a need for on-line rescheduling. This happens for example when a surgery takes much longer than expected or when the IC (intensive care) bed needed is suddenly occupied.
2.3 Performance indicators
To evaluate the performance of the OR, we use several performance indicators. The performance indicators we choose need to take the interests of the main stakeholders into account. We have listed several stakeholders and their interests.
• Patients and their families want a short waiting time and a small risk of errors. They
want to be sure about the moment the surgery takes place.
• The surgeon also wants to be sure about the operating schedule and prefers to get extra
operating time when there are emergency surgeries.
• Surgical technologists and anesthesia assistants prefer not to work in overtime too often.
• The hospital management adds the goal of cost reduction.
• The OR utilization has a direct influence on the cost per surgery and the number of
patients the hospital can serve and is therefore important for hospital management.
• The average overtime per week is an important indicator for the surgical technologists
and anesthesia assistants. A high amount of overtime may lead to a low job satisfaction and may at the same time lead to high costs for the hospital.
• The percentage of cancelled surgeries is an important quality measure for patients.
For a patient, this indicator appears as the chance to be cancelled. This indicator is also important for the doctor, who wants to give the best care to his patients. However, we will not consider all cancelled surgeries in this research. Surgeries that are cancelled because of medical reasons, i.e. a change of indication, and surgeries which are cancelled because of patient reasons, i.e. a patient did not show up, cannot be explained by the model, so we will treat these cancellations as external parameters. Only cancellations caused by a delay of surgeries will be included.
The three indicators have a strong relationship with each other. For example, when management decides to increase OR utilization by scheduling a larger daily workload, the percentage of cancelled surgeries and the average overtime are likely to increase. The definition of the performance indicators is stated below.
The Gross Utilization is the sum of the surgery durations and changeover times, within
working hours, divided by the amount of working hours (see Illustration 2.2 and Illustration 2.3) [Hoorn and Wendt 2008]. The amount of working hours per day is currently 8 hours in a regular OR.
Overtime occurs when the last surgery of the day finishes after the end of scheduled working
2.4 Measured performance
Table 2.15 shows the main figures per specialty in 2008. We can see that for cardiac surgery for example, on six out of ten days, 1 hour and 50 minutes of OR time is unused. Over all, early end occurs on over half of the OR-days (56%), averaging over 1 hour of lost time on these days. The amount of overtime is smaller, but still over one third of the OR-days finishes late, causing on average 55 minutes of overtime on these days. A subtraction of these figures shows that the average daily workload is on average 17 minutes smaller than the daily OR capacity (see Table 2.15).
Specialty Num
be r o f OR -da y s Gr o ss U ti li za tio n (% ) E a rl y e nd freq u en cy p er d ay ( %) A v era g e ea rl y en d (min ) Ov er time f re que nc y p er d ay ( %) A ve rage Ov er ti me p er d ay w it h ove rt im e (min ) C h an ge ove r tim e (min ) A v era g e l a te st a rt (min )
Cardiac surgery 512 85 60 110 25 79 23 27
Ear Nose and Throat 344 89 64 59 29 47 12 18
General surgery 461 89 56 59 38 54 16 13
Gynecology 126 93 61 47 34 42 10 10
Mouth and Jaw 152 93 51 54 44 44 13 12
Neuro surgery 368 91 47 72 42 79 22 11
Ophthalmology 141 89 67 55 30 27 10 17
Orthopedics 216 92 48 43 46 39 16 17
Plastic surgery 146 92 60 42 36 34 14 20
Urology 124 93 55 47 44 41 15 19
Vascular surgery 188 92 49 48 41 54 16 14
Other 401 85 54 64 35 61 27 -
[image:27.595.71.543.262.666.2]Total 3179 89 56 66 36 55 16 17
Table 2.15: performance of inpatient surgery department F4 in 2008 (source: ZIS)
delay of previous surgeries, but medical reasons, resource capacity and the priority of other surgeries also cause over 1% of cancellations each. In this research, we focus on cancellations caused by the delay of surgeries, which is the highest for urology and vascular surgery, averaging 4.8% and 4.4% of the surgeries respectively.
Specialty
Reason for cancellation
Resource
capacity Medical Patient
Delay of
surgeries
Priority
of other
surgery Other Total
Cardiac surgery 6.5% 2.3% 0.1% 1.6% 4.0% 2.0% 16.5%
Ear Nose and
Throat 0.6% 1.7% 0.3% 1.8% 0.3% 0.6% 5.4%
General surgery 0.9% 2.4% 0.4% 2.7% 0.4% 1.4% 8.1%
Gynecology 0.0% 0.6% 0.2% 4.1% 0.9% 0.0% 5.8%
Mouth and Jaw 0.0% 0.8% 0.8% 1.9% 0.8% 0.5% 4.9%
Neuro surgery 1.5% 2.1% 0.2% 4.1% 2.0% 1.1% 10.9%
Ophthalmology 0.0% 2.1% 0.0% 0.8% 0.5% 0.3% 3.7%
Orthopedics 0.5% 2.3% 0.5% 2.1% 0.7% 0.3% 6.3%
Plastic surgery 1.3% 1.2% 0.4% 2.5% 0.2% 0.4% 6.0%
Urology 1.9% 1.3% 0.3% 4.8% 0.6% 0.6% 9.6%
Vascular surgery 0.5% 2.1% 0.7% 4.4% 1.9% 0.7% 10.3%
[image:28.595.66.522.174.533.2]Total 1.5% 1.9% 0.3% 2.6% 1.2% 0.8% 8.3%
Table 2.16: percentage of cancelled elective surgeries in the inpatient department in 2008 (source: ZIS)
2.5 Conclusion, bottleneck analysis
In the figures presented in Section 2.4, we find several bottlenecks for both urology and vascular surgery. We will discuss several bottlenecks we notice in this section.
Utilization below 100%
Overtime
On average, overtime occurs on 44% of the days, averaging 41 minutes per day of occurrence for Urology. If we assume that urology operates three days a week, the resulting overtime per week is 54 minutes (0.44*41*3=54). The overtime per week for vascular surgery is 110 minutes (see Table 2.15). Overtime causes an uncertain end of the day for the personnel and is costlier than regular surgery time. The average overtime per day is smaller than the average idle time per day, which may indicate an improvement potential.
Surgery Cancellations
Surgeries are cancelled on a regular basis. The percentage of cancelled surgeries was 9.6 for urology and 10.3 for vascular surgery in 2008. This means that a patient has a 10% chance that his or her surgery does not take place, causing uncertainty, needless sobriety and possibly a decline of patient condition. Around 4.4% (vascular surgery) or 4.8% (urology) of the surgeries are cancelled because the preceding surgeries in the same OR are delayed. These surgeries may benefit from a better surgery planning.
When we zoom in to the cancellations caused by delayed surgeries, we see that for vascular surgery, most cancellations take place on Tuesdays (see Table 2.17). On these days, aneurysm surgeries are performed (see Table 2.14).
Percentage of OR-days with a cancelled surgery
caused by delay of surgeries
Day Vascular surgery Urology
Monday 9% 10%
Tuesday 16% -
Wednesday 2% 12%
Thursday 8% -
Friday 0% 12%
Table 2.17: percentage of OR-days with a cancelled surgery caused by delay of surgeries in 2008 (source: ZIS)
Chapter 3 Design of interventions
In this chapter, we suggest possible ways to improve the bottlenecks we described in Section 2.5. Section 3.1 describes literature on simulation and surgery scheduling. We used this literature as inspiration for the interventions we formulate in Section 3.2. These interventions will be evaluated in the simulation study (Chapter 4 and Chapter 5).
3.1 Literature
Simulation
As mentioned in Chapter 1 we will use simulation to answer the proposed research questions. Simulation is a way to imitate and understand the functioning of a system in practice. It and can be used to evaluate the effect of interventions and scenarios in a laboratory setting. Simulation is mostly used when the system under consideration is too complex to evaluate in an analytical way [Law and Kelton 2000].
Simulation of a system can be done by hand, but since the number of calculations is very high for most simulation models, it is usually done by computer. Simulation originates in the field of Operations Research and was used mostly in an industrial environment [Allen and Wigglesworth 2009]. Even early in its development, simulation was used in health care (see for example [England and Roberts 1978]), but it got more widely adopted since the 1990s for management support on logistical issues in health care [Jun et al. 1999].
Despite the complexity of most health care organizations, an analytical approach is quite common in health care operations research (see for example [Cardoen et al. 2009] and [Fei et al. 2009]). However, these studies do not research the effect of the resulting schedule in a stochastic environment, but evaluate the surgery schedule on the properties of the schedule itself.
The reliability of the results of the simulation depends highly on the validity of the simulation model and the quality of input data. An invalidated simulation model or unreliable input data may lead to unreliable or even incorrect results [Law and Kelton 2000]. This stresses the need for a solid analysis of input data for the model.
Ashby et al. [2008] for example, used discrete event simulation to support the design of a new facility for a hospital in Los Angeles. They examined the effects of a limited capacity and determined how the patient mix can be allocated to the best possible wards.
Ramwadhdoebe et al. [2009] have researched the use of discrete event simulation (DES) in health care. As an example, they use a simulation model to find out whether a new screening method for developmental dysplasia is feasible and cost effective. They conclude that “DES is most readily applicable when the problem or the system being studied involves competition for resources, where the timing of events a priori is not known, or when examining the interdependence between events or the flow of information or entities (e.g., patients) is important. (…) DES provides very useful outcome measures such as wait time, flow time, and resource utilization; metrics that are increasingly important in healthcare problems.”
Simulation of OR planning and scheduling
Several researches using discrete event simulation have been performed to the OR. Persson and Persson [2009] for example, analyze the OR planning at a department of orthopedic surgery in Sweden. They share several goals of their research with our research, such as the improvement of the number of cancellations, the amount of overtime and the utilization of OR time. However, they also focus on the length of the waiting list and the allocation of time for emergency surgeries, which is not within the scope of our research. The main solution approach of Persson and Persson includes the introduction of both stand-by patients, which can be called in if idle time emerges, and stand-by personnel, to cover emergency surgeries. They conclude that this approach improves the performance of the OR department.
near-future scheduling practice in UMC Utrecht is performed by hand and is therefore not suitable for complex scheduling methods such as regret based random sampling.
Beliën and Demeulemeester [2007] present a decision support system for cyclic Master Surgery Scheduling (MSS). They aim at leveling the resulting bed occupancy, concentrating surgeons of the same group in the same rooms, and keeping the schedules consistent from week to week. Blake and Donald [2002] also describe the introduction of an MSS, in a hospital in Toronto. They find many advantages regarding the time spent on organizing the OR. The number of conflicts is reduced and discussion is only necessary on a high level, when the MSS is discussed. Note that the definition of an MSS used by Beliën, Demeulemeester, Blake and Donald is different than the definition of an MSS used by Van Oostrum [2009], we used earlier in this report. Van Oostrum assigns specific a surgery type to an MSS slot, whereas the other authors we mentioned assign a combination of resources to an MSS slot. These resources can be used for various surgery types.
Based on the literature we discussed, we will formulate several interventions in Section 3.2.
3.2 Design of interventions
In this section, we formulate several interventions that may improve surgery scheduling in UMC Utrecht. We will compare the interventions with the current situation, which we will denote as Current-VAT and Current-URO.
3.2.1 Guaranteed surgery schedule
3.2.2 No MSS
In the current situation, vascular surgery uses an MSS, and Urology does not use an MSS (see Section 3.1). We want to find out which effect the MSS has on the performance and whether the use of an MSS results in a better OR performance, compared to the situation without an MSS. Since the construction of an MSS is a study on itself and not one of the main purposes of this study, we do not construct an MSS, but we investigate the effects of the existing MSS on the performance of the OR. This means we will only be able to research this intervention with vascular surgery and denote it as NoMSS-VAT.
3.2.3 Different day length
The literature suggests that a longer duration of the OR-days (different day length) may improve OR utilization [Collins 2006], if the workload per day of surgery is increased with the same rate. The number of OR-days will decrease as a result of this, since the total workload does not increase. We will test whether a longer duration of the OR-days improves OR utilization for urology and vascular surgery in UMC Utrecht. We want to know which effect a different day length has on the performance of the OR. The interventions with a different day length will be denoted with DayLength-VAT and DayLength-URO.
3.2.4 Adapt working hours to MSS
In Section 2.5 we noticed that most cancellations of vascular surgery are on Tuesdays. This calls for extra attention for Tuesdays. The high number of cancellations may indicate a work load that is too large. A possible way to improve performance on Tuesdays may be the adaptation of working hours to the duration of the surgeries. This may enable the last surgeries to take place as planned. The hospital management is interested in halving the number of cancellations. Therefore, we want to know which working day duration on Tuesdays reduces the number of cancellations.
3.2.5 Two ORs per day, move surgeries at end of day
On some OR-days, idle time arises, because surgeries take less time than expected. On other OR-days, overtime arises, because surgeries take more time than expected. If we could find a way to use the idle time of one OR-day to cover the overtime of another OR-day, this may improve performance. An OR can take over surgery time from another OR by taking over a surgery, so OR 1 is finished early with its scheduled surgeries and takes over a surgery from OR 2, which is likely to finish in overtime. We would need the last surgery of the day to be eligible for moving, i.e. the surgeon of the other OR is able to perform the surgery and all resources are available to both ORs. We create this by scheduling two ORs of the same specialty on the same day. We want to know which effect moving a delayed surgery to another OR has on OR performance.
We will research this intervention only with urology, because many vascular surgeries need specialized surgeons and resources and can therefore not be moved to another OR. We denote this intervention as MoveSurg-URO.
3.2.6 Scheduling heuristic
Hans et al. [2008] suggest that surgery scheduling based on regret based random sampling can result in an improvement of OR performance. This heuristic is designed for use with a computer. The current ICT environment in UMC Utrecht is not ready for automated scheduling techniques. Therefore, we choose to compare scheduling techniques that can be executed by hand. We want to know which of the following scheduling heuristics results in the best OR performance: Earliest due date first, longest surgery duration first, or largest standard deviation first. We denote these interventions as Heuristic-VAT and Heuristic-URO.
3.2.7 Combination of interventions
3.2.8 Summary
The interventions are listed in Table 3.1. We will analyze the effects of these interventions in Chapter 5, after we have designed a simulation model of the current situation in Chapter 4.
Intervention Abbreviation
1 Guaranteed surgery schedule Guaranteed
2 No MSS NoMSS
3 Different day length DayLength
4 Adapt working hours to MSS AdaptHours 5 2 ORs per day, move surgeries at end of day MoveSurg
6 Scheduling heuristic Heuristic
Chapter 4 Simulation of the current situation
To evaluate the interventions we proposed in Chapter 3, we will compare the performance in the current situation with the performance after an intervention. In this chapter, we develop a simulation model of the current situation in the OR department, VAT-0 and URO-0. In Chapter 5, we will evaluate the effect of the interventions on the simulation of the current situation.
Our goal in this chapter is to make a model that resembles practice best. We use the simulation tool developed by various researchers and students at University of Twente, under supervision of associate professor E.W. Hans. This tool is called OR manager. The model is developed in collaboration with Dutch hospitals and has been used in several research studies. It is a good starting point for our simulation study, because of many built-in options and the possibility to fit it to UMC Utrecht’s situation, without the need to build an entirely new simulation model.
We start describing the conceptual design of the simulation model in Section 4.1. Next, we design a method to analyze the input data to the simulation model (Section 4.2). We describe how we clean the data and how we group surgeries. We determine the probability distribution and estimate the parameters. Finally, we validate the simulation model and settings by comparing the results of the model to the results in practice (Section 4.3).
4.1 Design of the simulation model
In this section, we describe the design of OR manager and its configuration. A more detailed description of the settings can be found in Appendix B.
In step B, surgeries are generated based on historical data and a schedule is constructed, based on the expected durations of the surgeries. An example of this schedule is presented in Illustration 4.1. Every column represents an OR-day. The blocks are surgeries.
To generate a new set of surgeries, the tool generates a waiting list, which is used as input for the schedule. The initial waiting list contains a workload of two weeks and is filled to the same amount of surgeries after each scheduled week. Surgeries are not allowed to be on the waiting list longer than four weeks. Schedules are constructed per week, as is the case in practice. First, surgeries with a critical due date are scheduled. Next, surgeries are assigned to the reserved MSS slots. Finally, the remaining surgeries are scheduled, using largest surgery duration first. When a surgery does not fit into the schedule, it is postponed to the next week. The surgeries are scheduled in the OR where the remaining surgery time after scheduling is the least. This is called a ‘best fit’ heuristic. After scheduling one week, new surgeries from a random surgery type are generated, to restore the initial number of surgeries on the waiting list.
Please note that the waiting list we use in the simulation model is not the same as the waiting list in practice. The simulation waiting list contains the surgeries that are on top of the waiting list and therefore eligible for scheduling. Surgeries that are not long enough on the waiting list are not eligible for scheduling and do not appear in the model.
Illustration 4.2: example of a
realization of the surgery
schedule (result step C) Illustration 4.1: example of a
surgery schedule (result step
Step C is the actual simulation. The surgery schedule is evaluated using discrete event simulation. Discrete event simulation concerns the modeling of a system as it evolves over time by a representation in which the state variables change instantaneously at separate
points in time [Law and Kelton 2000]. This means that the basis of the simulation is a list of
events. An event handler handles the first event of the list. When this event is handled, the event handler picks the next event. Events are normally triggered by other events. For example: the start of the simulation generates the first event, start of day; start of day triggers
start of OR in every OR, which in turn triggers start of surgery; start of surgery triggers end
of surgery, which triggers the start of the next surgery. When an event is handled, for example
end of surgery, the tool updates the associated statistics, in this case amongst others the
number of surgeries performed and the time used for the surgeries.
In practice, some surgeries are cancelled because of factors that are not explained by the simulation model. These factors include patient reasons (i.e. a patient does not show up), medical reasons (i.e. the patient is ill) and cancellations because of a capacity shortage (i.e. x-ray or surgeon shortage). In the model these factors are represented by a figure which is the chance a surgeries will be cancelled. This figure is assumed to be equal for all surgeries of the same specialty and is set to the level measured in 2008 (see Table 2.16).
OR manager has several options for decision rules during the simulation. We will use these options to match the simulation with the situation in practice.
• Elective surgeries may start before their planned start time. This is the case in practice,
since all patients are inpatient and patients are called to the OR by the OR personnel based on the progress of the previous patient.
• Surgeries that finish late will be cancelled if the expected surgery duration lies more
than a certain percentage (the cancellation parameter) in overtime. The value of the
cancellation parameter is not measurable in practice and is therefore determined in the
simulation fine tuning (see Section 4.3.3). Appendix C describes how we implemented cancellations in the model in more detail.
4.2 Data preparation
For the simulation, we reconstruct the patient mix of UMC Utrecht, based on historical data collected in 2008. Using one year of data eliminates possible seasonal influences.
To prepare the historical data for use in the simulation model, we need to perform three steps. The first step is to clean the data by eliminating faulty registrations (Section 4.2.1). The second step to group the data (Section 4.2.2). These groups are necessary for the third step, in which we estimate the distribution and parameters of the duration of the surgeries (Section 4.2.3).
4.2.1 Data cleaning
The historical data of UMC Utrecht are often accurate, but still have some incorrect registrations. Amongst others, the following problems exist.
Missing or incorrect time registration is often easy to detect. Registered negative durations
are clearly incorrect. It is harder to spot whether a surgery is incorrectly registered when this results in a positive duration, for example a very long duration. We will handle non-negative outliers after we have made surgery groups in Section 4.2.3, because these outliers can only be qualified as such based on its expected value.
Incorrect registration of main surgical procedures means that the obvious auxiliary surgical
procedure is registered as the main surgical procedure. This often happens with chromocystoscopy, which is looking in the bladder, for example. This surgical procedure is usually part of a larger surgery. An incorrect registration of the main surgical procedure can be detected when the same combination of surgical procedures occurs several times with different main surgical procedures. The decision which of the surgical procedures should be the main surgical procedure can be made based on data from similar surgeries or based on the specialists’ knowledge. An important guideline for this can be the data field of the variable Indication, a registered description of the surgery.
time registrations are included in the calculation of the case mix, but excluded in the calculation of average surgery duration, standard deviation, and distribution.
4.2.2 Surgery grouping
For the grouping of the surgeries, we want to make a separate group for each surgery type with unique properties in the simulation program. These properties can for example be the average duration, standard deviation of the duration, the need for an IC bed, the specialty or the resources needed during the surgery. In this research however, we do not take into account resource usage (see Section 1.3.1), so the most interesting properties are the duration of the surgeries and the specialty.
Currently, surgeries are classified by means of the main surgical procedure and auxiliary surgical procedures. This distinguishes 429 surgery types for urology and 196 types for vascular surgery. Many surgeries are of a unique type and many surgery groups are too small for a good estimation of parameters. Therefore, we need to reduce the number of groups. First we used a numerical approach, in which we tried to deduce which surgical procedures contribute most to the duration of a surgery. The method we used is described in Appendix D, but did not lead to a workable surgery grouping.
We base the grouping of surgeries on medical similarity of the surgeries. We asked a surgeon to construct groups of these similar surgeries, taking the surgery duration in account. We merged groups with too few surgeries with a similar group or added together in the ‘others’ group. Because the ‘others’ group had a standard deviation over twice as high as the average standard deviation of the groups, we decided to split up the ‘others’ group into two groups with small and large surgeries. The sizes of the ‘others’ groups are set in such a way that the standard deviations are similar to, or larger than the standard deviations of other groups of the same size. The resulting surgery types are coded, for example AA1 (Abdominal Aneurysm), C1 (Carotid) and NTX (Kidney transplantation). The surgery groups for urology and vascular surgery are given in Appendix E.
• The uncertainty in practice may be more, because in practice a surgeon may need to
perform unexpected extra surgical procedures. The simulation data set is constructed as if these surgical procedures were known in advance.
• The uncertainty in practice may be less, because the scheduler knows more about the complexity of surgery and the patient, and thus about deviations of the average surgery duration, than we do in the simulation.
For simplicity, we assume that both effects cancel each other, which enables us to use the registration of surgical procedures afterwards to base the grouping on.
4.2.3 Estimation of distribution and parameters
For every group, we want to determine the probability distribution of the surgery duration. Our aim is to use the same probability distribution for every group, since this simplifies the data handling. We will use the largest three groups of vascular surgeries as an example, because a large group will give a reliable result. The histograms of these surgery groups show that the groups have a different behavior of surgery duration (see Illustration 4.1). Surgery group AA1 is much skewed and has a long right hand tail, whereas C1 is less skewed.
400 300 200 100 Frequency 20 15 10 5 0 225 200 175 150 125 100 Frequency 20 15 10 5 0 200 180 160 140 120 Frequency 10 8 6 4 2 0
AA1: Abd. Aneurysm C1: Carotid NTX: Kidney transplantation
Illustration 4.1: Three histograms of surgery duration.
Strum et al. [2003] suggest that surgery groups can best be described with a lognormal distribution. QQ plots of the three surgery groups are given in Illustration 4.2. The QQ plots indicate a good fit for C1 and a reasonable fit for NTX, but AA1 is clearly curved. This indicates that the surgery duration of AA1 is not lognormal distributed. The results of the Shapiro-Wilk [Shapiro and Wilk 1965] test for normality on the natural logarithms of the surgery durations prove that the surgery durations of AA1 are not lognormal distributed (alpha 0.05, see Table 4.3).
Observed Value 500 400 300 200 100 0 E xpect ed Lognorm al V al ue 350 300 250 200 150 100 50 Observed Value 300 250 200 150 100 E xpect ed Lognorm al V al ue 300 250 200 150 100 Observed Value 200 180 160 140 120 100 E xpect ed Lognorm al V al ue 200 180 160 140 120 100
AA1: Abd. Aneurysm C1: Carotid NTX: Kidney transplantation
Illustration 4.2: Three lognormal QQ plots of surgery duration.
Shapiro-Wilk
Statistic df W0.05
AA1 0.922 68 0.95
C1 0.990 91 0.95
NTX 0.959 36 0.94 Table 4.3: Shapiro-Wilk test statistics
Illustration 4.4: a typical lognormal probability distribution and the histogram of Ab. Aneurysm Observed Value 400 300 200 100 0 E xpect ed Lognorm al V al ue 400 300 200 100 0
Illustration 4.5: QQ plot and Shapiro-Wilk test statistics for the lognormal distribution of the surgery duration of
AA1 - 100
Further literature research reveals the existence of the 3-parameter lognormal distribution [Iwase and Kanefuji 1994]. This distribution differs in one aspect from the normal 2-parameter lognormal distribution. The third 2-parameter shifts the distribution along the horizontal axis, which is exactly what we did with the distribution of the AA1 surgery durations. Stepaniak et al. [2009] have researched the use of the 3-parameter lognormal distribution on surgery durations and concluded that it yields a better fit than the 2-parameter lognormal distribution. We will use the 3-parameter lognormal distribution to generate random surgery durations in this simulation study.
To estimate the 3 parameters of the 3-parameter lognormal distribution in an easy way, we enumerated all possible shifts along the horizontal axis, with an accuracy of one minute. The lower bound for this shift is 0, because a negative shift could cause negative surgery times
Shapiro-Wilk
Statistic df Sig.
AA1 - 100 0.9883 68 0.7767
when generating random durations based on the distribution. The upper bound of the shift is the smallest surgery duration minus one, because a larger shift leads to zero or negative input surgery times in the estimation of the other two parameters of the lognormal distribution, which is infeasible. We select the parameter with the highest Shapiro-Wilk test statistic. The resulting parameters are presented in Appendix E. Since the resulting test statistic is larger than the critical level for all surgery groups, we can conclude that for all groups, there is no reason to reject the hypothesis that the surgery groups are 3-parameter lognormal distributed. We added the 3-parameter lognormal distribution to the set of input distributions of the OR-manager tool.
Changeover time
During a session, a surgery does not start immediately after the previous surgery has finished. Anesthesia team needs time to bring the previous patient to the recovery or IC and to bring the next patient to the OR. Surgical technologists need time to clean up the OR after the surgery and prepare for the next surgery. However, the simulation tool plans surgeries immediately after each other. The tool only considers surgery time and idle time. Therefore, we add the changeover times to the surgery duration. We define the changeover time as the time between the registered departure of a patient and the registered entry of the next patient in the same session, during working hours. If the time between surgeries is longer than 30 minutes, it is not considered to be a changeover time. These longer times between surgeries may for example be caused by a cancelled surgery, or a resource shortage.
We consider two options to add the changeover time to the probability distribution. For both options we add the average duration of the changeover to the average surgery duration. Option one is to add the standard deviations as well (take the square root of the sum of the squared standard deviations). For option two, we assume that the changeover time is deterministic. In this way, we can add the average changeover time per specialty τ, to the third parameter of the 3-parameter lognormal distribution θ. We performed a numerical experiment, in which we added random chosen lognormal distributed changeover times to the historical surgery durations. We estimated the parameters of the new 3-parameter lognormal
distribution. The experiment showed that θnew ≈ θold + E(τ) and the variance did not increase.
Therefore, we will add the average changeover time per specialty to the average duration and to the third parameter of the 3-parameter lognormal distribution.
Outliers
In some surgery groups, surgeries with an extremely short or long duration exist. Sometimes these extreme values indicate that the surgery in fact belongs to another surgery group. We have corrected these cases based on surgical procedures and the description of the surgery. Some other extreme values arise from medical complications. These cases do not happen very often, so it is due to coincidence if a surgery group contains such an outlier. Groups that do contain an outlier will have a higher estimated variability than we would expect if the outlier had not occurred. Groups without an outlier may have a lower variability than we would expect if an outlier had occurred. We expect that the best estimate lies in between these cases, probably closer to the estimated variability without outliers. Therefore, removing the outlier will increase accuracy of estimated parameters per surgery group in the groups with outliers. This will however decrease the average variability of the surgery duration, because the variability of all groups would be underestimated. In the situation without the removal of outliers, the variability of some surgeries, with outliers, is overestimated and the variability of some other surgeries, without outliers, is underestimated. In this situation, the variability in the system as a whole is therefore closer to the variability in practice than in the situation with removal of outliers. We conclude that our simulated case mix resembles practice best when we do not remove outliers.
4.3 Validation of the simulation model
the input and decision rules that are used in practice. When an elective surgery is cancelled for example, it may be possible to perform another (non-) elective surgery on the day itself. This is not possible in the simulation tool. In Sections 4.1 and 4.2 we have modeled current practice. In this section, Section 4.3, we validate the simulation model we made. In Section 4.3.1 we discuss the warm-up time we have to deal with in the simulation model. In Section 4.3.2 we determine the number of replications we need to perform, to achieve reliable simulation results. The simulation results may however not be the same as in practice. Therefore, in Section 4.3.3, we will fine tune the simulation, by adjusting the workload and the decision rule on surgery cancellations, to make sure that the number of cancellations, the average overtime and the average gross utilization match the registered figures. Finally, we discuss the validity of the obtained model (Section 4.3.4).
4.3.1 Warm-up time
A single day of surgery has a natural beginning and end. The resulting startup and ending effects are covered by the simulation model. The surgery scheduling however, is a non-terminating process. At the start of the simulation the simulation model generates a waiting list with two weeks of surgery load. Half of the due dates of these surgeries are set to the end of week three; the other half of the due dates is set to the end of week 4. This is an approximation of the situation after the warm-up period and may result in a small deviation of the surgery schedule during the first three weeks, compared to the other weeks. This effect is however small, so we will assume that there is no warm-up time.
4.3.2 Number of replications
day is at most approximately 1 minute off target, with a 95% chance. The resulting γ for each
criterion is given in Table 4.6.
Criterion γ
[image:47.595.68.252.133.215.2]Utilization 0.00227 Overtime per week 0.0439 % cancelled surgeries 0.0457 Table 4.6: relative error γ per criterion
We computed the confidence-interval half-length after 2 replications and divided it by the mean values. If this value was larger than the adjusted γ’ (γ’= γ/(1+γ)), we added one replication and computed the confidence-interval half-length again. If the confidence-interval half-length divided by the mean values is smaller than γ’ for all performance criteria, we stop the procedure and conclude that the current number of replications is the least number of replications for which the estimated means are at most 0.2 percentage point off target, with a confidence level of 95%.
After 13 replications, all performance criteria satisfy the stopping criterion for vascular surgery. The same is true for urology after 20 replications. See Appendix F for the results. This difference is due to the smaller number of OR-days urology has per week, 3, compared to vascular surgery, 5. Based on this difference, we would expect the minimal number of replications for urology to equal 5/3 times the minimal number of replications for vascular surgery, which is approximately the case.
To simulate these replications easily, we multiply the number of weeks and the number of surgeries per year by the number of replications. In this way, all replications can be performed jointly.
4.3.3 Simulation fine tuning
duration in the scheduling. In Section 2.3, we described three important indicators. We have fine tuned the simulation model in such a way that the values given in Table 4.7 are reached.
Performance indicator Vascular surgery Urology
Gross occupation 92 93
Cancelled surgeries 4.4% 4.8%
Average overtime per day (min) 22 18 Table 4.7: OR performance in 2008
In Table 4.8 and Table 4.9, we show the settings that produce figures that are the most similar to practice. We used the required amount of replications in this study, which are determined in Section 4.3.2. Note that the utilization in the simulation is lower than the utilization in practice. In practice, a higher utilization rate can be achieved, because long periods of idle time, caused by no-show or early end for example, can be filled with extra (emergency) surgeries. This is currently not possible in the simulation model.