What’s in a Name?
Entity Type Variation across Two Biomedical Subdomains
Claudiu Mih˘ail˘a and Riza Theresa Batista-Navarro
National Centre for Text Mining
School of Computer Science, University of Manchester Manchester Interdisciplinary Biocentre,
131 Princess Street, M1 7DN, Manchester, UK [email protected] [email protected]
Abstract
There are lexical, syntactic, semantic and discourse variations amongst the languages used in various biomedical subdomains. It is important to recognise such differences and understand that biomedical tools that work well on some subdomains may not work as well on others. We report here on the semantic variations that occur in the sublanguages of two biomedical subdo-mains, i.e. cell biology and pharmacology, at the level of named entity information. By building a classifier using ratios of named entities as features, we show that named en-tity information can discriminate between documents from each subdomain. More specifically, our classifier can distinguish between documents belonging to each sub-domain with an accuracy of 91.1% F-score.
1 Introduction
Biomedical information extraction efforts in the past decade have focussed on fundamental tasks needed to create intelligent systems capable of improving search engine results and easing the work of biologists. More specifically, re-searchers have concentrated mainly on named en-tity recognition, mapping them to concepts in curated databases (Krallinger et al., 2008) and extracting simple binary relations between enti-ties. Recently, an increasing number of resources that facilitate the training of systems to extract more detailed information have become available, e.g., PennBioIE (Kulick et al., 2004), GENE-TAG (Tanabe et al., 2005), BioInfer (Pyysalo et al., 2007), GENIA (Kim et al., 2008), GREC (Thompson et al., 2009) and Metaknowledge GE-NIA (Thompson et al., 2011). Moreover, several
other annotated corpora have been developed for shared task purposes, such as BioCreative I, II, III (Arighi et al., 2011) and BioNLP Shared Tasks 2009 and 2011 (Cohen et al., 2009; Kim et al., 2011).
Many of the tools currently used for biomedi-cal language processing were trained and evalu-ated on such popular corpora, most of which con-sist of documents from the molecular biology sub-domain. However, previous studies (discussed in Section 2) have established that different biomed-ical sublanguages exhibit linguistic variations. It follows that tools which were developed and eval-uated on corpora derived from one subdomain might not always perform as well on corpora from other subdomains. Understanding these linguistic variations is essential to the process of adaptat-ing natural language processadaptat-ing tools to new do-mains.
In this paper, we highlight the variations be-tween biomedical sublanguages by focussing on the different types of named entities (NEs) that are relevant to them. We show that the frequen-cies of different named entity types vary enough to allow a classifier for scientific subdomains to be built based upon them.
The study is performed on open access jour-nal articles present in the UK PubMed Central1 (UKPMC) (McEntyre et al., 2010), an article database that extends the functionality of the orig-inal PubMed Central (PMC) repository2. This database was chosen as our source, since most of the documents within it are already tagged with named entity information. We report here on the results obtained for two biomedical subdomains,
1
http://ukpmc.ac.uk/
2http://www.ncbi.nlm.nih.gov/pmc
i.e. cell biology and pharmacology. Our focus on these two particular subdomains is motivated by an increasing interest expressed by the biomedi-cal research community, according to recent find-ings that have shown their relevance to discover-ing possible causes and treatments for incurable diseases, such as cancer or Alzheimer’s Disease.
2 Related work
Harris (1968) introduced a formalisation of the notion of sublanguage, which was defined as a subset of general language. According to this theory, it is possible to process specialised lan-guages, since they have a structure that can be ex-pressed in a computable form. More recently, sev-eral works on the study of biomedical languages substantiated his theory.
For instance, Sager et al. (1987) worked on pharmacological literature and lipid metabolism, whereas Friedman et al. (2002) analysed the prop-erties of clinical and biomolecular sublanguages.
Other studies have investigated the differ-ences between general and biomedical lan-guages by focussing on specific linguistic aspects, such as verb-argument relations and pronomi-nal anaphora. For instance, Wattarujeekrit et al. (2004) analysed the predicate-argument structures of 30 verbs used in biomedical articles. Their re-sults suggest that, in certain cases, a significant difference exists in the predicate frames compared to those obtained from analysing news articles in the PropBank project (Palmer et al., 2005). Sim-ilarly, based on the GENIA and PennBioIE cor-pora, Cohen et al. (2008) performed a study of argument realisation with respect to the nominal-isation and alternation of biomedical verbs. They concluded that there is a high occurrence of these phenomena in this semantically restricted do-main, and underline that this sublanguage model applies only to biomedical language.
Taking a different angle, Nguyen and Kim (2008) examined the differences in the use of pronouns by studying general domains (MUC and ACE) and one biomedical domain (GENIA). They observed that compared to the MUC and ACE corpora, the GENIA corpus has significantly more occurrences of neutral and third-person pro-nouns, whilst first and second person pronouns are non-existent.
Verspoor et al. (2009) measured lexical and structural variation in biomedical Open Access
journals and subscription-based journals, con-cluding that there are no significant differences between them. Therefore, a model trained on one of these sources can be used successfully on the other, as long as the subject matter is maintained. Furthermore, they compared a mouse genomics corpus with two reference corpora, one composed of newswire texts and another of general biomed-ical articles. In this case, unsurprisingly, signifi-cant differences were found across many linguis-tic dimensions. Relevant to our study is the com-parison between the more specific mouse genome corpus to the more general biomedical one: whilst similar from some points of view, such as nega-tion and passivisanega-tion, they differ in sentence length and semantic features, such as the presence of various named entities.
Our work is most similar to that of Lippincott et al. (2011), in which a clustering-based quantita-tive analysis of the linguistic variations across 38 different biomedical sublanguages is presented. They investigated four dimensions relevant to the performance of NLP systems, i.e. vocabulary, syntax, semantics and discourse structure. With regard to semantic features, the authors induced a topic model using Latent Dirichlet Analysis for each word, and then extended the model to docu-ments and subdomains according to observed dis-tributions. Their conclusion is that a machine learning system is able to create robust clusters of subdomains, thus proving their hypothesis that the commonly used molecular biology subdomain is not representative of the domain as a whole.
In contrast, we examine the differences be-tween biomedical sublanguages at the semantic level, using only named entities. Furthermore, we choose to perform our analysis only on two subdomains (i.e. cell biology and pharmacology), and try to classify these by using supervised ma-chine learning algorithms.
3 Methodology
3.1 Corpus development
Our corpus was created by first searching the NLM Catalog3 for journals whose Broad Sub-ject Term attributes contain only cell biologyor
pharmacology, and then narrowing down the
re-sults to those which are in English and avail-able via PubMed Central. Also, since we are concentrating on full-text documents, we retained only those journals that are available within the PubMed Open Access subset4. According to this procedure, we obtained a final list of two journals for cell biology and six for pharmacology.
Using the PMC IDs of all articles published in the selected journals, we retrieved documents from UK PubMed Central. This database was chosen as our source as the documents it contains are already tagged with named entity information. A total of 360 articles was retrieved for each cat-egory, i.e. cell biology and pharmacology.
The retrieved documents were encoded in XML format. Several unusable fragments were removed before converting them to plain text. Ex-amples of such fragments are article metadata (au-thors, their affiliations, publishing history, etc.), tables, figures and references. Table 1 shows the statistics regarding the corpus following the ap-plication of the pre-processing step. In the case of pharmacology, the document collection con-tains almost 1.4 million words, whilst the set of cell biology articles consists of almost 2.5 million words. The ratio of named entities to the total number of words is almost the same in the two collections, i.e. about 10%.
Subdomain Cell biology Pharmacology
No. of docs. 360 360
No. of words 2.49 m. 1.35 m. No. of NEs 231761 103484
Table 1: Named entity types and their source.
3.2 Tagging of Named Entities
To extract named entities from the corpus, we used a simple method that augments the named entities present in the UKPMC articles with the output of two named entity recognition tools
3
http://www.ncbi.nlm.nih.gov/ nlmcatalog
4http://www.ncbi.nlm.nih.gov/pmc/
tools/openftlist
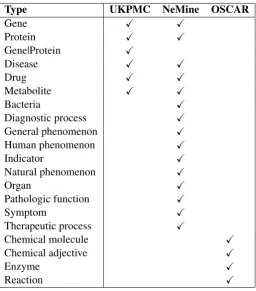
(NERs), i.e. NeMine and OSCAR. The types of entities in the output be each of the two tools, to-gether with the NE types present in the UKPMC articles, are summarised in Table 2.
Named entities in the UKPMC database were identified using NeMine (Sasaki et al., 2008), a dictionary-based statistical named entity recogni-tion system. This system was later extended and used by Nobata et al. (2009) to recognise more types, such as phenomena, processes, organs and symptoms. We used this most recent version of the software as our second source of more diverse entity types.
The Open-Source Chemistry Analysis Rou-tines (OSCAR) software (Jessop et al., 2011) is a toolkit for the recognition of named entities and data in chemistry publications. Currently in its fourth version, it uses three types of chemical en-tity recognisers, namely regular expressions, pat-terns and Maximum Entropy Markov models.
In total, 20 different classes of entities were considered in this study. However, due to the combination of several NERs, some NE types are identified by more than one NER. Furthermore, some of the NE types are more general and cover other more specific types, which are also anno-tated by one or mroe of the tools. This can lead to double annotation. For instance, theGene|Protein
type is more general than bothGeneandProtein, whereas the Chemical moleculetype is a hyper-nym ofGene, Protein, DrugandMetabolite. In the case of multiple annotations over the same span of text, we removed the more general labels, so that each NE has only one label. Contradictory cases, where two NERs label one NE with com-pletely different tags, were not found.
After augmenting the existing NEs by running the two NER tools on the corpus, the outputs were combined to give a single “silver” annotation list. This operation was performed by computing the mathematical union of the three individual anno-tation sets, as shown in Equation 1.
ASilver =AUKPMC∪AOscar∪ANeMine (1)
Type UKPMC NeMine OSCAR
Gene X X
Protein X X
Gene|Protein X
Disease X X
Drug X X
Metabolite X X
Bacteria X
Diagnostic process X
General phenomenon X
Human phenomenon X
Indicator X
Natural phenomenon X
Organ X
Pathologic function X
Symptom X
Therapeutic process X
Chemical molecule X
Chemical adjective X
Enzyme X
[image:4.595.168.425.69.361.2]Reaction X
Table 2: Named entity types and their source.
exclusively. It can be observed that some entity types have approximately the same percentages in the two subdomains, e.g. phenomena and reac-tions. However, large differences can be observed in the case of some of the other entity types. For instance, chemical molecules occur twice as of-ten in pharmacology articles than in cell biology, whereas proteins appear almost three times more often in cell biology than in pharmacology.
3.3 Experimental setup
Using the corpus described previously, we cre-ated a training set for supervised machine learn-ing algorithms. Every document in the corpus was transformed into a vector consisting of 20 features. Each of these features corresponds to an entity type in Table 2, having a numeric value ranging from 0 to 1. This number represents the ratio of the specific entity type to the total number of named entities recognised in that document, as shown in Equation 2.
θ= ntype
N (2)
where ntype represents the number of NEs of a certain type in a document andN represents the total number of NEs in that document.
Furthermore, each vector was labelled with the subdomain to which the respective document be-longs (i.e., cell biology or pharmacology).
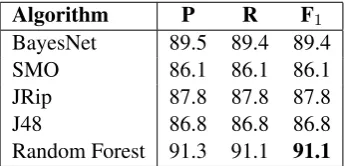
Weka (Witten and Frank, 2005; Hall et al., 2009) was employed as the machine learning framework, due to its large variety of classifica-tion algorithms. We experimented with a large number of classifiers, ranging from Bayesian nets to functions, decision trees, decision rules and meta-classifiers. The best performing classifiers are shown in Table 4. BayesNet is an implemen-tation of Bayesian Networks, SMO is an imple-mentation of Support Vector Machines, J48 is an implementation of decision trees, whilst Jrip is an implementation of decision rules. Random For-est is an ensemble classifier that consists of many decision trees (in this study, J48 was used), out-putting the class that occurs most frequently in the output of individual trees.
Type CellBio Pharma
Enzyme 0.05% 0.09%
Bacteria 0.01% 0.16%
Chemical adjective ≈0% ≈0% Chemical molecule 30.13% 60.86% Diagnose process 0.03% 0.23%
Disease 3.35% 4.27%
Drug 1.25% 2.83%
Gene 0.87% 1.09%
Gene|Protein 5.02% 0.89% General phenomenon ≈0% 0.01% Human phenomenon 0% ≈0%
Indicator 0.36% 0.16%
Metabolite 3.26% 7.53%
Natural phenomenon 0.02% 0.1%
Organ 0.09% 0.27%
Pathologic function 0.04% 0.04%
Protein 53.31% 19.13%
Reaction 1.71% 1.31%
Symptom 0.03% 0.06%
[image:5.595.81.282.69.359.2]Therapeutic process 0.47% 0.96%
Table 3: Ratios of NE types to the total number of NEs in the two subdomains.
4 Results
The previously described features were used as in-put to various supervised machine learning algo-rithms; results and error analysis are provided in Section 4.1 and Section 4.2, respectively.
4.1 Experimental results
As can be seen from Table 4, Random Forest performs best, with 91.1% F-score. The other three classifiers give lower results, varying be-tween 86% and 89.5%.
Algorithm P R F1
BayesNet 89.5 89.4 89.4
SMO 86.1 86.1 86.1
JRip 87.8 87.8 87.8
J48 86.8 86.8 86.8
Random Forest 91.3 91.1 91.1
Table 4: Classification results for the best-performing algorithms.
We also employed AdaBoost in conjunction with the previously mentioned four classifiers, and the results are given in Table 5. AdaBoost is a meta-algorithm that adapts itself during the
course of several iterations in the sense that in each iteration, classifiers built are tweaked to cor-rect those instances misclassified by prior classi-fiers. In this study, AdaBoost was run over 20 iterations, and it significantly improved the result of J48, by almost 4%, to 90.3%. However, Ad-aBoost decreased the F-score of Random Forest by 1% and that of BayesNet by 0.3%.
Algorithm P R F1
BayesNet 89.2 89.2 89.2
SMO 86.1 86.1 86.1
JRip 87.9 87.9 87.9
J48 90.3 90.3 90.3
[image:5.595.323.498.189.273.2]Random Forest 90.3 90.1 90.1
Table 5: Classification results for AdaBoost in con-junction with the best-performing algorithms.
In order to determine which features have the most influence on classification, regardless of the classifying algorithm, two attribute evaluators were used to measure the information gain for each feature and to compute the value of the chi-squared statistic with respect to the class. The val-ues obtained are shown in Table 6, and to illustrate their influence, are plotted in Figure 1, after being normalised.
Unsurprisingly, Protein is the feature with the most discriminatory power, considering it has the highest count and it occurs almost three times more often in the cell biology class than in the pharmacology class. Chemical moleculesfollow closely, again due to a high count and large differ-ence between the classes. Due to their high scores obtained from the attribute evaluators, we ran the experiment again considering only these two fea-tures. The Random Forest classifier achieved an F-score of 80% using these parameters.
At the other end of the scale, there are five features which have very little influence in dis-criminating between the two classes. The corre-sponding named entity types have the lowest oc-currence counts in the corpora, with the exception
of Organ. When running Random Forest with
these five features only, an F-score of 50.5% is obtained. This result is very close to the baseline, surpassing it by only a small fraction.
4.2 Error analysis
[image:5.595.94.267.577.660.2]classi-Attribute InfoGain ChiSquare
Protein 0.4482 386.5648
Chemical molecule 0.3169 272.0111 Gene|Protein 0.2265 211.8034 Indicator 0.1805 170.0186
Gene 0.1718 156.9504
Metabolite 0.1667 155.8135
Reaction 0.1545 144.6946
Drug 0.1301 124.2604
Therapeutic process 0.1259 111.4571
Disease 0.1189 111.1882
Chemical adjective 0.0642 55.5556
Enzyme 0.0473 41.089
Diagnostic process 0.0388 32.1161
Bacteria 0.0297 26.0522
Natural phenomenon 0.0227 20.8004 Pathologic function 0 0
Symptom 0 0
General phenomenon 0 0
Organ 0 0
[image:6.595.306.511.68.289.2]Human phenomenon 0 0
Table 6: Attribute selection output from two attribute evaluators.
fier, the best performing algorithm. Of these, 45 (i.e. 70%) are cell biology papers which were in-correctly classified as belonging to pharmacology, whilst the remaining 19 belong to the pharmacol-ogy class and are classified as cell biolpharmacol-ogy.
Labelled as Cell_bio Pharma
Cell_bio 315 19
Pharma 45 341
Table 7: Confusion matrix for the Random Forest clas-sifier.
As previously mentioned, the two features that achieved the highest information gain are the ra-tios for theProteinandChemical moleculetypes. Accordingly, only these two features were consid-ered in this error analysis.
We firstly examined the features of the cell biology documents which were incorrectly clas-sified as pharmacology papers. It was notice-able that the majority of the misclassified doc-uments in this case have a small percentage of
Proteins (less than 0.35) and/or a large percent-age ofChemical molecules (greater than 0.58). To confirm this observation, a sample of documents
0 0.05 0.1 0.15 0.2 0.25 0.3 0.35 0.4 0.45 InfoGain ChiSquare Protei n Chem ical mole cule Gene |Protei n Indi cator Gene Metab olite Reactio n Drug Ther ape utic pr ocess Disea se Chem ical adj ective Enzym e Diag nost
ic pr oce
ss
Bacter ia
Natu ral p
heno men
on
Patho logi
c fun ction
Sym ptom
Gene ral p
heno men on Org an Hum an p
heno men
[image:6.595.73.295.73.360.2]on
Figure 1: Normalised attribute selection output from two attribute evaluators.
was accessed via the PubMed Central page which provides links to identified entities such as com-pounds, substances, genes and proteins. For in-stance, the misclassified cell biology paper with PMCID 2755470 was found to have no proteins, whilst the one with PMCID 2679709 has quite a large number of substances (chemical molecules). We also analysed the features of papers in the pharmacology subdomain which were misclassi-fied as cell biology documents. In contrast to the first type of misclassification, these documents have a large percentage of Proteins and/or small percentage of Chemical molecules. For example, the pharmacology paper with PMCID 2817930 contains many protein instances, whilst the one with PMCID 2680808 has no mentions of chemi-cal molecules.
5 Conclusions and Future Work
[image:6.595.100.263.497.541.2]developed for a particular subdomain to new sub-domains.
One possible future direction is to analyse mul-tiple medical subdomains, such as neurology, vi-rology and critical care. This could enable the measurement of the distance between various sub-domains with respect to specific named entity types. Furthermore, a comparison of the method described above with those using bag-of-words or other non-semantic features could further en-force the importance of named entities in doc-ument classification and sublanguage identifica-tion.
Acknowledgements
We would like to acknowledge the help given by Dr. C.J. Rupp in obtaining the collection of documents from the Open Access section of the UKMPC.
References
Cecilia Arighi, Zhiyong Lu, Martin Krallinger, Kevin Cohen, W Wilbur, Alfonso Valencia, Lynette Hirschman, and Cathy Wu. 2011. Overview of the BioCreative III Workshop. BMC Bioinformat-ics, 12(Suppl 8):S1.
Kevin Bretonnel Cohen, Martha Palmer, and Lawrence Hunter. 2008. Nominalization and alternations in biomedical language. PLoS ONE, 3(9):e3158, 09. Kevin Bretonnel Cohen, Dina Demner-Fushman,
Sophia Ananiadou, John Pestian, Jun’ichi Tsujii, and Bonnie Webber, editors. 2009. Proceedings of the BioNLP 2009 Workshop. Association for Com-putational Linguistics, Boulder, Colorado, June. Carol Friedman, Pauline Kra, and Andrey Rzhetsky.
2002. Two biomedical sublanguages: a description based on the theories of Zellig Harris. Journal of Biomedical Informatics, 35(4):222–235.
Mark Hall, Eibe Frank, Geoffrey Holmes, Bernhard Pfahringer, Peter Reutemann, and Ian H. Witten. 2009. The weka data mining software: An update.
SIGKDD Explorations, 11(1).
Zellig Harris. 1968. Mathematical Structures of Lan-guage. John Wiley and Son, New York.
David Jessop, Sam Adams, Egon Willighagen, Lezan Hawizy, and Peter Murray-Rust. 2011. Oscar4: a flexible architecture for chemical text-mining.
Journal of Cheminformatics, 3(1):41.
Jin-Dong Kim, Tomoko Ohta, and Jun’ichi Tsujii. 2008. Corpus annotation for mining biomedi-cal events from literature. BMC Bioinformatics, 9(1):10.
Jin-Dong Kim, Yue Wang, Toshihisa Takagi, and Aki-nori Yonezawa. 2011. Overview of genia event task in bionlp shared task 2011. In Proceedings of BioNLP Shared Task 2011 Workshop, pages 7– 15, Portland, Oregon, USA, June. Association for Computational Linguistics.
Martin Krallinger, Alexander Morgan, Larry Smith, Florian Leitner, Lorraine Tanabe, John Wilbur, Lynette Hirschman, and Alfonso Valencia. 2008. Evaluation of text-mining systems for biology: overview of the second biocreative community challenge.Genome Biology, 9(Suppl 2):S1. Seth Kulick, Ann Bies, Mark Liberman, Mark Mandel,
Ryan McDonald, Martha Palmer, Andrew Schein, and Lyle Ungar. 2004. Integrated annotation for biomedical information extraction. InProceedings of the BioLINK 2004.
Thomas Lippincott, Diarmuid Seaghdha, and Anna Korhonen. 2011. Exploring subdomain varia-tion in biomedical language. BMC Bioinformatics, 12(1):212.
Johanna R. McEntyre, Sophia Ananiadou, Stephen Andrews, William J. Black, Richard Boulderstone, Paula Buttery, David Chaplin, Sandeepreddy Che-vuru, Norman Cobley, Lee-Ann Coleman, Paul Davey, Bharti Gupta, Lesley Haji-Gholam, Craig Hawkins, Alan Horne, Simon J. Hubbard, Jee-Hyub Kim, Ian Lewin, Vic Lyte, Ross MacIn-tyre, Sami Mansoor, Linda Mason, John Mc-Naught, Elizabeth Newbold, Chikashi Nobata, Ernest Ong, Sharmila Pillai, Dietrich Rebholz-Schuhmann, Heather Rosie, Rob Rowbotham, C. J. Rupp, Peter Stoehr, and Philip Vaughan. 2010. UKPMC: a full text article resource for the life sci-ences.Nucleic Acids Research.
Ngan L. T. Nguyen and Jin-Dong Kim. 2008. Explor-ing domain differences for the design of pronoun resolution systems for biomedical text. In Proceed-ings of the 22nd International Conference on Com-putational Linguistics - Volume 1, COLING ’08, pages 625–632, Stroudsburg, PA, USA. Association for Computational Linguistics.
Chikashi Nobata, Yutaka Sasaki, Noaki Okazaki, C. J. Rupp, Jun’ichi Tsujii, and Sophia Ananiadou. 2009. Semantic search on digital document reposi-tories based on text mining results. InInternational Conferences on Digital Libraries and the Semantic Web 2009 (ICSD2009), pages 34–48.
Martha Palmer, Daniel Gildea, and Paul Kingsbury. 2005. The proposition bank: An annotated cor-pus of semantic roles. Computational Linguistics, 31(1):71–105.
Naomi Sager, Carol Friedman, and Margaret Lyman. 1987. Medical Language Processing: Computer Management of Narrative Data. Addison-Wesley, Reading, MA.
Yutaka Sasaki, Yoshimasa Tsuruoka, John McNaught, and Sophia Ananiadou. 2008. How to make the most of NE dictionaries in statistical NER. BMC Bioinformatics, 9(Suppl 11):S5.
Lorraine Tanabe, Natalie Xie, Lynne Thom, Wayne Matten, and W John Wilbur. 2005. GENETAG: a tagged corpus for gene/protein named entity recog-nition.BMC Bioinformatics, 6(Suppl 1):S3. Paul Thompson, Syed Iqbal, John McNaught, and
Sophia Ananiadou. 2009. Construction of an an-notated corpus to support biomedical information extraction. BMC Bioinformatics, 10(1):349.
Paul Thompson, Raheel Nawaz, John McNaught, and Sophia Ananiadou. 2011. Enriching a biomedi-cal event corpus with meta-knowledge annotation.
BMC Bioinformatics, 12(1):393.
Karin Verspoor, Kevin Bretonnel Cohen, and Lawrence Hunter. 2009. The textual characteristics of traditional and open access scientific journals are similar. BMC Bioinformatics, 10(1):183.
Tuangthong Wattarujeekrit, Parantu Shah, and Nigel Collier. 2004. PASBio: predicate-argument struc-tures for event extraction in molecular biology.
BMC Bioinformatics, 5(1):155.