90 JOURNAL OF LIGHTWAVE TECHNOLOGY. VOL. 18. NO. 1, JANUARY 2000
Effects of Random Phase and Amplitude Errors in
Optical Fiber Bragg Gratings
Ricardo Feced and Michalis
N.
ZervasAbstractThis paper studies the influence of random phase and amplitude fabrication errors on the performance of optical filters based on fiber Bragg gratings (FBG’sj. In particular, we analyze two effects of particular importance for optical communications: the excess crosstalk induced in apodiaed gratings commonly used in wavelength-division-multiplexing (WDM) systems, and the time-delay fluctuations that appear in chirped gratings employed tu compensate the fiber dispersion. A statistical model is presented to explain these effects in terms of the coherence length of the grating fabricatiun procedure.
Index Terms-Gratings, noise, optical fiber communication.
I. INTRODUCTION
HE performance of optical components is usually
T
degraded by random fluctuations of their optical or geometrical properties. Rayleigh scattering, for instance, is a typical example of scattering induced by random fluctuations of an optical property of the medium: the refractive index [I], [2]. On the other hand, random deviations of the device geometry, like roughness of its surfaces or randomness in the periodicity of gratings, can also be responsible for enhanced scattering in many optical components [3]. In this paper, we investigate the effect of random optical m d geometrical fluctuations on the performance of optical fiber gratings (OFG’s) as optical filters. The problem of random propagation in one dimension has been extensively studied in many different contexts [4]-[6]. The moment-propagation method, for example, studies the evolu- tion of the second order field statistics along the medium, and can be used to predict the amount of backscattered power [4], [5]. Sometimes, it is important to analyze not only the scattered power, but also the evolution of the optical phase of the propa- gating wave. This is specially important for interferometric op- tical devices, where fluctuations of the waveguide effective re- fractive index can give rise to a random-walk of the optical phase that deteriorates their performance [7], [XI.In recent years, OFG’s have become key components in high speed optical fiber communication systems. The technology of UV photoinduced fiber gratings [Y] has reached now high ma- turity, enabling the fabrication of complex OFG-based filters to perform various functions such as selection of wavelength mul- tiplexed channels or compensation of the link dispersion, Sev- eral experimental techniques have been demonstrated to fabri- cate nonuniform gratings, permitting an accurate control of both the local grating period and the apodization profile along the
Manuscript received July 9, 1999.
The authors are with the Optoelectronics Research Centre, University of
Publisher Item Identifier S 0733~8724(00)00393~5. Southampton, Southampton SO17 IBJ, U.K.
structure [IO], [ l l ] . However, the fabrication of increasingly longer OFG’s with improved spectral response is limited by the need to maintain the coherence of the grating phase along the whole structure. Numerical experiments have shown that random coupling can have important implications in the perfor- mance of practical filters [31, [12].
In this paper, we study the effect of small random phase or amplitude fluctuations imprinted on the grating during the fab- rication process on the spectxal response of the filter. We will present a method to calculate the main statistics of the filter response, like average reflectivity or average time-delay fluc- tuations, in terms of a characteristic coherence length of the grating. The method, which relies on a perturbation approach, calculates ensemble averages of the spectral response parame- ters of gratings perturbed with a random-walk phase. In partic- ular, we will focus on two cases of particular importance for op- tical communications: the excess crosstalk induced in apodized gratings commonly used in wavelength-division-multiplexing (WDMj systems, and the time-delay fluctuations that appear in chirped gratings employed to compensate the fiber dispersion. The paper is organized as follows. Section I1 describes the prop- agation in OFG’s subjected to random phase and amplitude er- rors. The statistical averages for the main parameters of their spectral response is then calculated in Section 111. We finally apply the theory developed to the two particular cases previ- ously discussed apodized (Section IVj, and chirped (Section Vj OFG’s.
11. PROPAGATION IN FIBER GRATINGS WITH RANDOM PHASE
AND AMPLITUDE EVOLUTION
In this section, we describe the optical propagation in OFG’s with random phase or amplitude errors along their structure. The magnitude of the phase errors will be characterized in terms of a “coherence length” for the grating. In the following sections, we will present a method to calculate ensemble averages of the main parameters
of
the OFG spectral response, and discuss their dependence on the coherence length previously introduced.A. Refractive Index Pertnrhation in Fiber Gratings
Bragg gratings are fabricated in optical fibers by exposing their core to a periodic ultraviolet (UVj pattern. Initially, a holographic method based on
an
split-beam interferometer[Y] demonstrated the possibility of writing gratings by means of transverse UV exposure. A more recent development, that greatly simplifies the requirements of the OFG fabrication setup, is the use of diffractive optical phase-mask gratings [13], [141. A third technique in which the grating is transversely
E C E O A N 0 ZERVAS: RANDOM PHASE A N 0 AMPLITUDE ERRORS IN OFTICAL FBG‘S
~
91
written point by point by accurately controlling the position and spot size of the UV beam has also been demonstrated
[15].
These three basic techniques have been modified and improved to fabricate long gratings with accurate control over the photo-induced refractive index modulation. The first extension is the phase-mask scanning technique in which the laser beam is scanned over a long and high-quality phase-mask [lo], [16]. An altemative procedure to write long gratings is to accurately move and monitor the position of the fiber by means of an interferometer while exposing it to a time-modulated short UV interference pattem [ l l ] . This is probably the most versatile approach, and complex filters designs have been demonstrated with this technique [17], [IS].
Independently
of
the technique used to write OFG, phase and amplitude errors are likely to occur due to the stringent re- quirements of accuracy and stability necessary in the fabrication process. There are a great variety of possible sources for these errors. Some of them are associated with the fabrication method, like phase-errors of phase masks, uncertainty of the fiber posi- tion in interferometrically controlled methods, lack of mechan- ical stabilityof the fabrication setup, or fluctuations in the UV
fluence. Others are intrinsic to the photosensitive fiber, like ge- ometrical or compositional fluctuations.The effective refractive index n ( z ) along an OFG can be de- scribed as
where no is the average effective refractive index, and KO(=
%/A),
An(.) and S(z) specify the deterministic grating pa- rameters: A is a reference period, An(.) accounts for the local grating strength (apodization), and S(z) will determine its phase variation and local period. The random properties of the grating are described by the phase and amplitude stochastic processes$ ( z ) and F , ( z ) . The local period A(z) of the grating is deter-
mined by both the deterministic phase term S ( z ) and the random phase term
$(z)(A-’(z)
=A-’
+
(01
+
U;/)/Zn).The phase and the amplitude noise are usually partially corre- lated. Fluctuations of the fluence during the fabrication process contribute to both sources of noise, giving rise to some corre- lation among them. However, in this paper we study the effects of the phase and amplitude noises separately, as if they were statistically independent. The method presented could easily be extended to take into account phase-amplitude correlations.
1 ) Phase-Noise: We will assume that the random fluc-
tuations of the local spatial angular frequency (=27r/A(z)) along the grating can he modeled by a zero-average, stationary, Gaussian process
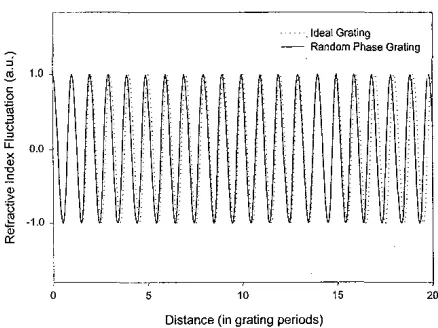
F4(z). Fig. 1 illustrates the evolution of the
refractivc index pciturbation in a grating subjccted to random phase-noise, The phase term U;(zj in ( I ) will be driven byF 4 ( a )
according to the expression1
1
0 5 10 15 20
Distance (in grating periods)
Illustration of a grating subjected 10 phase errors. - - - :Ideal grating.
Fig. 1 .
~ :Grating with phase-noise.
The variance for the increments of $ ( z ) can now he calculated
as
[I91where
R F + ( T )
is the autocorrelation function forF~o(z).
In standard OFG fabrication techniques the correlation length for F # ( z ) is usually much smaller than the grating length and, therefore, its spectrum is broad compared to the grating spectral response. Consequently, in most situations we can regard F*b(z) as a white Gaussian noise. In this case, the phase $ ( z ) evolves as a Brownian random-walk motion 1191, [20], being driven by the delta-correlated Langevin forceF+(z)
that accounts for random fluctuations of the local period along the grating.$ ( z )
will also follow Gaussian statistics, with independent increments, and zero average. In analogy with a single-mode laser, we will define both a “coherence length”Lcoh
anda
“linewidth parameter”y
that characterizes the variance U’ of the increments of$ ( z )
[21]2
2
( $ ( z+
A)
- d ( z ) ) = -IAl = 4rlAl ( 4 )where RF0(7) was taken equal to 26(7)/L,,h in (3), &(T)
being the Dirac delta. From (4), we see that Ihc srdndard deviation of the random phase variation along a grating period
A
is,/-.
The Gaussian nature of the increments of4(zj permits the calculation of the autocorrelation P(A)of the random phase term in (1)
LCOh
( 5 )
)
R(A) == e -21’ ~ ~ e-1411Lcd~ = e-’Ylnl
where (.) stands for ensemble average. The “coherence length’
L,:,,,,
previously defined measures the distance along which thereis
substantial dephasing with respect to the perfect deter- ministic grating. It can be regarded as a figure of merit for the grating fabrication system, being ideally as large as possible. [image:2.617.309.528.86.250.2]92 JOURNAL OF LIGHTWAVE TECHNOLOGY, VOL. 18, NO. I, JANUARY ZWO
process
F,(zj
in (1) is a zero-average, Gaussian white-noise. Consequently, its autocolrelation will be( K ( Z
+
T ) F a ( Z j ) = ?76(T) ( 6 )where the factor 7) provides a measure for the magnitude of the amplitude noise. If the grating is sampled in small sections of length A, then the variance of the relative amplitude fluctuations for each sample is given in terms of 7 by
A can be considered as the inverse of a maximum cutoff spatial frequency for the white noise. Its value is primarily determined by the writing method and is usually of the order of a few hun- dred microns. As typical noise cutoff frequencies correspond to optical reflection bandwidths much broader than those of the deterministic OFG's, the assumption of delta-correlated noise sources is expected to he a good approximation in most physical situations. However, the method presented in following sections to calculate ensemble averages does not rely on this assumption, and can be generalized to take into account different statistics for the noise sources.
B . Coupled-Mode Equations
The one-dimensional scattering problem for an OFG is usu. ally described in the framework of the coupled-mode formalism [22]-[24]. The scattering equations are written in terms of two counter-propagating waves, b ~ ( z ,
p),
backward propagating, and b ~ ( z ,p),
forward propagatingwhere /3 is the detuning parameter
(9) 2 k 71, ~
KO
B =
and k is the vacuum propagation constant (=w/c). q ( z j is re-
lated to the grating parameters as
where q o ( z ) is the deterministic parr 01. the coupling function. The OFG reflection spectral response HR(,8) can be cal- culated by solving (8) taking into account the appropriate boundary conditions, i.e., b ~ ( 0 ,
p)
= I and b B ( L , @) = 0, where L is the total length of the gratingf I ~ ( 8 ) = bo(% 0). (11)
The actual backward and forward electric fields
(eo(.,
p)
and e y ( z ,
p))
are related to the waves b ~ ( z ,8)
and b ~ ( z ,0)
through the exmessionsThe main novelty of the present study is that the coupling function q ( z ) is an stochastic process characterized by the co- herence length L,,,, of the fabrication system. We could cal- culate ensemble averages for the main parameters of the OFG spectral response by repetitive solution of the coupled-mode equations (S) for different realizations of the stochastic process q5(z), and subsequent average of the parameters of interest. This would yield information about the average behavior of a batch of gratings written with that fabrication system. In this paper we develop an alternative method to calculate directly these en- semble averages without the need of statistical averages over many realizations of the experiment. The study illustrates the effects of phase and amplitude errors in the performance of OFG and provides insight in the interrelations among the var- ious grating and fabrication system parameters.
C . Approximate Spectral Response for OFG Perturbed with Random Noise
The main difficulty to calculate ensemble averages for param- eters related with the OFG spectral response H R ( / ~ ) is the non- linear relation existing between H R ( 0 ) and the coupling func- tion q ( z ) . Simple linear approximations like the first-order Bom approximation are inaccurate for the analysis of practical grat- ings with reflectivities larger than 50%. In this section we will present a novel linearization method that will enable us to calcu- late ensemble averages in gratings with random phase and am- plitude errors. The method relies on a perturbational analysis with respect to the solution of the ideal deterministic grating characterized by qo(n) given in (10).
Our objective is to express the reflection coefficient I€R(R(P) (1 1) as a linear function of the stochastic coupling function q ( z ) with a good degree of accuracy. The procedure starts by solving exactly the coupled-mode equations for the corresponding de- terministic case characterized by the coupling function y<,(z). The solution of the deterministic equation yields the evolution of the forward and backward deterministic propagation waves
@ ( z ,
/3) and Og(z,p),
and also the spectral response of the unperturbed gratingH i ( 8 ) .
An approximate expression for the spectral response of the perturbed grating Hn(,8) can now he obtained by substituting the calculated forward deterministic wave b g ( a ,0)
for b F ( z ,8 )
in the first equation of system (8). and integrating then the resulting ordinary linear differential equation. The spectral response can be cast in an expression that looks very similar to the first-order Born approximation with a modified coupling function t ( z ,4)
Equation (14b) defines the deterministic modified coupling function $(z,
8).
This modified coupling function can be ap- proximated by q,(z) in those parts of the @-spectrum where theC B ( Z ,
p)
= b g ( z , [j)e+j(''ez/2)FECED A N 0 ZERVAS: RANDOM PHASE AN0 AMPLITUDE ERRORS IN OPTLCAL FBG'S
~
93
grating reflectivity is low. The spectral response
H E ( @ )
is now a stochastic process obtained from a linear transformation of the random coupling function q ( z ) .The OFG spectral response given in (13)
is
obviously exact in the deterministic case, i.e., when phase and amplitude emors are negligible. If the grating has a long coherence length Lcoh and a low amplitude-noise factor q , then the random terms in (14) can be regarded as a small perturbation and (13) gives a good approximation to the grating spectral response. The accuracy of this analysis will be corroborated in following sections by Monte Carlo-type simulations in which the spectral response of a batch of randomly generated gratings will be averaged to obtain estimations for ensemble averages.111. ENSEMBLE AVERAGES FOR GRATING REFLECTIVITY AND
TIME
DELAY FLUCTUATIONSThe two parameters that fully characterize the spectral response of OFG are its reflectivity and time-delay response. They are, respectively, related to the modulus IHR(,B)\ and phase PE(@) of the spectral response
H R ( P ) .
In this section we will derive expressions to calculate ensemble averages for these parameters in presence of both phase-noise (Sections 111-A-111-C) and amplitude-noise (Section 111-D) in the grating coupling function.A. Ensemble Averages for Random Phase Functions
Let us assume first that the grating is only subjected to random phase errors, i.e., F a ( z ) = 0. All the phase-noise ensemble averages that we will need are particular cases of the ensemble average of a general stochastic process P ( p ;
j ( z ,
p ) ,
h(z,
p ) )
defined aswhere * stands for complex conjugate, and g ( z ,
8)
andh ( z ,
0)
are random phase functions defiFed as the product of the deter- ministic functions go(.,
@)
and h,(z,P ) ,
and therandom phase term e J Q ( = ) , namelyTo calculate the ensemble average ( F ( P ; y(z, /3),
h ( z ,
P)))
we first substitute (16) in (15) and, subsequently, evaluate the ensemble average for the random phase terms with the autocor- relation (5). Finally, by transforming the independent variables
we
~
obtain the following expression for the sought average
F ( P ;
.?&,
PI,
h o b ,P ) ;
7):
(18)
where we see that it involves a cross-correlation integral fol- lowed by a weighted Fourier transform.
B .
Average for the Reflectivity in OFG with Phase-NoiseThe ensemble average for the reflectivity can be calculated from the approximate spectral response
H R ( P )
described in (13) together with the method for evaluation of ensemble av- erages shown in (18). Defining the ensemble average for the re- flectivityas
(R(P))
, we findwhich is calculated as the autocorrelation of q 0 ( z ,
P )
followed by a Fourier transform weighted b y a decaying exponential (18).C. Averages for the Time Delay and itsfluctuations in OFG with Phase-Noise
The estimation of the average time-delay and its fluctuations is of particular importance for phase-filters like OFG disper- sion compensators. Generally, the quality of OFG dispersion compensators is evaluated through the standard deviation of its time-delay [25]. For this type of filters, the phase of the spec- tral response i p ~ ( P ) varies rapidly within the reflection band in comparison with its modulus
IHR(P)I.
This fact will permit us to estimate ensemble averages for the time delay of OFG dis- persion compensators.1 j Average Time Delay: The time-delay t d ( B ) is defined in
terms of the spectral phase response
~ ~ ( 0 )
asIn the presence of random phase errors, t@) is a stochastic process. To estimate the ensemble average for the time-delay
94 JOURNAL OF LIGHTWAVE TECHNOLOGY, VOL. 18, NO. 1, JANUARY 2000
where we observe that the imaginary part of this expression is equal to the average of the time-delay weighted by the reflec- tivity. The ensemble average in (21) is calculated as
From (20) -(22) we estimate the ensemble average of the time-delay as
where l m stands for imaginary part, and the two ensemble av- erages have been calculated in (19) and (22). This result is ap- proximate due to the reflectivity weight term that appears in the time-delay average. Expression (23) would he exact in the limit of very weak correlation between the time delay and reflectivity. For small perturbations, the in-band reflectivity of dispersion compensators will be essentially constant and (23) provides a good approximation for the statistics of the time-delay.
2) Fluctuations of Time Delay: Our main interest, however, is to estimate the standard deviation of the time-delay fluctu- ations. To achieve this objective, we need to evaluate the en- semble average of the square of the time delay
(ti(L9)).
We pro- ceed as before, starting with the related ensemble average(24)
where we have assumed slow variations for the modulus
IHn(p)I
of the spectral response within the reflection band. The ensemble average (24) is again calculated in terms ofF
(1%
Now we can estimate ( t ; ( [ j ) ) as
which can he evaluated from (19), (24), and (25). The variance of the time-delay
u$(B) is finally expressed in terms
of (23) and (26) asThe time-delay standard deviation otd(P) will he used in Sec- tion V to discuss the effect of random phase errors on dispersion compensators.
D Average for the RefIecfivity in OFG with Both Amplitude and Phase-Noise
Amplitude noise can also contribute to the deterioration of the hackground level in the spectral response of apodired gratings. In this section, we extend the analysis to calculate the ensemble average for the reflectivity of a grating subjected to both ampli- tude and phase-noise. The main assumption of the calculation is that both noise sources are statistically independent.
Following an analysis similar to that developed in Section 111-A and taking into account the autocorrelation (6) for the rel- ative amplitude-noise F,(z), we calculate the ensemble average of the reflectivity as
. L
( W ) )
=F(P;go(.,
PI,
t d a ,
S);7)cJ
dzI@&>
P)I2?1.
n(28) It is shown that the average reflectivity in this case has two terms. The first one is that corresponding to a grating subjected only to phase-noise (19), while the second contribution is the excess background reflectivity due to a random amplitude as will he discussed in Section IV-B.
IV. EFFECT OF RANDOM PHASE AND AMPLITUDE ERRORS IN APODIZED GRATINGS
FECEO A N 0 ZERVAS: RANDOM PHASE AND AMPLTI'UDE ERRORS IN OPTICAL FBG'S
~
95
I ~~
--~1
-0.5 -0.4 -0.3 -0.2 -0.1 0.0 0.4 0.2 0.3 0.4 0.5
Detuning (nm)
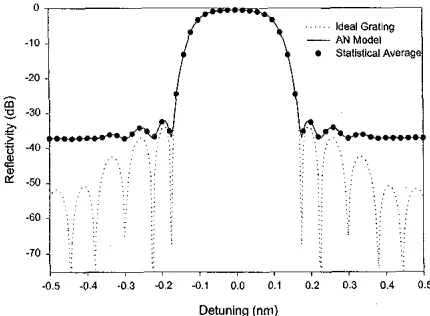
Fig. 2. Reflectivity spectrum of the apodized grating. - - - : Ideal deterministic grating. -: Ensemble average calculated with random phase RP model. e:
Values calculated by averaging over IO00 random experiments.
of the sidelobes and a decrease in the sharpness of the filter's handedge transition.
A .
Effects
of Phase-NoiseTo illustrate the analysis introduced in previous sections, we first consider an OFG with a raised cosine apodization profile. The grating has a total length of 1 cm and a maximum cou- pling constant qFaof
3.5
cm-'. The maximum reflectivity of the grating is 90%. Fig.2
shows the response of the deterministic gratingIHg(p)I'
which exhibits low sidelobes (dashed line). Let us suppose now that the grating was fabricated with a system that hada
coherence lengthL,,I,
of 10 cm. This corresponds to a standard deviation for the random phase variation along a grating period of3
mrad. By using the random phase (RP) model previously developed (19) we can calculate the ensemble av- erage for the reflectivity (solid line). We clearly observe a sub- stantial increase in the out-of-hand background level and a re- duced sharpness of the reflection bandgap edge. The predictions of the RP model were corroborated by statistically averaging the spectral response of 1000 gratings with phase errors randomly generated (solid points in Fig. 2). The agreement between both calculations is very good throughout the reflection spectrum. It is important to note that Monte Carlo-type simulations are very expensive from a computational point of view compared to cal- culations carried out with the proposed R P model.In a second numerical experiment we allowed the coherence length of the fabrication system Lcoh to vary from 1 to 1000 cm. This corresponds to standard deviations for the random phase variation along a grating period that vary from 10 to
0.3
mrad. The ensemble averages of the reflectivity for the cases consid- ered are shown in Fig. 3. We observe that the out-of-band hack- ground level increases and the bandedge sharpness decreases as the coherence length is reduced.The RP model is useful to understand these results and to find the relation between the out-of-band background level and the coherence length of the fabrication system. From (18) and (19) we observe that the ensemble average of the reflectivity is equal to the Fourier transform of the product of the autocorrelation
Detuning (nm)
Fig. 3.
for various values of the coherence length.
Ensemble aversge for the reflectivity spectrum of the apodized grating
1 10 100 1001
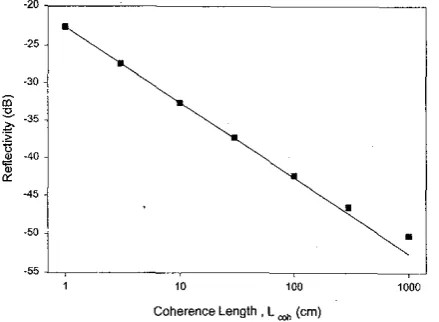
Coherence Length , L mn (cm)
Fig. 4. Ensemble average (.) far the out-of-band reflectivity of the apodized grating at a detuning of 0.5 nm as a function of the coherence length. The solid line (-) is a theoretical fit proportional to L:o:x
of
& ( z ,
/?)
witha decaying exponential. This is equivalent
to the convolution of the deterministic grating reflectivity with a Lorentzian function that accounts for the reduced coherence of the fabrication system. This spectral response would be identical to that obtained if we analyzed the ideal grating by scanning in wavelength a laser with a finite Lorentzian linewidth. The out-of-hand background level is mainly given by the overlap between the reflection band of the grating and the decaying Lorentzian function. A simple integration shows that this overlap i s inversely proportional to the coherence length Lcoh. Fig. 4 shows the out-of-band reflectivity ata
detuning of0.5
nm as a function of the coherence length for the cases previously considered. The solid line is a fit given by [image:6.617.57.283.88.251.2] [image:6.617.311.529.89.249.2] [image:6.617.313.533.304.465.2]96 JOURNAL OF LIGHTWAVE TECHNOLOGY, VOL. 18, NO. I. JANUARY 2000
-
L C O h = l O c m-0.5 -0.4 -0.3 4.2 4.4 0.0 0.1 0.2 0.3 0.4 0.5
Detuning (nm)
Fig. 5. Inverse of the reflectivity spectrum of the apodized grating as a function of wavelength detuning for two different coherence lengths, showing an approximate linear relation.
function is approximately inversely proportional to the distance between the detuning
0
and the hand edge ~ E O G EFig, 5 illustrates this relation for two different values of the coherence length.
We have shown that the spectral response of apodized grat- ings is given by the convolution of the ideal deterministic spec- tral response with a finite linewidth function that accounts for the reduced coherence length of the fabrication system. This translates into a degradation of the spectral isolation of the filter.
B. Effects of Amplitude Noise
We study now the effect of amplitude-noise in the spectral re- sponse of apodized gratings. Let us consider again an OFG with a raised-cosine apodization profile, a total length of 1 cm and a maximum coupling constant q,"" of 3.5 cm-l. We assume that the grating is subjected only to an amplitude-noise character- ized by an r j of 3.9
.
cm. According to (7), this means that the standard deviation of the relative amplitude fluctuation is4.4% if we describe the grating by sampling sections of 200 fim
length. Fig. 6 shows the response of the deterministic grating
IHg(P)iz
and compares it with the ensemble average obtained by means of the amplitude-noise (AN) model developed in Sec- tion 111. The predictions of this model were again confirmed by statistically averaging the spectral response of 1000 grat- ings with amplitude-noise randomly generated (solid points in Fig. 6). We observe that the main effect of amplitude noise is a substantial increase of the flat background level of the spectral response.In a second numerical experiment we allowed the amplitude- noise factor r j to vary from 3.9
.
cm. The ensemble averages of the reflectivity for the cases considered is shown in Fig. 7. In analogy with the phase-noise case, the out-of-band background level increases for higher values of the amplitude-noise factor r j .to 8
.
Statintical AYerag
-0.5 -0.4 4 3 - 0 2 -0.1 0.0 0.1 0.2 0.3 0.4 0.5
Detuning (nm)
Fig. 6. Reflectivity spectrum of the apodized grating. - - -: Ideal deterministic grating. -: Ensemble average calculated with amplitude-noise AN model. e:
Values calculated by averaging over I000 random expen'ments.
0
-10
-20
. . . . . . .
z
P
8 4 0
z
2. -30
>
I
=
.-
6 0
-60
-70
-0.6 -0.4 -0.3 -02 -0.1 0.0 0.1 0.2 0.3 0.4 0.5
Detuning (nm)
Fig. 7. Ensemble average for the reflectivity spectrum of the apodized grating for variow values of amplitude-noise factor 7 .
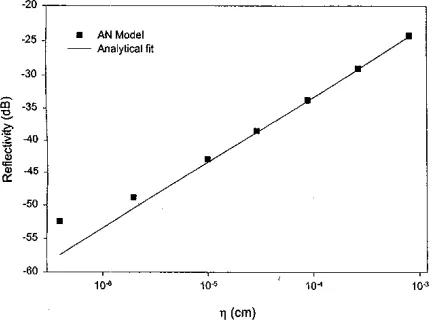
Finally, evaluation of the second term in (28) yields an analyt- ical expression for the excess out-of-band background reflection level, which for gratings with raised-cosine apodization profile is
. L
( R e x c o s s (,&-band)) Gz
1
dz l&(z,P)I2
II
=
4&x% (31) The background level scales with the square of the maximum coupling function q y . the length of the gratingL ,
and the noise factor r j . Fig. 8 compares the predictions of this analytical formula with the AN model, showing exact agreement for high values of r j , where the amplitude-noise dominates the out-of-band reflection.v.
EFFECTS OF RANDOM PHASE ERRORS ON CHIRPED GRATINGS [image:7.616.77.300.65.253.2] [image:7.616.326.541.95.253.2] [image:7.616.328.543.296.457.2]FECEO A N 0 ZERVAS: RANDOM PHASE A N 0 AMPLITUDE ERRORS IN OPTICAL FBG'S 97
1 5 , 40
l o * 104 10' 10"
'1 (cm)
Fig. 8. Ensemble average (W) for the aut-of-band reflectivity of the apodized grating at a detuning of 0.5 nm as a function of the amplitude-noise factor 7.
The solid line (-) is the theoretical tit (31).
to minimize the hit error rate. It has been established that the time-delay linearity improves in nonuniform apodized chirped gratings [251. In this section we are going to study the effect that a limited coherence length of the fabrication system has on the time-delay linearity of chirped gratings. We will show that the standard deviation of the time-delay fluctuations increases as the coherence length Lcoh is reduced.
As in the previous section, we illustrate the effects of random phase errors with a practical chirped grating. The grating, de- scribed in Fig. 9, has a total length of 15 cm and a raised co- sine apodization profile that extends over 2 cm at both ends of the grating. The maximum of the coupling function q yis 1.3 cm-' and its deterministic phase S(z) was linearly chirped with a cbirp-parameter n of 4.92 cm1112
0.0
0 2 il 6 8 10 12 14
[image:8.612.61.279.90.250.2]Length (em)
Fig. 9.
qo(z) for an apodized chirped grating.
Modulus and phase derivative of the deterministic coupling function
1.0
0.9
0.8 I
0.7
0.6 .
>
2
0.5a
0.4r
0.3
0.2
0.l
0.0
4.5 -0.4 4.3 d.2 4.1 0.0 0 . l 0.2 0.3 0.4 0 ~ 6
Detllning (nm)
Fig. 10. Reflectivity and time-delay response for the chirped grating represented in Fig. 9.
U%'
The deterministic spectral response of the grating is shown in Fig. 10. The in-band reflectivity was 90% and the time-delay exhibited good linearity. The grating was designed to compen- sate a 100-km fiber-link at a wavelength of 1.5 p n for an optical bandwidth of 0.6 nm.
Let us assume now that the grating is fabricated with a system of limited Coherence length. By using the random phase model previously developed, we have calculated the standard devia- tion of the time-delay ut&') for different coherence lengths
L,,1,
ranging from 10 to 1000 cm. The results predicted by the model are shown in Fig. 11 by thick solid lines and clearly demonstrate that the time-delay fluctuations increase as the co- herence length is reduced. We corroborated these results by sta- tistically averaging the time-delay responses of 50 gratings with randomly generated phase errors distributions (thin lines). The agreement is very good despite the approximations involved in the RP model calculations.It is also interesting to observe in Fig. 11 that the time-delay fluctuations grow for optical wavelengths that are preferentially reflected toward the end of the grating (negative detunings). As
" I
I
-03 0 2 - 0 , 0 0 0 1 0 2 0 3
Detuning (nm)
Fig. 11. Spectralevolution forthe standarddeviationof the time-delayoCd(?) for different coherence lengths Lrah. The thick lines arc the results predicted by the RP nrodel, while the thin lines arc statistical avermges of 50 mdOmly generated chirped gratings.
[image:8.612.301.530.290.440.2] [image:8.612.307.524.480.641.2]98 JOURNAL OF LIGHTWAVE TECHNOLOGY, VOL. t8, NO. I. IANUARY ZOW
0
0 200 100 800 800 lo00
Coherence Length (cm)
Fig. 12. Standard deviation for the time-delay vld at the center of the reflection band of the chirped grating as a function of the coherence length LFah. The chirp-parameter a was fixed to 4.92 cm
-'.
The solid line is a squaremot fit (L;,biz)
fluctuations of the time-delay. The approximation to the spectral response given by (1 3 ) and (14) considers that the forward prop- agating wave is that corresponding to the deterministic case, un- derestimating the penetration of the light into the grating when this is subjected to random phase errors.
A . Coherence Length and Chirp Parameter Dependence
We would like now to find how the coherence length of the fabrication system and the grating parameters relate to the time- delay fluctuations. We use again the RP model to understand these interrelations. Let us consider a small grating section of
lengthAlocatedatpointa.From(lO),(13j,and(14)weobserve
that this section will produce a strong reflection if the following phase-matching condition is verified:
lz+A
2
da+
( 4 ( z
+
A)
-<,(z))
~2pA
= 0. ( 3 3 )From
(32),
we can write (see Fig. 9)so that
( $ ( a
+
A )
-4 ( ~ ) )
=- a A
[
z
~(;
+
31.
(35)We observe that in absence of random phase errors the penetration depth for a detuning
p
is( L / 2
+
2p/a). The presence of random phase errors can help to achieve the phase matching condition at penetration depths that differ from0
4
-0 2 I 6 8
Chirp Parametera (cm')
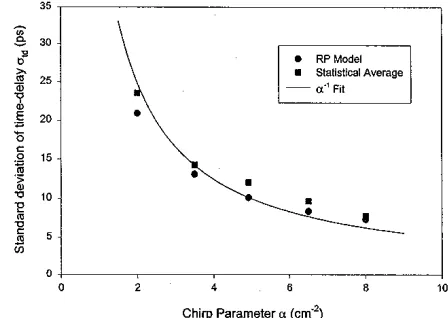
Fig. 13. Standard deviation for the time-delay v L d at the center of the
reflection band of the chirped grating versus the chirp parameter U . The coherence length Lsah was kept constant to 100 cm. The solid line is the fit.
that corresponding to the deterministic case, reducing the probability of phase-matching at this deterministic penetration depth. This is the reason why the fluctuations of the time-delay increase with random phase errors. The phase increments
(4(z
+
A)
-4 ( z ) )
follow Gaussian statistics with variancea'
given by (4). Assuming that the penetration depth z in (35) is a random variable and taking into account (4), we can express the variance of the penetration depth
02
in terms of the coherence length Lco,l. The time-delay variance ~2~ can then be obtained from U," by multiplying it with ( 2 ~ 1 , , / c ) ~where the symbol
cx
denotes proportionality. Equation (36) in- dicates that the standard deviation of the time-delay u t d scalesinversely proportional to the chirpparameter a and also to the square root of the coherence length
L,,,,
In order to corroborate these approximate predictions, we have represented in Fig. 12 the standard deviation of the time-delay u t d at the center of the reflection band as a function of the coherence length Lcoh. The chirp-parameter cy was
[image:9.613.48.548.55.254.2] [image:9.613.327.551.89.248.2]FECEO AND ZERVAS: RANDOM PHASE AND AMPLITUDE ERRORS IN OPnCAL FBG'S
~
99
4.3 -0 2 0.0 0.1 0.2
Deturiing (nm)
(b)
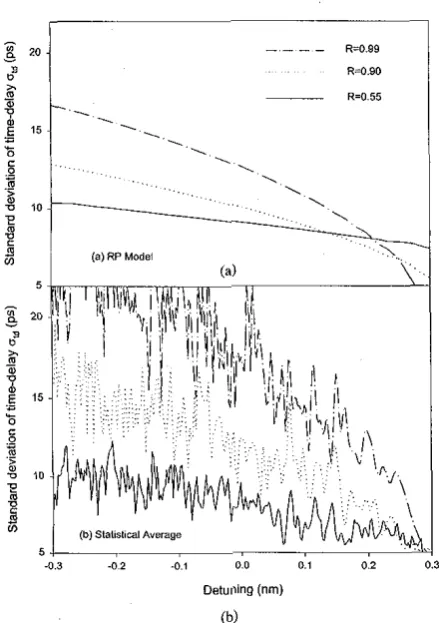
Fig. 14. Standard deviation of the time-delay fluctuations vtd(B) for three different coupling strzngths 4,""": 0.8, 1.3, and 1.9 cm-I. (a) was calculated with the RP model, while (b) shows the average over 50 randomly generated chirped gratings.
B. Coupling Strength Dependence
Finally, we are interested in determining the influence of the grating coupling strength on the time-delay fluctuations. We initially considered three cases with maximum coupling func- tion 4,"- equal to 0.8, 1.3, and 1.9 cm-', that corresponded to in-band reflectivities of 50,90, and 99%. The coherence length of the grating was kept constant at a value of 100 cm. In Fig. 14, we show the standard deviation of the time-delay fluctuations calculated both with the RP model in part (a), and averaging over 50 randomly generated gratings in part (b). We observe good qualitative agreement between both calculations, although the Rp model tends to underestimate the standard deviation of the time-delay. The fluctuations of the time-delay clearly increase as the grating coupling strength is higher. Also, the slope for the growth of the fluctuations along the band is larger in this case.
The reason for this behavior can be explained by the fact that strong gratings relax the phase-matching condition in
(33)
due to their broad bandgapCoupling constant (cm-')
Fig. 15. Standard deviation of the time-delay flucolations c t d at the center
of the reflection band for several coupling strengths 4,""". Points (.) were calculated with the RP model; (H) were calculated averaging over 50 randomly generated chirped gratings: the dashed line (-
-
-) is a linear fit. The coherence length L,,,, was kept constant to 100 cm and the chirpparameter a was 4.92"2.
Consequently, light of a particular wavelength (or detuning
/3) can interact efficiently with a larger section of the grating if the coupling strength is high. The size of this region is approximately equal to 4 q y / a , increasing linearly with the coupling strength. However, in an ideal noiseless grating the light does not penetrate deep into this region, and
is
mainly reflected from an initial section of length l / q y . If the grating is subjected to random phase errors, the light will be allowed to penetrate further into this region of strong interaction and the uncertainty of the reflection point will also be higher. This translates into larger fluctuations of the time-delay, which scale linearly with the size of the interac- tion region and, consequently, with Fig. 15 shows the linear relationship between q y and the standard deviation of the time-delay utd (at the center of the reflection hand) for a constant coherence length of 100 cm. The points in this figure were calculated both with the random phase model (Rp) and by statistically averaging the time-delay responses of 50 gratings with randomly generated phase error distr- butions. The dashed line is a linear fit. For low values of the coupling constant q,"=, the time-delay fluctuation tends to a constant minimum value. Both curves evolve asymp- totically toward a linear dependence of u t d with respect to qy" at high values of the coupling constant. The RP model provides a good approximation for moderate values of (less than2
cm-', that correspond to gratings of reflectivity inferior to 99%), underestimating the time-delay fluctuation at high values of the coupling constant.As
a summary, we have shown that random phase errors give rise to enhanced fluctuations in the time-delay of apodized chirped gratings, degrading their performance as dispersion compensators. We have demonstrated that the standard devia- tion of the time-delay ut,j scales inversely proportional to the chm-Darameter II a and also to the square root of the coherence length Lc,,h. Also, the fluctuations of the time-delay are more noticeable for gratings with high reflectivity, scaling linearly with the coupling constant of the grating. [image:10.617.59.279.82.394.2] [image:10.617.306.524.89.250.2]I00 JOURNAL OF LIGHTWAVE TECHNOLOGY, VOL. 18, NO. I , JANUARY 2000
VI. CONCLUSION
In this paper, we have studied the effects of random phase and amplitude errors in the performance of optical filters based on fiber Bragg gratings. The amount of random phase errors intro- duced in the grating during the writing process can be regarded a measure
of
the qualityof
the fabrication system. We have shown that this amount of random phase errors can be quan- tified through the concept of coherence length, which is applied for first time in this context.A
statistical model was developed to calculate the ensemble averages of the main grating spectral pa- rameters in terms of this coherence length. Two particular types of gratings of particular importance for optical communications were analyzed apodized gratings commonly used in WDM sys- tems, and chirped gratings employed to compensate the fiber dispersion.The main effects of random phase errors in apodized grat- ings were an increase in the out-of-band background reflectivity and a reduction in the sharpness of the bandedge as the coher- ence length is decreased. The background reflectivity scaled iu- versely proportional to the grating coherence length, and de- creased for detunings far away of the handgap edge. Ampli- tude errors also gave rise to an increase in the out-of-band back- ground reflectivity. In this case, however, the background level remained constant as a function of detuning. The method pre- sented permits the calculation of the minimum coherence length
L,,I,
and maximum amplitude noise factor 7 that can he allowed to achieve a required crosstalk level between different WDM channels.In the case of apodized chirped gratings, the random phase er- rors gave rise to enhanced fluctuations of the time-delay spectral response, degrading their performance as dispersion compen- sators. The standard deviation of the time-delay scaled inversely proportional to the chirpparameter and also to the square root of the coherence length. Also, the fluctuations of the time-delay were larger for gratings of higher reflectivity. Grating fabrica- tion systems with long coherence lengths are necessary to min- imize these negative effects.
REFERENCES
[ I ] B. Crosignani. P. Di Porto. and M. Benolotti, Statistical Properties o/
Scattered Light, New York: Academic, 1975.
[2] E. Brinkmeyer, "Analysis of the backscattering inethad for single-mode optical fibers," J. Opt. Soc. Amer:, vol. 70, no. 8, pp. 101l&1012, Aug.
1980.
[3] A . Bas" and J. M. Ballantyne, "Random fluctuations in first-order wave- guide grating filters," Appl~ opt^, v d I X , no. 15, pp. 2575-2579, Aug.
1979.
I41 H. E. Rowe, propagation in one-dimensional random media," IEEE Trans. Microwave Theory Tech., vol. 19, pp. 73-79, Jan. 1971 [5] D. Marcuse, "Coupled power equations for backward waves." IEEE
Pans. Microwave Theory Tech., vol. 20, pp. 541-546, Aug. 1972. I61 I. McKenna and J. A. Morrison, "Moments and correlation functions of
solutions of a stochastic differential equation," J , Math. Phys., vol. 11, no. 8, pp. 2348-2360, Aug. 1970.
[7] R. Adar, C. H. Henry, M. A. Milbrodt. and R. C. Kistler, "Phase coherence of optical waveguides," J. Ligbrwave Technul., vol. 12, pp.
[XI C. Dragone, "Cross-talk caused by fabrication errors in a generalized Mach-Zehnder interferometer," Electron. Lett., vol. 33, no. 15, pp.
13261327, July 1997.
[91 G. Meltz, W. W. Morey, and W. H. Glen, "Pormatio? of Bragg gratings
in optical fibers by a transverse holographic method," Opt. Lett., vol. 14, no. 15, pp. 823-825, Aug. 1989.
603-606, ~ p r . 1994.
[IO] W. H. Loh, M. 1. Cole, M. N. Zervas, S. Barcelos, and R. 1. Laming, "Complex grating structures with uniform phase masks based om the
moving fiber-scanning technique," Opt. Lett., vol. 20, no. 20, pp.
1111 A. Asseh, H. Storoy, B. E. Sahlgren, S. Sandgren, and R. A. H. Stubbe, "A writing lechnique for long fiber Bragg gratings with complex re-
flectivity profiles,"J. Lightwnve Techno/., vol. 15, pp. 1419-1423, Aug. 1997.
[I21 F. Ouellette, "The effect of profile noise on the spectral response of fiber gratings," in B m g g Gratings, Photosensitiviry and Poling in Glass Fibers and waveguides: Applications and Fundamen-
tals.
[I31 K. 0. Hill, B. Malo, F. Bilodeau, D. C. Johnson, and J. Alben, "Bragg gratings fabricated in monomode photosensitive optical fiber by UV ex- posure through a phase mask," Appl. Phys. Lett., vol. 63, no. 10, pp. [ 141 D. Z. Anderson, V. Mizrahi, T. Erdogan, and A. E. White, "Production of in-fiber grvtings using a diffractive optical element," Electron. Lett.,
vol. 29, no. 6, pp. 5 6 6 5 6 8 , Mar. 1993.
1151 B. Malo, K. 0. Hill, F. Bilodeau, D. C. Johnson, and J. AlberLToint-by- point fabrication of micro-Bragg gratings in photosensitive fiber using single excimer pulse refractive index modification techniques," Elec-
tion. Lett.. vol. 29, no. 18, pp. 1668-1669, Sept. 1993.
1161 I . Manin and F. Ouellette, "Novel writing technique of long and highly reflective in~fibergratings,"Electro,,. Lett., vol. 30, no. 10, pp. 81 1-812, May 1994.
[I71 M. Ibsen, M. K. Durkin, M. J. Cole, and R. I. Lming, "Optimized
square passband fiber Bragg grating filter with in-band flat group delay response," Electron. Lett., vol. 34, no. 8, pp. 80&801, Apr. 1998. [I81 J. Skaar, B. Sahlgren. P. Y. Fonjallaz, H. Staroy, and R. Stubbe, "High-
reflectivity fiber~optic bandpass filter designed by use of the iterative solution to the Gel'fan-Levitan-Marchenka equations," Opt. Lett., vol. 23, no. 12, pp. 933-935, June 1998.
1191 A. Papoulis. Probabilig Random Variables and Stochaslic Processes,
3rd ed.
2051-2053, OCI. 1995.
Williamsburg, VA: BMG. Oct. 1997, vol. 13-1, pp. 222-224.
1035-1037, ~ a r . 1993.
New York McGraw-Hill. 1999.
[ZOI B. Oksendal, Stochastic Differ-entia Equations, 5th ed, New York: Springer, 1998, ch. 2.
[211 C. H. Henry, "Theory of the linewidth of semiconductor lasers," IEEE J. Quantum E l e c t r m , vol. 18, no. 2, pp. 259-264, Feb. 1982. 1221 H. Koeelnik and C. V. Shank. "Couded~wave theow of distributed feed-
~~
back ~sers,"J. Appl. Phyr., vol. 4 i , no. 5, pp. 2327-2335, May 1972.
[23l A. Yariv, "Caupled~mode theory for guided-wave optics," IEEE J.
Quantum Ebctrari.. vol. 9, pp. 919-933, Sept. 1973.
[24l T. Erdogan, "Fiber grating spectra," J. Lightwave Technoi., vol. 15, pp. 1277-1294, Aug. 1997.
[25] K. Ennser, M. N. Zewas, and R . I. Laming, "Optimization of apodized linearly chirped fiber gratings for optical communications," IEEE J. Quantum Electron., vol. 34, pp. 770-778, May 1998.
[26] H. Kogelnik, "Filter response of nonuniform almost-periodic SITUC-
tures,"BellSysr. Tech. J., vol. 5 5 , no. 1, pp. 109-126. Jan. 1976. [27] T. A . Strasser, P. I . Chandonnet, I . DeMarco, C. E. Soccolich, J. R. Pe-
drazzani, D. 1. DiGiavanni, M. J. Andrejca, and D. S. Shenk, "UV-in- duced fiber grating OADM devices for efficient bandwidth utilization," in Proc. Opt. Fiber Commun. (OFCJ C o n f , 1996, pp. PD8.1-PD8.5.
1281 F. Ouellette, "Dispersion cancellation using linearly chirped grating fil- ters in optical waveguides,"Opt. Lett., vol. 12, no. IO, pp. 847-849, Oct. 1987.
[29] M. 1. Cole.H. Geiger, R. I. Laming,S. Y. Set, M. N. Zervas, W. H . Loh, and V. Gusmerali, "Broadband dispersion-compensating chirped fiber Bragg gralings in a 10 Gbitls NRZ 110 km oondispersian-shifted fiber link operatingat 1.55 ,im,"Electron. Leti.,vol. 33, no. I,pp. 7&71, Jan.
1997.
Ricardo Feeed received the Telecommunications Engineering degree from Madrid Polytechnic University, Spain, in 1993 and the Ph.D. degree in elecrronic engineering from King's College London, U.K., in 1998.
FECED AND ZERVAS: RANDOM PHASE AND AMPLITUDE ERRORS IN OPTICAL FBGS
Mikhail N. Zervas was bom in Dimaina-Nafplias, Greece, in 1959. He received the Diploma degree in electrical engineering from Aristotle University of Thessaloniki, Greece, in 1983, the MSc. degree in applied and modem optics from the University of Reading, U.K., in 1985 (with distinction), and the Ph.D. degree in fiber optics from the University College London, U.K., in 1989.
During his postgraduate studies, he was awarded scholarships from the State Scholarships Foundation of Greece (1KW and the Bodassakis Foundation. , ,
Athens, Greece. In 1990, he was appointed Lecturer in the Faculty of Electrical Engineering, University of Thessaloniki. In 1991, he joined the Optoelectronics Research Center, University of Southampton as a Research Fellow. In 1995, he was promoted full Professor at the Optoelectronics Research Center, and Elec-
tronics and Computer Science Depanment of the University of Southampton. His main research interests are in the areas of erbium-doped fiber amplifiers, dispersion compensation, fiber gratings, sulface-plasmon-polarit~"~ and distributed feedback fiber lasers. He is the author and coauthor of more than
100 technical publications and ten patents. He has served as a member of progwm committees of various intemational conferences.