Abstract—Software effort and cost estimation are
necessary for the software project manager to be able to successfully plan for the software project. At present, the number of the mobile applications, such as smartphones and tablets, is increasing. The planning and development environment of such mobile applications is different from the traditional information system development. It is asserted that traditional effort estimation models may not be appropriate for the mobile application development project. Therefore new approaches specially designed to fit for mobile application effort estimation in the new environment have been suggested [1], [2].
This research empirically validated and compared the accuracy between a traditional effort estimation model i.e. Function Points Analysis method and a proposed method especially design for mobile application effort estimation, in order to find out which software effort estimation model is more appropriate for mobile development environment. The findings of this study show high percentage errors in term of MRE percentages and very low on the measure of prediction level or PRED (p) for both estimation models. The statistical test also indicates that there is no statistical different for the accuracy of both models.
Index Terms—Mobile application effort estimation accuracy, effort estimation accuracy, mobile application effort estimation, mobile effort estimation validation, effort estimation model validation.
I. INTRODUCTION
oftware effort and cost estimation are necessary for the software project manager to be able to successfully plan for the software project. Researchers and practitioners have long been searching for more accurate software effort estimation models. At present, the number of the mobile applications, such as smartphones and tablets, is increasing. The planning and development environment of such mobile applications is different from the traditional information system development. It is asserted that traditional estimation model may not be appropriate for the mobile application development project. New approaches specially designed to fit for mobile application effort estimation in the new environment have been suggested [1], [2].
T. Arnuphaptrairong is with the Department of Statistics, Chulalongkorn Business School, Chulalongkorn University, Bangkok 10250 Thailand (e-mail: [email protected]).
W. Suksawasd was a graduate student at the Department of Statistics, Chulalongkorn Business School, Chulalongkorn University, Bangkok 10250 Thailand (e-mail: [email protected]).
The objective of this research is to empirically validate and compare the accuracy between a traditional effort estimation model i.e. Function Points Analysis method and a proposed method especially design for mobile application effort estimation to find out which software effort estimation model is more accurate.
This article is organized as follows. Section II gives the background and reviews the related software effort estimation models. Section III describes the research methodology. Section IV discusses the findings and concludes for the research.
II. BACKGROUND AND RELATED LITERATURE
This section discusses the background and reviews the software effort and cost estimation methods related to our proposed study i.e., Function Points Analysis, the mobile application estimation model proposed by an independent developer –Sakhrelia [3] and accuracy evaluation criteria.
A. Background
Applying Function Points Analysis for mobile application development was discussed in a few studies. Work of de Preuss [4], Abdullah [2] and Souza and de Aquino [1] are for example.
Preuss [4] demonstrated in detail how Function Points Analysis can be used for mobile applications effort estimation.
Abdullah [2] reviewed a number of studies in estimating software effort for mobile application development based on Function Point Analysis method. This includes the work of de Souza and de Aquino [1], Tunali [5], Nitze [6], and Abdullah [7].
de Souza and de Aquino [1] proposed to apply the FiSMA method while Tunali [5] proposed to use IFPUG base functional components (BFC) and Nitze [6] and Abdullah et al. [7] proposed to apply COSMIC Function Points for mobile application effort estimation.
Besides the Function Points approach, review of the literature shows another approach to use the pieces that input into the software or deliver from the software as the driver of the size of the software. In other words, the more the artifacts such as screens, or features delivered, the more the LOC and hence the development effort.
Tharwon Arnuphaptrairong and Wachira Suksawasd
An Empirical Validation of Mobile Application
Effort Estimation Models
Work of Sakhrelia [3], Anastasiia [8], and the web pages ―Estimate My App‖ maintain by Oozou [9] are for example.
Sakhrelia [3] proposed to estimate effort based on the number of screens of the mobile applications. Anastasiia [8] suggested to use user stories or features –functional pieces that bring value to the user as driver of driver of the mobile application development effort estimation. In order to estimate the cost of the mobile application, the web pages ―Estimate My App‖ maintain by Oozou [9] suggest to ask 10 questions, including: 1. How big is your app? 2. What level of UI would you like? 3. Users & accounts, 4.User generated contents, 5. Dates and locations, 6. Social & engagement, 7. Billing& e-Commerce, 8. Admin, feedback & analytics, 9. External APIs and Integrations, 10. Security. The cost of the application will be derived from the answers to these 10 questions.
The method proposed by Sakhrelia [3] was selected for the studyto compare with Function Points Analysis model. The reasons are that the proposed model is a simple and straight forward and the other two models do not provide details on how to derive the effort or cost of the mobile application from the suggested models.
B. Function Points Analysis
Function Points were introduced by Albrecht [10] in 1979. It is widely accepted with a lot of variants, from both academic and practitioner [11]. The research in this area is also known as Function Points Analysis (FPA) or Function Size Measurement (FSM). The concept is based on the idea that the functionality of the software delivered is the driver of the size of the software (LOC) and hence the development effort. In other words, the more the functions delivered, the more the LOC and the development effort. The functionality size is measured in terms of Function Points (FP).
[image:2.595.317.547.399.538.2]FPA presumes that a software program comprises of functions or processes. Each function or process consists of five unique components or function types as shown in Figure 1. The five function types are Internal Interface File (ILF), and External Interface File (EIF), External Input (EI), External Output (EO), External Query (EQ).
Fig. 1. The Albrecht five function types
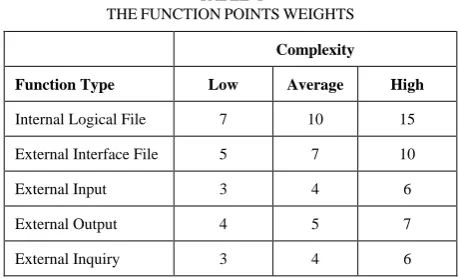
Each of these five function types is individually assessed for its complexity and given a Function Points weight which varies from 3 (for simple external inputs) to 15 (for complex internal files) as shown in Table I.
The low, average and high complexity level of ILF and EIF are based on the number of Record Element Type (RET) and Data Element Type (DET). A Record Element Type (RET) is a subgroup of the data element (record) of an ILF or ELF. A data element type is a unique non-repeated data field. Whereas the complexity level of EI and EO and EQ are based on the number of File Type Referenced (FTR) and Data Element Type (DET). A File Type Referenced (FTR) is an ILF or EIF.
The Unadjusted Function Points (UFP) or Unadjusted Function Points Counts (UFC) is calculated as follows:
UFP =
5
1 i
3
1 j
ij ij
W
N
(1)Where Nij is the number of the function type occurrences (i)
and Wij is the corresponding complexity Function Points
weighting value j of the 3 complexity levels –low, average and high and of each function type i.
TABLE I
THEFUNCTIONPOINTSWEIGHTS
Complexity
Function Type Low Average High
Internal Logical File 7 10 15 External Interface File 5 7 10 External Input 3 4 6 External Output 4 5 7 External Inquiry 3 4 6
In some cases, the Unadjusted Function Points (UFP) may need to be adjusted with the software development environment factors. There are 14 technical complexity factors (TCF) which can be obtained by the following formula:
[image:2.595.55.275.611.756.2]
The adjusted Function Points (FP) is then obtained as follows:
FP = UFP x TCF (3)
C. The mobile application effort estimation model proposed by an independent developer -- Sakhrelia [3]
In general, software companies have their own method of effort estimation and keep it as a secret. Literature survey shows that there are a few specific method proposed for mobile application effort estimation. Work of Sakhrelia [3], Anastasiia [8], and the web pages ―Estimate My App‖ maintain by Oozou [9] are for example.
Sakhrelia [3], in 2011, proposed to estimate effort based on the number of screens. The screen are categorized into 3 types –normal, average and complex. The effort for each type of the screen is assigned 4, 8, or 16 man-hours accordingly, as shown in Table II.
TABLE II
SCREEN COMPLEXITY AND EFFORT WIEGHTING
Complexity Descriptions and examples
Effort (Man Hour )
Normal Splash, Login, Forget password, Homepage, About us, Rss feed, Twitter feed, Youtube video feed, Dashboard, Custom tab menu and likewise etc.
4
Average If any of the above need the server API call or other advance changes.
8 Complex Custom Table view, Camera implementation,
Audio/video recording, Third party API, Custom API call etc.., and other R&D base stuff
16
D. Accuracy Evaluation Criteria
Commonly used measures of the accuracy of the cost estimation model found in the literature are the Magnitude of Relative Error (MRE) or the Mean Magnitude of Relative Error (MMRE) [12], [13] and the measure of prediction level or PRED (p) [14]. The Magnitude of Relative Error (MRE) and the Mean Magnitude of Relative Error (MMRE) are defined as:
(4) Where is the actual value and is the estimate
(5)
Where n is the number of estimates; and is the Magnitude of Relative Error (MRE) of the ithestimate.
Besides Mean Magnitude of Relative Error (MRE), another accuracy measure is the measure of prediction level or PRED (p) which can be defined as follows [13], [14].
PRED (p) = k/n (6) Where n is the total number of estimates, k is the number of estimates that have the accuracy less than or equal the value p.
For example, PRED (0.25) = 0.50 means that half of the estimates have the accuracy within 0.25 or 25 percent. The level of usually accepted is PRED (0.25) = 0.75 or meaning the model should be within 25 percent accuracy for 75 percent of the estimates[13], [14].
III. THE RESEARCH METHODOLOGY
Software companies were solicited in order to obtain information needed to answer the research question. Two forms were used to record the information needed.
The first form contained question for general information about the company and the mobile applications. These are: application name, description, owner, date, number of functions (feature), number of screens, actual efforts in man-hour, data file names in use, type (internal data file /external data file), number of data fields, and number of subgroups.
The other form included the 14 technical complexity factors: data communications, performance, heavily used configuration, transaction rate, online data entry, end user efficiency, online update, complex processing, reusability, installation ease, operations ease, multiple sites, facilitate change, distributed functions. The respondents were asked to rate each technical complexity factor on the basis of its degree of influence from no influence (0) to very influential (5).
IV.FINDINGS
Two solicited software companies and 5 freelancer agreed to participate in the study. 17 mobile applications were collected from these software companies and freelancers.
The Unadjusted Function Points (UFP) were derived from the information gathered --functions (feature), number of screens, data file names in use, type (internal data file /external data file), number of data fields, and number of subgroups. The 14 technical factors were then multiplied to obtain the adjusted Function Points for each mobile application. In order to obtain the development effort, the productivity rate of 2.2 man-hour per Function Point was then used as suggested in the literature [15], [16].
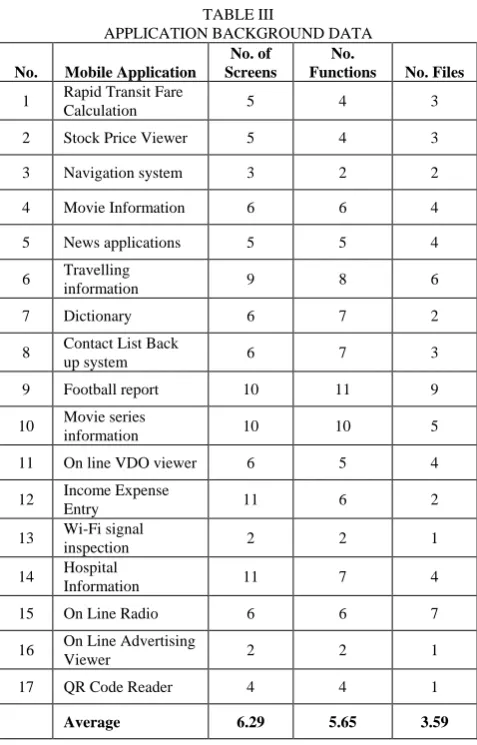
This resulted in only 17 usable project data sets as shown in Table III. Table III shows the detail profile of the 17 applications –the application name, the number of screens, the number of functions, and the number of files of the application.
Table III shows that, of the 17 mobile applications, the number of screens ranges from 2 to 11 screens with the average of 6.29 screens, the number of functions ranges from 2 to 11 functions with the average of 5.65 functions, and the number of files ranges from 1 to 9 files with the average of 3.59 files.
Table IV shows that the estimated effort for 17 mobile applications using Function Points Analysis model ranges from 16.94 man-hour to 222.20 man-hour with the average of 92.04 man-hour while the Magnitude of Relative Error (MRE) of Function Points Analysis model ranges from 19.4% to 239.2% with the Mean Magnitude of Relative Error (MMRE) of 67.15%. The PRED (0.25) of the Function Points Analysis model is 11.77 %
Table V shows that, for the Sakhrelia’s model, the estimated effort ranges from 28 man-hour to 260 man-hour with the average of 111.53 man-hour while the Magnitude of Relative Error (MRE) of Function Points Analysis model ranges from 0% to 309.09% with the Mean Magnitude of Relative Error (MMRE) of 61.99%. The PRED (0.25) of the Sakhrelia’s model is 17.64%.
This indicates that both Function Points Analysis and the model of Sakhrelia do not perform very well both on MMRE and PRED (p).
The statistical test was also performed. Since both set of data are not normally distributed, Mann-Whitney U test were performed to test if the mean of the two populations are equal. The p-value is 0.418 which indicates that there is no statistical different for both set of data.
IV. DISCUSSION AND CONCLUSIONS
The findings of this study show high percentage error in term of MRE percentages and very low on the measure of prediction level or PRED (p). The statistical test also indicates that there is no statistical different for both estimation model. This implies that the performance of both models – Function Points analysis method and the model proposed by Sakhrelia, are not different for mobile application development estimation. The performance accuracy level is also not at the acceptable level.
[image:4.595.305.557.197.590.2]The disappointed results are surprising. The high percentage errors in term of MRE percentages and very low on the measure of prediction level or PRED (p) are comparable to the work of [12], [15].
TABLE III
APPLICATION BACKGROUND DATA
No. Mobile Application
No. of Screens
No.
Functions No. Files
1 Rapid Transit Fare
Calculation 5 4 3 2 Stock Price Viewer 5 4 3 3 Navigation system 3 2 2 4 Movie Information 6 6 4 5 News applications 5 5 4 6 Travelling
information 9 8 6 7 Dictionary 6 7 2 8 Contact List Back
up system 6 7 3 9 Football report 10 11 9 10 Movie series
information 10 10 5 11 On line VDO viewer 6 5 4 12 Income Expense
Entry 11 6 2 13 Wi-Fi signal
inspection 2 2 1 14 Hospital
Information 11 7 4 15 On Line Radio 6 6 7 16 On Line Advertising
Viewer 2 2 1 17 QR Code Reader 4 4 1
Average 6.29 5.65 3.59
TABLE IV
FUNCTION POINTS ANALYSIS: ESTIMATED EFFORT AND MRE
No. Application
Estimated FP effort
(Man-hour)
Actual Effort (Man hours)
MRE (%)
1
Rapid Transit Fare
Calculation 76.56 192.00 60.13 2 Stock Price Viewer 72.73 272.00 73.26 3 Navigation System 33.88 288.00 88.24 4 Movie Information 93.46 116.00 19.43 5 News Applications 129.89 372.00 65.08 6
Travelling
Information 193.73 504.00 61.56 7 Dictionary 61.68 28.00 120.29 8
Contact List Back
Up System 64.31 176.00 63.46 9 Football Report 222.20 364.00 38.96 10
Movie Series
Information 144.94 120.00 20.78 11 Online VDO Viewer 74.62 22.00 239.18 12
Income Expense
Entry 86.72 224.00 61.29 13
Wi-Fi Signal
Inspection 16.94 24.00 29.42 14
Hospital
Information 106.50 200.00 46.75 15 On Line Radio 105.60 160.00 34.00 16
On Line Advertising
Viewer 18.70 120.00 84.42 17 QR Code Reader 62.08 96.00 35.33
Min 16.94 22.00 19.4
Max 222.20 504.00 239.2
Mean 92.04 192.00 67.15
[image:4.595.47.286.213.586.2]We hypothesized that the disappointed results may be attributed to the productivity rates used for Function Points Analysis method as discussed in [15] and the productivity rates of, 4, 6 or 8 man-hour per screen are too rigid. The appropriate productivity rates should help increasing the accuracy of the models. This imply that the software companies or the freelance developers should maintain and calibrate their own software project data and productivity [15, 17, 18] to attain appropriate productivity rates for the success in mobile application effort estimation.
REFERENCES
[1] L.S. de Souza and G.S. de Aquino Jr., ―Estimating the Effort of Mobile Application Development,‖ in Proceeding of Second International Conference on Computational Science and Engineering,
pp.45-63, 2014.
[2] N.A.S. Abdullah and N.I.A. Rusli, ―Review on Functional Size Measurement in Mobile Application and UML Model,‖ in Proceeding of the 5th International Conference on Computing and Informatics,
ICOCI 2015, pp. 353-358, 2015.
[3] N. Sakhrelia, (2013, August 28). ―How to estimate mobile app project effort?‖ Available: http://developer.appcelerator.com/question /128655/how-to-estimate-mobile-app-project-effort
[4] T. Preuss, ―Mobile Applications, Function Points and Cost Estimating,‖ in International Cost Estimation & Analysis Association Conference, 2013. Available:
http://www.iceaaonline.com/ready/wp- content/uploads/2014/06/IT-6-Presentation-Mobile-Applications-Functional-Analysis-and-Cost-Estimation.pdf
[5] V. Tunali, ―Software Size Estimation Using Function Point Analysis – A Case Study for a mobile Application,‖ in Symposium of
Muhendislik ve Technology, pp. 73-76, 2014.
[6] A. Nitze, ―Measuring Mobile Application Using COSMICS FP,‖ in
Proceeding of DASMA Metrik Kongress Conference, 2013.
[7] N.A.S. Abdullah, N.I.A. Rusli, and M.F. Ibrahim, ―A Case Study in COSMIC Functional Size Measurement: Angry Birds Mobile Application,‖ in Proceeding of the IEEE Conference on Open
Systems, pp. 139-144, 2013.
[8] Anastasiia, (2015, October 12) ―How to Estimate Mobile Projects 1. A Step by Step Guide‖) Available: https://stanfy.com/blog/how-to-estimate-mobile-projects-a-step-by-step-guide/
[9] Oozou (2016), ―Estimate My App‖ Available: https://estimatemyapp.com/
[10] A. J. Albrecht, ―Measuring application development productivity,‖ in Proceeding of the IBM Applications Development Symposium, California, October 14-17, 1979, pp. 83-92.
[11] C. Gencel and O. Demirors, ―Functional size measurement revisited,‖ ACM Transaction on Software Engineering and methodology, vol.17, no. 3, pp.15.1-15.36, June 2008.
[12] C.F. Kremer, ―An Empirical Validation of Software Cost Estimation Models,‖ Communication of the ACM, vol. 30, no. 3, pp.416-429, 1987.
[13] S. Basha and P. Dhavachelvan, ―Analysis of Empirical Software Effort Estimation,‖ International Journal of Computer Science and Information Security, Vol 7, no.3, pp. 68-77, 2010.
[14] S. Conte, H. Dunsmore, and V. Shen, ―Software Engineering Metrics and Models,‖ Menlo Park, Benjamin/Cummings, 1986.
[15] T. Arnuphaptrairong, ―Early Stage Software Effort Estimation Using Function Point Analysis: An Empirical Validation,‖ International Journal of Design, Analysis and Tools for Integrated Circuits and Systems, Vol. 4, no. 1, pp.15-21.December 2013.
[16] R. Jeffery, M. Ruhe, and L. Wieczorek, ―Using Public Domain Metric to Estimate Software Development Effort,‖ in Proceeding of international Software Metric Symposium (Metric’01), pp.16-27, 2001.
[17] M. Aguiar, COCOMO II Local Calibration Using Function Points, TI Metricas, Available: http://csse.usc.edu/events/2005/COCOMO/ presentations/CIILocalCalibrationPaper.pdf
[image:5.595.40.289.197.614.2][18] B. Clark, S. Davnani-Chulani, and B. Boehm, ―Calibrating the COCOMO II Post-Architecture Model,‖ in Proceeding of ICSE’ 98 Proceeding of the 20th International Conference of Software Engineering, 1998, pp.477-480.
TABLE IV
SAKHRELIA’S MODEL: ESTIMATED EFFORT AND MRE
No. Application
Estimated effort (Man-hour)
Actual Effort (Man hours)
MRE
(%)
1
Rapid Transit Fare
Calculation 88.00 192.00 54.17 2 Stock Price Viewer 84.00 272.00 69.12 3 Navigation System 40.00 288.00 86.11 4 Movie Information 92.00 116.00 20.69 5 News Applications 136.00 372.00 63.44 6
Travelling
Information 188.00 504.00 62.70 7 Dictionary 28.00 28.00 0.00 8
Contact List Back
Up System 76.00 176.00 56.82 9 Football Report 248.00 364.00 31.87 10
Movie Series
Information 212.00 120.00 76.67 11 Online VDO Viewer 90.00 22.00 309.09 12
Income Expense
Entry 116.00 224.00 48.21 13
Wi-Fi Signal
Inspection 28.00 24.00 16.67 14
Hospital
Information 260.00 200.00 30.00 15 On Line Radio 116.00 160.00 27.50 16
On Line Advertising
Viewer 44.00 120.00 63.33 17 QR Code Reader 60.00 96.00 37.50
Min 28.00 22.00 0.000
Max 260.00 504.00 309.09
Mean 111.53 192.00 61.99