Abstract—The influence and impact of journals in the scientific community is a fundamental question for researchers worldwide because it measures the importance and quality of a publication. This study analyses all the journals that are currently ranked in any educational research category in Web of Science by using bibliometric indicators. The aim is to provide a general overview of their impact and influence between 1989 and 2013. The journals are divided in seven research categories that represent the whole field of educational research. The analysis also develops a general comparison between all the categories. The results show that many interdisciplinary journals obtain a broader impact than the core journals although these publications are also well positioned in the field.
Index Terms— Bibliometrics, journal analysis, educational research, Web of Science.
I. INTRODUCTION
In the fifties, Eugene Garfield [5] described the idea of a citation index for the sciences. Working with Irv Sher, he designed the impact factor calculation to analyze and identify influential journals [7]. Thus, in 1963, the first Science Citation Index appeared, for 1961. In 1976, Garfield published the first Journal Citation Reports (JCR) as part of the Science Citation Index [6]. This work presented the impact factors for 1975 as well as many other measures of journal use. By compiling articles' cited references, JCR helps to measure research influence and impact at the journal and category levels, and shows the relationship between citing and cited journals.
Bibliometric studies use the bibliographic material to provide a general overview of a research field by analysing the data quantitatively [2]. Although there are many authors that have studied educational research with bibliometric indicators [3-4,9], none of the studies have presented a general overview of the current status of the main leading journals in the field. Some of them have used education journals for the bibliometric analysis but not as a general overview [1,10]. Therefore, the aim of this paper is to analyze the educational research journals indexed in the Web of Science database and see their publication and citation structure over the last twenty-five years. The main advantage of this approach is that it takes into account a long period of time and deals with a wide range of bibliometric indicators that show different characteristics of the journals. Therefore,
Manuscript received March 23, 2016. This paper is supported by the Chilean National Science Foundation through the FONDECYT program.
G. Zurita, J.M. Merigó, and V. Lobos-Ossandón are with the Department of Management Control and Information Systems, School of Economics and Business, University of Chile, Av. Diagonal 257, 8330015 Santiago, Chile (corresponding author: +56-2-29772164; e-mail: [email protected]).
the information provided is more complete because sporadic changes do not affect the analysis so much. Thus, the key contribution of this paper is to provide a general overview of the current state of all the educational research journals indexed in WoS. The journals are classified in seven general categories of education. The study ends with a general comparison of all the categories that takes into account their evolution between 1989 and 2013.
This rest of the paper is structured as follows. Section II briefly analyses the bibliometric methodology of the paper. Section III presents the results and Section IV the main conclusions of the paper.
II. BIBLIOMETRIC METHODS
This paper studies the information by using the Web of Science (WoS). The site belongs to Thomson and Reuters that acquired it from the Institute for Scientific Information (ISI). The search of information was carried out with the names of the publications contained in the database. These journals were obtained by filtering the WoS that includes four categories in educational research and 326 journals: Education, Psychology Education, Scientific Education and Education Special. However, the analysis divided educational research in seven fields in order to give a more specific classification of educational research: Education Studies, Education and Scientific Disciplines, Education and Technology, Psychology & Education, Education Special, Professional Development of Teachers and Curriculum Studies and Social Sciences Disciplines and Education. Note that in some particular cases, some journals were classified in an area different from the WoS category since their scope could be seen from different perspectives.
The journals are ranked by the total citations (TC). The main reason is that TC reflects the influence of a publication. TC is an indicator that shows how many times the article has been cited by papers published in WoS [11]. Total Papers (TP) was used in order to show the number of articles published in WoS and it reflects the productivity of a certain journal. Another indicator used was the average citation per item (TC/TP) and the h-index [8] which reflects the number of papers X that has received at least X citations [12]. This idea can be expressed with the following formulation: {H = X ⇔
TCX ≥ PX} where PX is the Xth paper of the set of articles ordered in a descending way according to the number of citations and TCX is the number of citations of the Xth paper. For the journal analysis it was also used the Impact Factor (IF) [6-7]. Impact Factor is one of the most popular tools for judging the impact and importance of a journal [13]. It measures the influence of a specific journal according to the following procedure. First, it chooses the publications of the
A Bibliometric Analysis of Journals in
Educational Research
last year, in this paper 2013. Next, it goes back two years and takes the sum of citations obtained for the journal. This number is divided by the sum of the publications made in the past two years. In this way, the Impact Factor shows the average numbers of citations obtained by a journal in the last two years. Although, it has some criticisms because it only takes two years to compare the citations and often this may be an excessively short period. Because of that, the analysis also considers the Five Year Impact Factor (IF5) that has the same procedure as the Impact Factor, but considering the last five years of citations. Finally, note that the investigation considers a time space of 25 years (1989 – 2013) and the information was collected in October 2014.
III. RESULTS
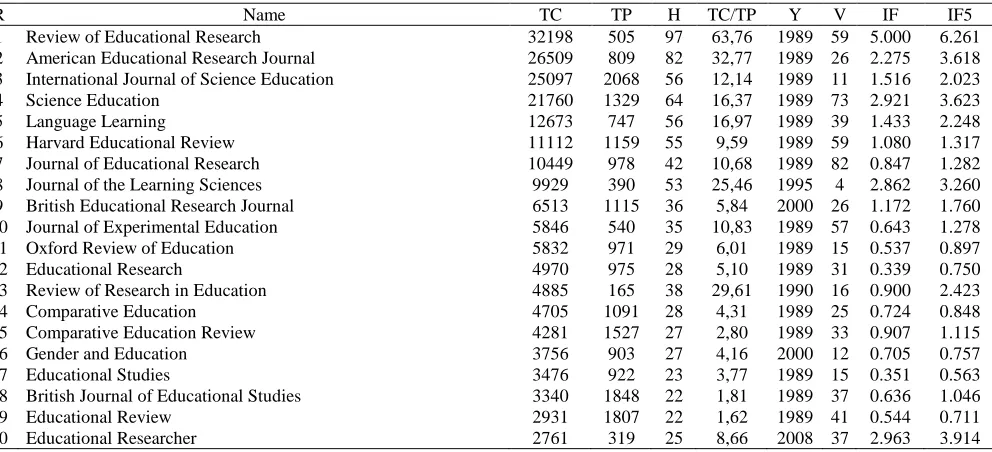
In this section, let us present the results of the study. The following tables contain all the indicators described in the previous section and are separated by the seven categories. Observe that only the top 20 journals in each category are presented. First, let us look into the Education Studies category which is at the core of the educational research discipline. Table 1 presents a ranking of the journals in this category ordered according to the total number of citations.
Next, let us present the Professional Development and Curriculum Studies of Teachers category. Note that this category could be divided in two groups. The reason for including the Professional Development and Curriculum Studies of Teachers together is that many journals are publishing papers that could be classified in both groups. Therefore, it is better to group all of them together to avoid omissions in one of the categories. Table 2 presents the results.
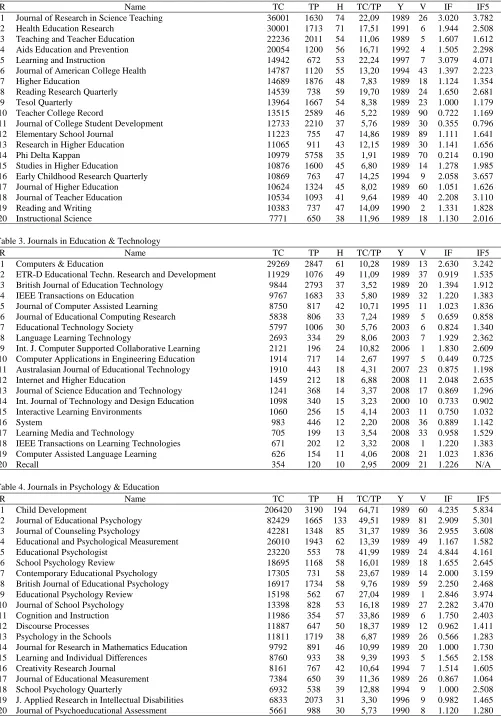
The category of Education and Technology is still small although it is growing a lot due to the fact that technology has become in the last years a powerful tool for improving and adding new educational techniques. The results of this category are shown in Table 3.
The category of Psychology and Education is the biggest one of all. The main reason for this is that it includes journals
from education and psychology, which are very broad subjects. Table 4 presents the journal rankings.
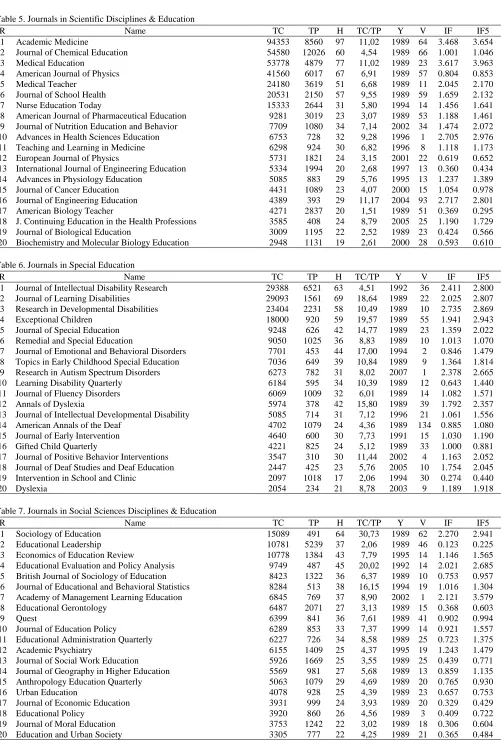
Next, let us present the category of Scientific Disciplines and Education. This category includes journals that integrate two big areas: scientific disciplines and education. This produces an overlap between citations because it collects cites from many topics. Table 5 shows the results.
Special Education is a category that includes all the journals related to research regarding learning differences and disabilities. The results are shown in Table 6.
Social Sciences Disciplines and Education it is also a category that includes journals from different fields. Among others it is worth noting history, anthropology, sociology and economics. The results of this category are presented in Table 7.
Each educational category shows a different profile regarding the publication and citation structure. In order to see the differences between them, let us compare each category from a global perspective. Table 8 presents several bibliometric indicators for each category.
As we can see, the most cited category is Psychology & Education. Indeed this reaffirms the individual results found in this category where the interdisciplinary nature brings a higher degree of citations than in other areas. The huge differences between this category and the rest can be seen in the TC/TP ratio where the value of Psychology & Education is two to four times higher than the rest of categories. This occurs because this category aligns with Psychology which is a research field with a higher citation rate than the common social sciences. The rest of the categories obtain results in accordance to their size.
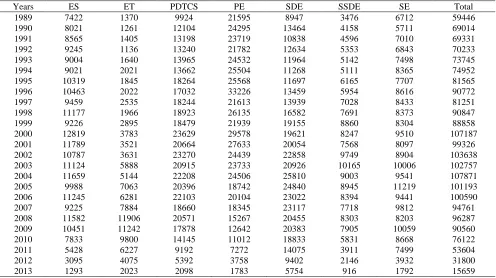
Next, let us classify the citation evolution of each category by years. Table 9 presents the number of annual citations received in each category.
[image:2.595.54.550.554.780.2]Psychology & Education is the field with the highest number of citations although during the last decade, Professional Development of Teachers and Curriculum Studies and Education and Scientific Disciplines are receiving more citations. The citation level of the last five years is still very low because these papers still need more time to consolidate their citation structure.
Table 1. Journals in Education Studies
R Name TC TP H TC/TP Y V IF IF5
1 Review of Educational Research 32198 505 97 63,76 1989 59 5.000 6.261
2 American Educational Research Journal 26509 809 82 32,77 1989 26 2.275 3.618
3 International Journal of Science Education 25097 2068 56 12,14 1989 11 1.516 2.023
4 Science Education 21760 1329 64 16,37 1989 73 2.921 3.623
5 Language Learning 12673 747 56 16,97 1989 39 1.433 2.248
6 Harvard Educational Review 11112 1159 55 9,59 1989 59 1.080 1.317
7 Journal of Educational Research 10449 978 42 10,68 1989 82 0.847 1.282
8 Journal of the Learning Sciences 9929 390 53 25,46 1995 4 2.862 3.260
9 British Educational Research Journal 6513 1115 36 5,84 2000 26 1.172 1.760
10 Journal of Experimental Education 5846 540 35 10,83 1989 57 0.643 1.278
11 Oxford Review of Education 5832 971 29 6,01 1989 15 0.537 0.897
12 Educational Research 4970 975 28 5,10 1989 31 0.339 0.750
13 Review of Research in Education 4885 165 38 29,61 1990 16 0.900 2.423
14 Comparative Education 4705 1091 28 4,31 1989 25 0.724 0.848
15 Comparative Education Review 4281 1527 27 2,80 1989 33 0.907 1.115
16 Gender and Education 3756 903 27 4,16 2000 12 0.705 0.757
17 Educational Studies 3476 922 23 3,77 1989 15 0.351 0.563
18 British Journal of Educational Studies 3340 1848 22 1,81 1989 37 0.636 1.046
19 Educational Review 2931 1807 22 1,62 1989 41 0.544 0.711
Table 2. Journals in Professional Development and Curriculum Studies of Teachers
R Name TC TP H TC/TP Y V IF IF5
1 Journal of Research in Science Teaching 36001 1630 74 22,09 1989 26 3.020 3.782
2 Health Education Research 30001 1713 71 17,51 1991 6 1.944 2.508
3 Teaching and Teacher Education 22236 2011 54 11,06 1989 5 1.607 1.612
4 Aids Education and Prevention 20054 1200 56 16,71 1992 4 1.505 2.298
5 Learning and Instruction 14942 672 53 22,24 1997 7 3.079 4.071
6 Journal of American College Health 14787 1120 55 13,20 1994 43 1.397 2.223
7 Higher Education 14689 1876 48 7,83 1989 18 1.124 1.354
8 Reading Research Quarterly 14539 738 59 19,70 1989 24 1.650 2.681
9 Tesol Quarterly 13964 1667 54 8,38 1989 23 1.000 1.179
10 Teacher College Record 13515 2589 46 5,22 1989 90 0.722 1.169
11 Journal of College Student Development 12733 2210 37 5,76 1989 30 0.355 0.796
12 Elementary School Journal 11223 755 47 14,86 1989 89 1.111 1.641
13 Research in Higher Education 11065 911 43 12,15 1989 30 1.141 1.656
14 Phi Delta Kappan 10979 5758 35 1,91 1989 70 0.214 0.190
15 Studies in Higher Education 10876 1600 45 6,80 1989 14 1.278 1.985
16 Early Childhood Research Quarterly 10869 763 47 14,25 1994 9 2.058 3.657
17 Journal of Higher Education 10624 1324 45 8,02 1989 60 1.051 1.626
18 Journal of Teacher Education 10534 1093 41 9,64 1989 40 2.208 3.110
19 Reading and Writing 10383 737 47 14,09 1990 2 1.331 1.828
20 Instructional Science 7771 650 38 11,96 1989 18 1.130 2.016
Table 3. Journals in Education & Technology
R Name TC TP H TC/TP Y V IF IF5
1 Computers & Education 29269 2847 61 10,28 1989 13 2.630 3.242
2 ETR-D Educational Techn. Research and Development 11929 1076 49 11,09 1989 37 0.919 1.535
3 British Journal of Education Technology 9844 2793 37 3,52 1989 20 1.394 1.912
4 IEEE Transactions on Education 9767 1683 33 5,80 1989 32 1.220 1.383
5 Journal of Computer Assisted Learning 8750 817 42 10,71 1995 11 1.023 1.836
6 Journal of Educational Computing Research 5838 806 33 7,24 1989 5 0.659 0.858
7 Educational Technology Society 5797 1006 30 5,76 2003 6 0.824 1.340
8 Language Learning Technology 2693 334 29 8,06 2003 7 1.929 2.362
9 Int. J. Computer Supported Collaborative Learning 2121 196 24 10,82 2006 1 1.830 2.609
10 Computer Applications in Engineering Education 1914 717 14 2,67 1997 5 0.449 0.725
11 Australasian Journal of Educational Technology 1910 443 18 4,31 2007 23 0.875 1.198
12 Internet and Higher Education 1459 212 18 6,88 2008 11 2.048 2.635
13 Journal of Science Education and Technology 1241 368 14 3,37 2008 17 0.869 1.296
14 Int. Journal of Technology and Design Education 1098 340 15 3,23 2000 10 0.733 0.902
15 Interactive Learning Environments 1060 256 15 4,14 2003 11 0.750 1.032
16 System 983 446 12 2,20 2008 36 0.889 1.142
17 Learning Media and Technology 705 199 13 3,54 2008 33 0.958 1.529
18 IEEE Transactions on Learning Technologies 671 202 12 3,32 2008 1 1.220 1.383
19 Computer Assisted Language Learning 626 154 11 4,06 2008 21 1.023 1.836
20 Recall 354 120 10 2,95 2009 21 1.226 N/A
Table 4. Journals in Psychology & Education
R Name TC TP H TC/TP Y V IF IF5
1 Child Development 206420 3190 194 64,71 1989 60 4.235 5.834
2 Journal of Educational Psychology 82429 1665 133 49,51 1989 81 2.909 5.301
3 Journal of Counseling Psychology 42281 1348 85 31,37 1989 36 2.955 3.608
4 Educational and Psychological Measurement 26010 1943 62 13,39 1989 49 1.167 1.582
5 Educational Psychologist 23220 553 78 41,99 1989 24 4.844 4.161
6 School Psychology Review 18695 1168 58 16,01 1989 18 1.655 2.645
7 Contemporary Educational Psychology 17305 731 58 23,67 1989 14 2.000 3.159
8 British Journal of Educational Psychology 16917 1734 58 9,76 1989 59 2.250 2.468
9 Educational Psychology Review 15198 562 67 27,04 1989 1 2.846 3.974
10 Journal of School Psychology 13398 828 53 16,18 1989 27 2.282 3.470
11 Cognition and Instruction 11986 354 57 33,86 1989 6 1.750 2.403
12 Discourse Processes 11887 647 50 18,37 1989 12 0.962 1.411
13 Psychology in the Schools 11811 1719 38 6,87 1989 26 0.566 1.283
14 Journal for Research in Mathematics Education 9792 891 46 10,99 1989 20 1.000 1.730
15 Learning and Individual Differences 8760 933 38 9,39 1993 5 1.565 2.158
16 Creativity Research Journal 8161 767 42 10,64 1994 7 1.514 1.605
17 Journal of Educational Measurement 7384 650 39 11,36 1989 26 0.867 1.064
18 School Psychology Quarterly 6932 538 39 12,88 1994 9 1.000 2.508
19 J. Applied Research in Intellectual Disabilities 6833 2073 31 3,30 1996 9 0.982 1.465
Table 5. Journals in Scientific Disciplines & Education
R Name TC TP H TC/TP Y V IF IF5
1 Academic Medicine 94353 8560 97 11,02 1989 64 3.468 3.654
2 Journal of Chemical Education 54580 12026 60 4,54 1989 66 1.001 1.046
3 Medical Education 53778 4879 77 11,02 1989 23 3.617 3.963
4 American Journal of Physics 41560 6017 67 6,91 1989 57 0.804 0.853
5 Medical Teacher 24180 3619 51 6,68 1989 11 2.045 2.170
6 Journal of School Health 20531 2150 57 9,55 1989 59 1.659 2.132
7 Nurse Education Today 15333 2644 31 5,80 1994 14 1.456 1.641
8 American Journal of Pharmaceutical Education 9281 3019 23 3,07 1989 53 1.188 1.461
9 Journal of Nutrition Education and Behavior 7709 1080 34 7,14 2002 34 1.474 2.072
10 Advances in Health Sciences Education 6753 728 32 9,28 1996 1 2.705 2.976
11 Teaching and Learning in Medicine 6298 924 30 6,82 1996 8 1.118 1.173
12 European Journal of Physics 5731 1821 24 3,15 2001 22 0.619 0.652
13 International Journal of Engineering Education 5334 1994 20 2,68 1997 13 0.360 0.434
14 Advances in Physiology Education 5085 883 29 5,76 1995 13 1.237 1.389
15 Journal of Cancer Education 4431 1089 23 4,07 2000 15 1.054 0.978
16 Journal of Engineering Education 4389 393 29 11,17 2004 93 2.717 2.801
17 American Biology Teacher 4271 2837 20 1,51 1989 51 0.369 0.295
18 J. Continuing Education in the Health Professions 3585 408 24 8,79 2005 25 1.190 1.729
19 Journal of Biological Education 3009 1195 22 2,52 1989 23 0.424 0.566
20 Biochemistry and Molecular Biology Education 2948 1131 19 2,61 2000 28 0.593 0.610
Table 6. Journals in Special Education
R Name TC TP H TC/TP Y V IF IF5
1 Journal of Intellectual Disability Research 29388 6521 63 4,51 1992 36 2.411 2.800
2 Journal of Learning Disabilities 29093 1561 69 18,64 1989 22 2.025 2.807
3 Research in Developmental Disabilities 23404 2231 58 10,49 1989 10 2.735 2.869
4 Exceptional Children 18000 920 59 19,57 1989 55 1.941 2.943
5 Journal of Special Education 9248 626 42 14,77 1989 23 1.359 2.022
6 Remedial and Special Education 9050 1025 36 8,83 1989 10 1.013 1.070
7 Journal of Emotional and Behavioral Disorders 7701 453 44 17,00 1994 2 0.846 1.479
8 Topics in Early Childhood Special Education 7036 649 39 10,84 1989 9 1.364 1.814
9 Research in Autism Spectrum Disorders 6273 782 31 8,02 2007 1 2.378 2.665
10 Learning Disability Quarterly 6184 595 34 10,39 1989 12 0.643 1.440
11 Journal of Fluency Disorders 6069 1009 32 6,01 1989 14 1.082 1.571
12 Annals of Dyslexia 5974 378 42 15,80 1989 39 1.792 2.357
13 Journal of Intellectual Developmental Disability 5085 714 31 7,12 1996 21 1.061 1.556
14 American Annals of the Deaf 4702 1079 24 4,36 1989 134 0.885 1.080
15 Journal of Early Intervention 4640 600 30 7,73 1991 15 1.030 1.190
16 Gifted Child Quarterly 4221 825 24 5,12 1989 33 1.000 0.881
17 Journal of Positive Behavior Interventions 3547 310 30 11,44 2002 4 1.163 2.052
18 Journal of Deaf Studies and Deaf Education 2447 425 23 5,76 2005 10 1.754 2.045
19 Intervention in School and Clinic 2097 1018 17 2,06 1994 30 0.274 0.440
[image:4.595.57.548.547.775.2]20 Dyslexia 2054 234 21 8,78 2003 9 1.189 1.918
Table 7. Journals in Social Sciences Disciplines & Education
R Name TC TP H TC/TP Y V IF IF5
1 Sociology of Education 15089 491 64 30,73 1989 62 2.270 2.941
2 Educational Leadership 10781 5239 37 2,06 1989 46 0.123 0.225
3 Economics of Education Review 10778 1384 43 7,79 1995 14 1.146 1.565
4 Educational Evaluation and Policy Analysis 9749 487 45 20,02 1992 14 2.021 2.685
5 British Journal of Sociology of Education 8423 1322 36 6,37 1989 10 0.753 0.957
6 Journal of Educational and Behavioral Statistics 8284 513 38 16,15 1994 19 1.016 1.304
7 Academy of Management Learning Education 6845 769 37 8,90 2002 1 2.121 3.579
8 Educational Gerontology 6487 2071 27 3,13 1989 15 0.368 0.603
9 Quest 6399 841 36 7,61 1989 41 0.902 0.994
10 Journal of Education Policy 6289 853 33 7,37 1999 14 0.921 1.557
11 Educational Administration Quarterly 6227 726 34 8,58 1989 25 0.723 1.375
12 Academic Psychiatry 6155 1409 25 4,37 1995 19 1.243 1.479
13 Journal of Social Work Education 5926 1669 25 3,55 1989 25 0.439 0.771
14 Journal of Geography in Higher Education 5569 981 27 5,68 1989 13 0.859 1.135
15 Anthropology Education Quarterly 5063 1079 29 4,69 1989 20 0.765 0.930
16 Urban Education 4078 928 25 4,39 1989 23 0.657 0.753
17 Journal of Economic Education 3931 999 24 3,93 1989 20 0.329 0.429
18 Educational Policy 3920 860 26 4,56 1989 3 0.409 0.722
19 Journal of Moral Education 3753 1242 22 3,02 1989 18 0.306 0.604
Table 8. Global results for each of the seven categories of educational research
R Name NJ H TC TP TC/TP T200
1 Psychology & Education 41 220 593781 31781 18,68 122
2 Professional Development of Teachers and Curriculum Studies 73 139 405354 63449 6,39 15
3 Scientific Disciplines & Education 38 139 390636 63678 6,13 22
4 Education Studies 59 146 223691 35979 6,22 29
5 Special Education 39 99 198774 26018 7,64 6
6 Social Sciences Disciplines & Education 52 97 160932 35151 4,58 5
7 Education & Technology 25 88 98749 15789 6,25 1
Table 9. Citation evolution in educational research classified by the seven categories
Years ES ET PDTCS PE SDE SSDE SE Total
1989 7422 1370 9924 21595 8947 3476 6712 59446
1990 8021 1261 12104 24295 13464 4158 5711 69014
1991 8565 1405 13198 23719 10838 4596 7010 69331
1992 9245 1136 13240 21782 12634 5353 6843 70233
1993 9004 1640 13965 24532 11964 5142 7498 73745
1994 9021 2021 13662 25504 11268 5111 8365 74952
1995 10319 1845 18264 25568 11697 6165 7707 81565
1996 10463 2022 17032 33226 13459 5954 8616 90772
1997 9459 2535 18244 21613 13939 7028 8433 81251
1998 11177 1966 18923 26135 16582 7691 8373 90847
1999 9226 2895 18479 21939 19155 8860 8304 88858
2000 12819 3783 23629 29578 19621 8247 9510 107187
2001 11789 3521 20664 27633 20054 7568 8097 99326
2002 10787 3631 23270 24439 22858 9749 8904 103638
2003 11124 5888 20915 23733 20926 10165 10006 102757
2004 11659 5144 22208 24506 25810 9003 9541 107871
2005 9988 7063 20396 18742 24840 8945 11219 101193
2006 11245 6281 22103 20104 23022 8394 9441 100590
2007 9225 7884 18660 18345 23117 7718 9812 94761
2008 11582 11906 20571 15267 20455 8303 8203 96287
2009 10451 11242 17878 12642 20383 7905 10059 90560
2010 7833 9800 14145 11012 18833 5831 8668 76122
2011 5428 6227 9192 7272 14075 3911 7499 53604
2012 3095 4075 5392 3758 9402 2146 3932 31800
2013 1293 2023 2098 1783 5754 916 1792 15659
IV. CONCLUSION
This article presents a general overview of the publication and citation structure of all the journals that are currently indexed in WoS in any of the four educational categories. In order to be more specific, this study has classified education research in seven categories: Education Studies, Professional Development and Curriculum Studies of Teachers, Education & Technology, Psychology & Education, Scientific Disciplines & Education, Special Education and Social Sciences Disciplines & Education.
Education Studies is the core category in educational research having many of the leading general education journals. However, Psychology & Education is the discipline with the highest results according to the total number of articles and cites. Another interesting issue seen in the analysis is that most of the journals are English-speaking although some non-English speaking journals are found in the list, but usually far away from the top.
Note that in future research we expect to develop further developments by analysing other general variables including leading authors, universities and countries in the field. Additionally, sometimes it also becomes interesting to focus on a specific region such as Europe or Asia [14].
REFERENCES
[1] B.S. Aylward, M.C. Roberts, J. Colombo, R.G. Steele, Identifying the classics: an examination of articles published in the Journal of Pediatric Psychology from 1976–2006. Journal of Pediatric
Psychology, 33: 576-589, 2008.
[2] R.N. Broadus, Toward a definition of “Bibliometrics”. Scientometrics, 12:373-379, 1987.
[3] Y.H. Chang, C.Y. Chang, Y.H. Tseng, Trends of science education research: An automatic content analysis. Journal of Science Education
and Technology, 19: 315-331, 2010.
[4] B. Cheng, M.H. Wang, A.I. Morch, N.S. Chen, H.W.H. Kinshuk, J.M. Spector, Research of e-learning in the workplace 2000-2012: A bibliometric analysis of the literature. Educational Research Review, 11:56-72, 2014.
[5] E. Garfield, Citation Indexes for Science. Science, 122: 108-111, 1955. [6] E. Garfield, Significant journals of science. Nature, 264: 609-615,
1976.
[7] E. Garfield, I.H. Sher, New factors in the evaluation of scientific literature through citation indexing. American Documentation, 14: 195-201, 1963.
[8] J.E. Hirsch, An index to quantify an individual’s scientific research output. Proceedings of the National Academy of Sciences of the
United States of America, 102:16569-16572, 2005.
[9] P.H. Hsieh, T. Acee, W.H. Chung, Y.P. Hsieh, H. Kim, G.D. Thomas, J. You, D.H. Robinson, An alternate look at educational psychologist's productivity from 1991 to 2002. Contemporary Educational
Psychology, 29: 333-343, 2004.
[10] H.W.H. Kinshuk, D. Sampson, N.S. Chen, Trends in educational technology through the lens of the highly cited articles published in the journal of educational technology and society. Educational
[image:5.595.50.546.178.456.2][11] J.M. Merigó, A.M. Gil-Lafuente, R.R. Yager, An overview of fuzzy research with bibliometric indicators. Applied Soft Computing, 27: 420-433, 2015.
[12] J.M. Merigó, A. Mas-Tur, N. Roig-Tierno, D. Ribeiro-Soriano, A bibliometric overview of the Journal of Business Research between 1973 and 2014. Journal of Business Research, 68: 2645-2653, 2015. [13] A. Togia, N. Tsigilis, Impact factor and education journals: A critical
examination and analysis. International Journal of Educational
Research, 45:362-379, 2006.
[14] C.C. Tsai, Y.T. Wu, Y.C. Lin, J.C. Liang, Research regarding science learning in Asia: An analysis of selected science education journals.