SSMT: A Machine Translation Evaluation View to Paragraph-to-Sentence
Semantic Similarity
Pingping Huang
Department of Linguistic Engineering School of Software and Microelectronics
Peking University, China
Baobao Chang
Key Laboratory of Computational Linguistics, Ministry of Education Institute of Computational Linguistics
Peking University, China
Abstract
This paper presents the system SSMT measuring the semantic similarity between a paragraph and a sentence submitted to the SemEval 2014 task3: Cross-level Se-mantic Similarity. The special difficulty of this task is the length disparity between the two semantic comparison texts. We adapt several machine translation evalua-tion metrics for features to cope with this difficulty, then train a regression model for the semantic similarity prediction. This system is straightforward in intuition and easy in implementation. Our best run gets 0.808 in Pearson correlation. METEOR-derived features are the most effective ones in our experiment.
1 Introduction
Cross level semantic similarity measures the simi-larity between different levels of text unit, for ex-ample, between a document and a paragraph, or between a phrase and a word.
Paragraph and sentence are the natural language units to convey opinions or state events in daily life. We can see posts on forums, questions and answers in Q&A communities and customer re-views on E-commerce websites, are mainly organ-ised in these two units. Better similarity measure-ment across them will be helpful in clustering sim-ilar answers or reviews.
The paragraph-to-sentence semantic similarity subtask in SemEval2014 task3 (Jurgens et al., 2014) is the first semantic similarity competition across these two language levels. The special difficulty of this task is the length disparity be-tween the compared pair: a paragraph contains
This work is licenced under a Creative Commons Attribution 4.0 International License. Page numbers and proceedings footer are added by the organizers. License details: http: //creativecommons.org/licenses/by/4.0/
3.67 times the words of a sentence on average in the training set.
Semantic similarity on different levels, for ex-ample, on word level (Mikolov et al., 2013), sen-tences level (B¨ar et al., 2012), document level (Turney and Pantel, 2010), have been well studied, yet methods on one level can hardly be applied to a different level, let alone be applied for the cross-level tasks. The work of Pilehvar et al.(2013) was an exception. They proposed a unified method for semantic comparison at multi-levels all the way from comparing word senses to comparing text documents
Our work is inspired by automatic machine translation(MT) evaluation, in which different metrics are designed to compare the adequacy and fluency of a MT system’s output, called hypothe-sis, against a gold standard translation, called ref-erence. As MT evaluation metrics measure sen-tence pair similarity, it is a natural idea to general-ize them for paragraph-sentence pair.
In this paper, we follow the motivations of sev-eral MT evaluation metrics yet made adaption to cope with the length disparity difficulty of this task, and combine these features in a regression model. Our system SSMT (SemanticSimilarity in view ofMachineTranslation evaluation) involves no extensive resource or strenuous computation, yet gives promising result with just a few simple features.
2 Regression Framework
In our experiment, we use features adapted from some MT evaluation metrics and combine them in a regression model for the semantic similarity measurement. We exploit the following two sim-ple models:
A linear regression model is presented as:
y=w1xi+w2xi..+wnxn+ε
A log-linear model is presented as:
y=xw11 ·xw22 ..·xwn
n ·eε
Whereyis the similarity score,{x1, x2.., xn}are
the feature values.
We can see that in a log-linear model, if any featurexiget a value of 0, the outputywill suck in
0 forever no matter what the values other features get. In our experiment we resort to smoothing to avoid this “0-trap” for some features (Section 4.3).
3 Features
MT evaluation metrics vary from lexical level to syntactic level to semantic level. We consider only lexical ones to avoid complicated steps like pars-ing or semantic role labellpars-ing, which are computa-tional expensive and may bring extra noise.
But instead of directly using the MT evaluation metrics, we use the factors in them as features, the idea is that the overall score of the original metric is highly related to the length of both of the com-pared pair, but its factors are often related to the length of just one side yet still carry useful simi-larity information.
3.1 BLEU-Derived Features
As the most wildly used MT evaluation metric, BLEU (Papineni et al., 2002) uses the geomet-ric mean ofn-gram precisions to measure the hy-potheses against references. It is a corpus-based and precision-based metric, and uses “brevity penalty” as a replacement for recall. Yet this penalty is meaningless on sentence level. There-fore we considers only the precision factors in BLEU:
PnBLEU =
Ngramref∩Ngramhyo
Ngramref
We use the modifiedn-gram precision here and regard “paragraph” as “reference”, and “sentence” as the “hypothesis”. N= 1,2,3,4. We call these four features BLEU-derived features.
3.2 ROUGE-L-Derived Features
ROUGE-L (Lin and Och, 2004) measures the largest common subsequence(LCS) between a compared pair. BLEU implies the n-gram to be consecutive, yet ROUGE-L allows for gaps be-tween them. By considering only in-sequence
words, ROUGE-L captures sentence level struc-ture in a natural way, then:
Rlcs = LCSlength(ref, hyo(hyo))
Plcs = LCSlength(ref, hyo(ref))
Flcs = (1 +β
2)R
lcsPlcs)
Rlcs+β2Plcs
WhereLCS(ref, hoy)is the length of LCS of the compared pair. We setβ = 1, which means we don’t want to make much distinction between the “reference” and “hypothesis” here. We call these three features ROUGE-L-derived features. 3.3 ROUGE-S-Derived Features
ROUGE-S (Lin and Och, 2004) uses skip-bigram co-occurrence statistics for similarity measure-ment. One advantage of skip-bigram over BLEU is that it does not require consecutive matches but is still sensitive to word order. Given the reference of lengthn, and hypothesis of lengthm, then:
Pskip2 = skipC2((ref, hyom,2) )
Rskip2 = skipC2((ref, hyon,2) )
Fskip2 = (1 +β
2)Pskip2Rskip2
Rskip2+β2Pskip2
WhereCis combination, andskip2(ref, hyo)is the number of common skip-bigrams. We also set β = 1 here, and call these three indicators ROUGE-S-derived features.
3.4 METEOR-Derived Features
METEOR (Banerjee and Lavie, 2005) evaluates a hypothesis by aligning it to a reference trans-lation and gives sentence-level similarity scores. It uses a generalized concept of unigram mapping that matches words in the following types: ex-act match on words surface forms , stem match on words stems, synonym match according to the synonym sets in WordNet, and paraphrase match (Denkowski and Lavie, 2010).
METEOR also makes distinction between con-tent words and function words. Each type of matchmiis weighted bywi, let(mi(hc), mi(hf))
(mi(rc), mi(rf)) be the counts in the reference,
then:
P =
P
i=1wi·(δ·mi(hi) + (1−δ)·mi(hf))
δ· |hc|+(1−δ)· |hf |
R=
P
i=1wi·(δ·mi(ri) + (1−δ)·mi(rf))
δ· |rc|+(1−δ)· |rf |
Fmean= αP + (1P ·R−α)R
To account for word order difference, the frag-mentation penalty is calculated using the total number of matched words(m) and the number of chunks1(ch) in the hypothesis:
P en=γ·
ch
m
β
And the final METEOR score is:
Score= (1−P en)·Fmean
Parameters α, β, γ, δand wi...wn are tuned to
maximize correlation with human judgements (Denkowski and Lavie, 2014). We use Meteor1.5 system2 for scoring. Parameters are tuned on
WMT12, and the paraphrase table is extracted on the WMT data.
We use the p, r, frag(frag = ch/m) and scoreas features and call them METEOR-derived features.
4 Experiment and Discussion 4.1 Data Set
The SemEval2014 task3 subtask gives a train-ing set of 500 paragraph-sentence pairs, with hu-man annotated continuous score of0−4. These pairs are labelled with genres of “Newswire/ cqa3/
metaphoric/ scientific/ travel/ review”. Systems are asked to predict the similarity scores for 500 pairs in the test set. Performance is evaluated in Pearson correlation and Spearman correlation. 4.2 Data Processing
To avoid meaningless n-gram match “the a”, or words surface form difference, we employ very simple data processings here: for features derived from BLEU, ROUGE-L and ROUGE-S, we re-move stop words and stem the sentences with
1Chunk is defined as a series of matched unigrams that is
contiguous and identically ordered in both sentences
2https://www.cs.cmu.edu/ alavie/METEOR/ 3cqa:Community Question Answering site text
coreNLP4. For METEOR-derived features, we use
the tool’s option for text normalization before matching.
4.3 Result
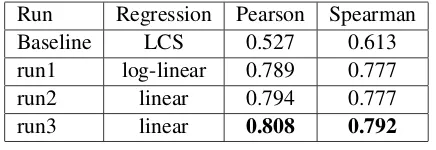
Though texts with different genres may have dif-ferent regression parameters, we just train one model for all for simplicity. Table 1 compares the result. Run1 is submitted as SSMT in the official evaluation. It’s a log-linear model. We choose more dense features for log-linear model and use smoothing to avoid the “0-trap” men-tioned in (Section 2). The features include P1,2BLEU,PROUGE−L,PROUGE−S4 features, and 4 METEOR-derived features, altogether 8 fea-tures. When calculation the first 4 features, we plus 1 to both numerator and denominator as smoothing. Run2 is a linear-regression model with the same features as Run1. Run3 is a simple linear regression model, which is free from the “0-trap”, thus we use all the 14 features without smoothing. We use Matlab for regression. The baseline is of-ficially given using LCS.
Run Regression Pearson Spearman
Baseline LCS 0.527 0.613
run1 log-linear 0.789 0.777
run2 linear 0.794 0.777
[image:3.595.308.526.383.458.2]run3 linear 0.808 0.792
Table 1: System Performance.
4.4 System Analysis
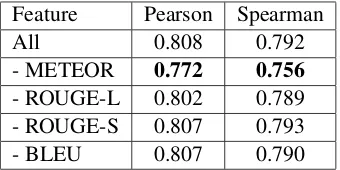
We compares the effectiveness of different fea-tures in a linear regression model. Table 2 shows the result. “All” refers to all the fea-tures, “-METEOR” means the feature set ex-cludes METEOR-derived features. We can see the METEOR-derived features are the most effective ones here.
Figure 1 shows the performance of our sys-tem submitted as SSMT in the SemEval2014 task3 competition. It shows quite good correlation with the gold standard.
A well predicted example is the #trial-p2s-5 pair in the trial set:
Paragraph: Olympic champion Usain Bolt re-gained his 100m world title and won a fourth in-dividual World Championships gold with a sea-son’s best of 9.77 seconds in Moscow. In heavy
Feature Pearson Spearman
All 0.808 0.792
- METEOR 0.772 0.756 - ROUGE-L 0.802 0.789 - ROUGE-S 0.807 0.793
- BLEU 0.807 0.790
[image:4.595.97.267.62.147.2]Table 2: Effectiveness of Different Features. “-METEOR” means the feature set excluding METEOR-derived features.
Figure 1: Result Scatter of SSMT.
rain, the 26-year-old Jamaican made amends for his false start in Daegu two years ago and fur-ther cemented his status as the greatest sprinter in history. The six-time Olympic champion over-took Justin Gatlin in the final stages, forcing the American to settle for silver in 9.85. Bolt’s com-patriot Nesta Carter (9.95) claimed bronze, while Britain’s James Dasaolu was eighth (10.21).
Sentence: Germany’s Robert Harting beats Iran’s Ehsan Hadadi and adds the Olympic discus title to his world crown.
The system gives a prediction of 1.253against the gold standard 1.25. We can see that topic words like “Olympic” , “world crown”, “beats” in the short text correspond to expressions of “world title” , “champion” across several sentences in the long text, but this pair of texts are not talking about the same event. The model captures and models this commonness and difference very well .
But Figure 1 also reveals an interesting phe-nomenon: the system seldom gives the boundary scores of 0 or 4. In other words, it tends to over-score or underover-score the boundary conditions. An example in point is the #trial-p2s-17 pair in the trial data, it is actually the worst predicted pair by our system in the trail set:
Paragraph: A married couple who met at work is not a particularly rare thing. Three in ten work-ers who have dated a colleague said in a recent survey by CareerBuilder.com that their office ro-mance eventually led to marriage.
Sentence: Marrying a coworker isn’t uncom-mon given that 30% of workers who dated a coworker ended up marrying them.
The system gives a 1.773 score against the gold standard of 4. It should fail to detect the equality of expressions between “three in ten” and “30%”. Thus better detection of phrase similarity is de-sired. We think this is the main reason to under-score the similarity. For test pairs with the genre of “Metaphoric”, the system almost underscores all of them. This failure has been expected, though. Because “Metaphoric” pairs demand full under-standing of the semantic meaning and paragraph structure, which is far beyond the reach of lexical match metrics.
5 Conclusion
MT evaluation metrics have been directly used as features in paraphrase (Finch et al., 2005) de-tection and sentence pair semantic comparison (Souza et al., 2012). But paragraph-to-sentence pair faces significant length disparity, we try a way out to alleviate this impact yet still follow the mo-tivations underlying these metrics. By factorizing down the original metrics, the linear model can flexibly pick out factors that are not sensitive to the length disparity problem.
We derive features from BLEU, ROUGE-L, ROUGE-S and METEOR, and show that METEOR-derived features make the most signifi-cant contributions here. Being easy and light, our submitted SSMT achieves 0.789 in Pearson and 0.777 in Spearman correlation, and ranks 11 out of the 34 systems in this subtask. Our best try achieves 0.808 in Pearson and 0.786 in Spearman correlation.
Acknowledgements
[image:4.595.103.259.221.359.2]References
Andrew Finch, Yong S. Hwang, Eiichiro Sumita. Us-ing machine translation evaluation techniques to de-termine sentence-level semantic equivalence. Pro-ceedings of the Third International Workshop on Paraphrasing(IWP2005), 2005: 17-24.
Chin Y. Lin,Franz J. Och. Automatic evaluation of ma-chine translation quality using longest common sub-sequence and skip-bigram statistics. Proceedings of the 42nd Annual Meeting on Association for Com-putational Linguistics. ACL, 2004: 605.
Daniel B¨ar, Chris Biemann, Iryna Gurevych, et al. Ukp: Computing semantic textual similarity by combining multiple content similarity measures.
Proceedings of the First Joint Conference on Lexical and Computational Semantics-Volume 1: Proceed-ings of the main conference and the shared task, and Volume 2: Proceedings of the Sixth International Workshop on Semantic Evaluation. ACL, 2012: 435-440.
David Jurgens, Mohammad Taher Pilehvar, and Roberto Navigli. SemEval-2014 Task 3: Cross-Level Semantic Similarity. In Proceedings of the 8th International Workshop on Semantic Evaluation (SemEval-2014)., August 23-24, 2014, Dublin, Ire-land.
George Miller,Christiane Fellbaum. WordNet. http://wordnet.princton.edu/, 2007.
Jos´e G C de Souza, Matteo Negri, Yashar Mehdad. FBK: machine translation evaluation and word sim-ilarity metrics for semantic textual simsim-ilarity. Pro-ceedings of the First Joint Conference on Lexical and Computational Semantics-Volume 1: Proceed-ings of the main conference and the shared task, and Volume 2: Proceedings of the Sixth International Workshop on Semantic Evaluation. ACL, 2012: 624-630.
Kishore Papineni, Salim Roukos, Todd Ward, et al. BLEU: a method for automatic evaluation of ma-chine translation. Proceedings of the 40th annual meeting on association for computational linguis-tics. ACL, 2002: 311-318.
Michael Denkowski, Alon Lavie. Extending the ME-TEOR machine translation evaluation metric to the phrase level. Human Language Technologies: The 2010 Annual Conference of the North American Chapter of the Association for Computational Lin-guistics. ACL, 2010: 250-253.
Michael Denkowski, Alon Lavie. Meteor Univer-sal: Language Specific Translation /Evaluation for Any Target Language translation. Proceedings of the EACL 2014 Workshop on Statistical Machine Trans-lation, 2014.
Mohammad T Pilehvar, David Jurgens, Roberto Nav-igli. Align, Disambiguate and Walk: A Unified
Approach for Measuring Semantic Similarity Pro-ceedings of the 51st Annual Meeting of the Asso-ciation for Computational Linguistics,ACL, 2013: 1341-1351.
Peter D. Turney and Patrick Pantel. From frequency to meaning: Vector space models of semantics Artifi-cial Intelligence Research, 2010. 37(1): 141-188 Satanjeev Banerjee, Alon Lavie. METEOR: an
auto-matic metric for MT Evaluation with improved cor-relation with human judgements. Proceedings of the ACL Workshop on Intrinsic and Extrinsic Evaluation Measures for Machine Translation and/or Summa-rization., 2005: 65-72.
![5 (4 Fluorophenyl) 3 [5 methyl 1 (4 methylphenyl) 1H 1,2,3 triazol 4 yl] N phenyl 4,5 dihydro 1H pyrazole 1 carbothioamide](data:image/gif;base64,R0lGODlhAQABAIAAAP///wAAACH5BAEAAAAALAAAAAABAAEAAAICRAEAOw==)