© 2019, IRJET | Impact Factor value: 7.34 | ISO 9001:2008 Certified Journal | Page 1843
ANALYSIS OF CAR BODY AERODYNAMICS TO REDUCE DRAG
COEFFICIENT USING CFD TOOL
Satyam Singh
1, Savankumar B. Bhanderi
2, Raikaan Shaikh
3, Rajan Parmar
4,
Riken K. Mangukiya
51,2,3,4,5
Undergraduate Student, Dept. of Mechanical Engineering, SSASIT, Surat, India
---***---
Abstract -
Aerodynamics concerns with the study of the ait motion when the air interacts with the moving objects.
Aerodynamics in the automotive field refers to the study of motion of air when it interacts with the road vehicles. The
study of aerodynamics in the field of automotive is important to improve the performance of the vehicle by controlling
parameters such as drag, wind noise, and undesired lift forces. Study of aerodynamics is also very important in certain
cases where it is also useful to generate down force. Aerodynamic drag is one of the main obstacles to accelerate a solid
body when it moves in the air. In this paper, we have performed Computational Fluid Dynamics analysis on two
different geometries using STAR CCM+ software with the main aim being reduction in Coefficient of Drag. First, we
analysed the car without vortex generators using STAR CCM+. Then we added seven vortex generators to the geometry
of the same care and ran the analysis again. We noted the velocity, pressure and Vortex generation around the car
body at a certain velocity. In conclusion, we compared the results from both the analysis.
Key Words: Aerodynamic drag, Coefficient of Drag, CFD …
1.
INTRODUCTION
The aerodynamics of the car is perhaps the most important aspect to take into consideration while designing a car. Better aerodynamics leads to increased stability and speed of a vehicle and makes it more fuel efficient and safe. The aerodynamics of vehicle is divided into three categories.
1. Flow around the body
2. Flow through the body
3. Flow within the machinery
We have analysed the flow around the body. And the results were then plotted on chart and the effects of vortex generator in the drag reduction was observed. Furthermore, we have also shown meshing independency.
1.1 Drag Coefficient
A drag force is the resistance force caused by the motion of a body through a fluid, such as water or air. Around half of the energy produced by burning of the fuel is spent on overcoming this force. Drag force acts opposite to the direction of the oncoming flow velocity. This is the relative velocity between the body and the fluid. Having a low Drag coefficient means that a vehicle can move easily through the air with minimum resistance. The drag force D exerted on a body traveling through a fluid is given by following equation.
Where:
D = Drag Force
C = the drag coefficient, which can vary with the speed of the body.
Ρ = the density of the fluid through which the body is moving
© 2019, IRJET | Impact Factor value: 7.34 | ISO 9001:2008 Certified Journal | Page 1844 A = the projected cross-sectional area of the body perpendicular to the flow direction
1.2 Vortex Generator
To improve the performance of a car, certain factors are taken into consideration when developing an automobile. These factors include aerodynamic properties of a car, fuel efficiency and aesthetic consideration. In recent time, it has been main goal of automobile company to reduce the drag of car. There have been many researches on this topic. Vortex generators are one of many ways to reduce the drag of the car body aerodynamics.
2.
COMPUTATIONAL FLUID DYNAMICS
CFD is the branch of fluid mechanics which deals with solving mathematical equations to predict the direction of the fluid flow. It is widely used because of high number of iterations and less time consuming. Advantages of CFD includes flexibility to change design parameters, and less cost. We have also used CFD tool in STAR CCM+ software to analyse the pressure contour, velocity contour and the vortex contour of an automobile body.
3.
ANALYSIS
3.1 Model 1 –without vortex generators.
First, the geometry of a car is created with the use of sold work without vortex generators.
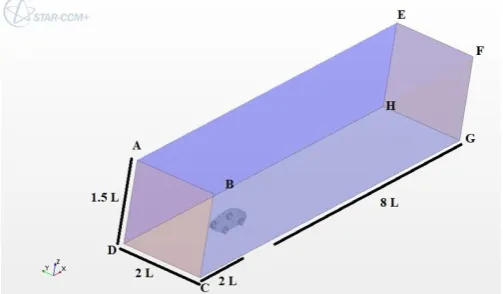
[image:2.595.194.400.362.547.2]a) Geometry
Fig. 1 Geometry without Vortex Generators
b) Boundary Conditions
[image:2.595.172.424.605.752.2]© 2019, IRJET | Impact Factor value: 7.34 | ISO 9001:2008 Certified Journal | Page 1845 Where;
ABCD = Velocity Inlet (Ui)
EFGH = Pressure Outlet
AEHD, BFGC, AEFB – Far Field
CDHG – Tangential Velocity (Ut)
Ui = Ut
L = 4726 mm.
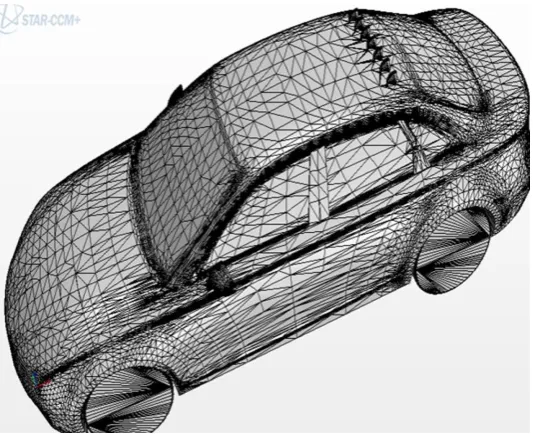
[image:3.595.167.381.276.465.2]c) Meshing
Fig. 3 Meshing Without Vortex Generator
Mesh Type – Polyhedral
Mesh Count - 641206
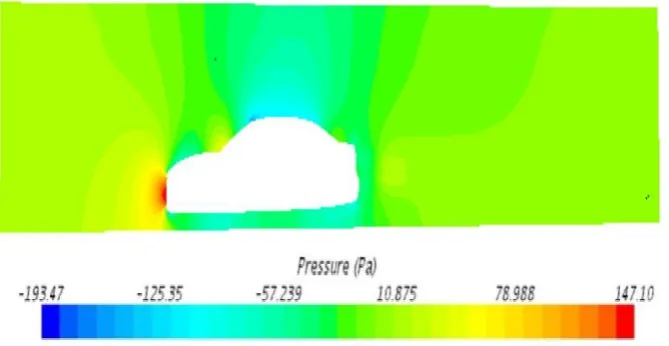
d) CFD Analysis Results
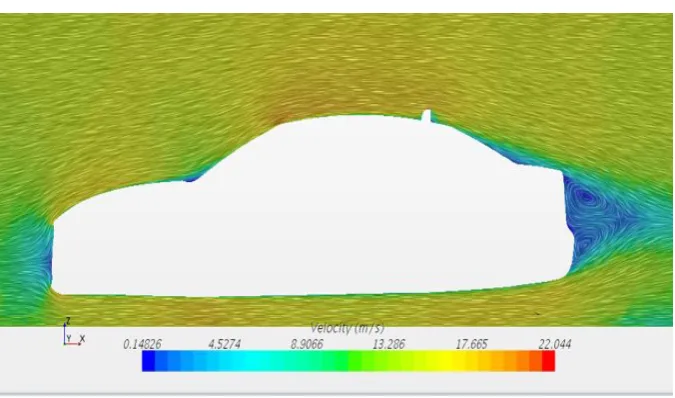
[image:3.595.135.470.574.747.2]© 2019, IRJET | Impact Factor value: 7.34 | ISO 9001:2008 Certified Journal | Page 1846 Fig. 5 Velocity Contour without Vortex Generators
Fig. 6 Vortex Contour without Vortex Generators
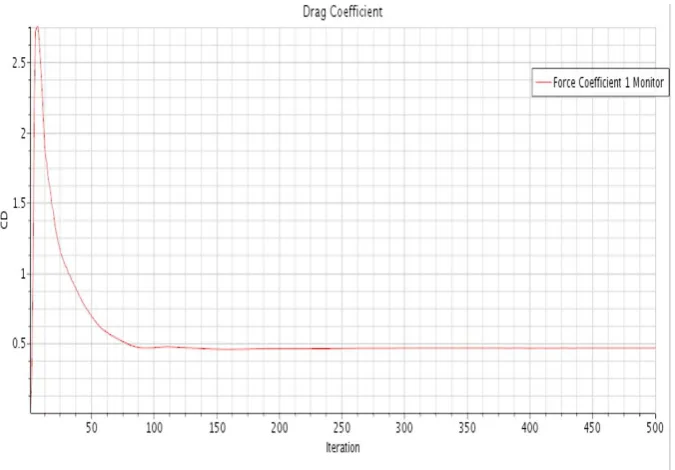
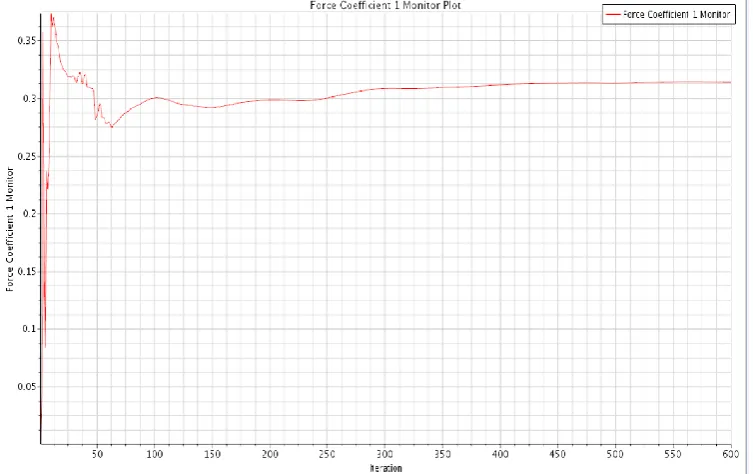
© 2019, IRJET | Impact Factor value: 7.34 | ISO 9001:2008 Certified Journal | Page 1847 Chart 2 Drag Coefficient without Vortex Generators
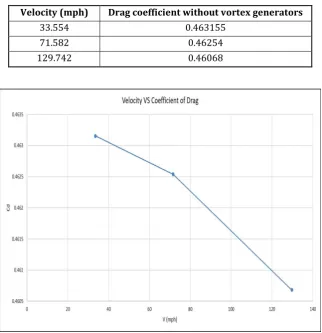
Table 1 Drag Coefficient without vortex generator
Velocity (mph) Drag coefficient without vortex generators
33.554 0.463155
71.582 0.46254
129.742 0.46068
© 2019, IRJET | Impact Factor value: 7.34 | ISO 9001:2008 Certified Journal | Page 1848
3.2 Model 2 – With Vortex generators
In the second analysis, vortex generators are attached at the roof of the car. Total of 7 vortex generators were attached each of length 80 mm, width 20 mm, height 90 mm, and radius 60 mm. The vortex generators were placed 100 mm from the rear end of the top.
[image:6.595.157.438.177.399.2]a) Geometry
Fig. 7 Geometry with Vortex Generators
Boundary conditions are the same as without vortex generators
b) Meshing
Fig. 8 Meshing with Vortex Generators
Mesh Type – Polyhedral
[image:6.595.165.432.470.687.2]© 2019, IRJET | Impact Factor value: 7.34 | ISO 9001:2008 Certified Journal | Page 1849 c) CFD Analysis Results
[image:7.595.131.470.319.478.2]Fig. 9 Pressure contour with Vortex Generators
Fig. 10 Velocity Contour with Vortex Generators
[image:7.595.130.468.504.703.2]© 2019, IRJET | Impact Factor value: 7.34 | ISO 9001:2008 Certified Journal | Page 1850 Fig. 12 Vortex contour with Vortex Generators
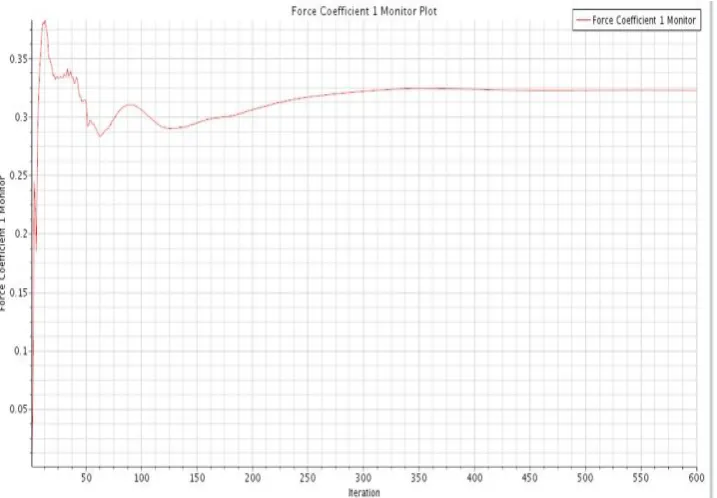
Chart 4 Drag Coefficient with Vortex Generators
Table 2 Drag Coefficient without vortex generator
Velocity (mph) Drag coefficient with vortex generators
33.554 0.3127347
71.582 0.3125
[image:8.595.110.487.319.556.2]© 2019, IRJET | Impact Factor value: 7.34 | ISO 9001:2008 Certified Journal | Page 1851 Chart 5 Velocity vs Coefficient of Drag
4.
MESHING INDEPENDENCY
4.1 Base size 0.5
© 2019, IRJET | Impact Factor value: 7.34 | ISO 9001:2008 Certified Journal | Page 1852
4.2 Basic Size = 2
Chart 7 Drag Coefficient with@Base size 2
4.3 Basic Size = 3
[image:10.595.121.480.108.357.2]Chart 8 Drag Coefficient with@Base size 3
Table 3 Meshing Independency
Base Size No. of Cells Cd
0.5 1132621 0.306031
2 576625 0.32266
© 2019, IRJET | Impact Factor value: 7.34 | ISO 9001:2008 Certified Journal | Page 1853
5.
COMPARISON OF DRAG COEFFICIENT
Chart 9 Comparison of Drag Coefficient
6.
CONCLUSION
From analysis it is clear that the flow of air tends to separate without implementation of vortex generators at the back end. Implementation of vortex generators at the back end leads to better control of flow separation and drag reduction thereby improving the overall performance of an automobile. Hence, it can be concluded that aerodynamic stability and fuel economy can be improved by implementation of vortex generators.
REFERENCES
[1] P.N. Selvaraju et al (2015), “Analysis of Drag and Lift Performance in Sedan car model using CFD”, Proceeding of National conference on recent trends and developments in sustainable green technologies, pp 429-435.
[2] Dan barbut, Euget Mihai Negrus CFD “Analysis of road vehicles-case study”, Inca bulletin, 3(2011) 15-22.
[3] Jaspinder Singh review on Aerodynamic Drag Reduction of Automobile Car”, International Journal of Scientific Research vol3