ISSN Online: 2164-5396 ISSN Print: 2164-5388
DOI: 10.4236/ojbiphy.2018.83012 Jul. 25, 2018 163 Open Journal of Biophysics
Specific Radius Change of Quantum Dot inside
the Lipid Bilayer by Charge Effect of Lipid
Head-Group
Soon Ki Sung
1,2*, Hyuk Kyu Pak
3*, Jong Hyeok Kwak
4, Sang Weon Lee
1, Young Ha Kim
1,
Beong Ik Hur
5, Seong Jin Jin
6, Gyeong Rip Kim
1,2#†1Department of Neurosurgery, Pusan National University Yang-san Hospital, Yang-san, Korea 2Research Institute for Convergence of Biomedical Science and Technology, Yang-san, Korea 3Department of Physics, Ulsan National Institute of Science and Technology, Ulsan, Korea 4Department of Radiology, Pusan National University Yang-san Hospital, Yang-san, Korea 5Department of Neurosurgery, Pusan National University Hospital, Busan, Korea
6Haeundae Paik Hospital, Busan, Korea
Abstract
We studied the quantum dot-liposome complex (QLC), which is the giant un-ilamellar vesicle with quantum dots (QDs) incorporated in its lipid bilayer. A spin coating method in conjunction with the electroformation technique yielded vesicles with highly homogeneous unilamellar structure. We observed QD size dependence of the QLC formation: QLCs form with blue, green and yellow-emission QD (core radius ~1.05 nm, 1.25 nm and 1.65 nm) but not with red-emission QD (core radius ~2.5 nm). In order to explain this size de-pendence, we made a simple model explaining the QD size effect on QLC formation in terms of the molecular packing parameter and the lipid confor-mational change. This model predicts that QDs below a certain critical size (radius ≈ 1.8 nm) can stably reside in a lipid bilayer of 4 - 5 nm in thickness for Egg-PC lipids. This is consistent with our previous experimental results. In the case of red-emission QD, QD-aggregations are only observed on the fluo-rescent microscopy instead of QLC. We expected that the reduction of pack-ing parameter (P) would lead to the change of specific QD radius. This pre-diction could be verified by our experimental observation of the shift of the specific QD size by mixing DOPG.
Keywords
Quantum Dot-Liposome Complexes (QLCs), The Interface Energy at Optical Head Area, Packing Parameter, DOPC/DOPG QLC
*Contributed equally to this work.
#Corresponding author earlier know as Seong Jin Kim. How to cite this paper: Sung, S.K., Pak,
H.K., Kwak, J.H., Lee, S.W., Kim, Y.H., Hur, B.I., Jin, S.J. and Kim, G.R. (2018) Specific Radius Change of Quantum Dot inside the Lipid Bilayer by Charge Effect of Lipid Head-Group. Open Journal of Bio-physics, 8, 163-175.
https://doi.org/10.4236/ojbiphy.2018.83012
Received: June 12, 2018 Accepted: July 22, 2018 Published: July 25, 2018
Copyright © 2018 by authors and Scientific Research Publishing Inc. This work is licensed under the Creative Commons Attribution International License (CC BY 4.0).
DOI: 10.4236/ojbiphy.2018.83012 164 Open Journal of Biophysics
1. Introduction
Labeling biomolecules and cells with organic fluorophores are representative tools for studying the underlying complex interactions and the dynamics in me-tabolic processes in various time and length scales. Recently, these organic fluo-rophores have been gradually replaced by nano-size semiconductor nanocrystals [1] such as quantum dots (QDs).
This preference for QDs results from several remarkable optical properties of QDs. In contrast to organic fluorophores, QDs have a higher quantum yield, and a narrower and more symmetric emission spectrum which can be controlled by tuning the core size of the QDs during synthesis procedures. Furthermore, the photo-bleaching effect of QDs is much weaker compared to organic fluoro-phores. However, before introduction into biological environments, the surface of QDs should be transformed to hydrophilic with the help of amphiphilic mo-lecules or other surface-capping materials due to the hydrophobic surface prop-erty of QDs. In recent years, several groups reported passivation of QDs by phospholipid, which is a building unit of the cell membrane [2]-[11]. One good example is QLC (Quantum dot-Liposome Complex) which is a giant unilamellar vesicle with QDs incorporated in the lipid bilayer [12] [13] [14] [15].
QLC is good candidate for biomedical imaging in site of specific drug deli-very. For instance, biological fusion area between QLCs and biological targets can be fluorescent by conjugating with QDs and macromolecules such as cell membrane [12]. In addition, if QDs coexist with organic fluorophores in the li-pid bilayer of QLCs, fluorescence resonance energy transfer (FRET) signal can be observed in a nano-scale confined system of a lipid bilayer [16].
In spite of the various potential applications of QLCs, we still lack detailed knowledge and quantitative approaches regarding the interactions and dynamics between QDs and lipids during QLC formation. And there is still no reliable ex-perimental data regarding the exact position of QDs in the lipid bilayer. In this work, we assume that QDs are approximated as hydrophobic hard spherical par-ticles, and there are no specific interactions other than hydrophobic interactions. Therefore, QDs are spontaneously incorporated into the lipid bilayer of lipsomes during the self-assembly process due to strong hydrophobic interactions be-tween QDs and phospholipids in hydrophilic environment and are positional at the center of the lipid bilayer.
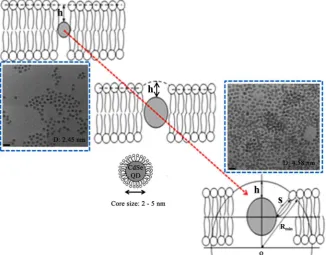
DOI: 10.4236/ojbiphy.2018.83012 165 Open Journal of Biophysics Figure 1. QD is embedded in the thin lipid bilayer depending on the size of QD. Box dotted line shows TEM image of CdSe-QD: left QD size D: 2.45 nm and right QD size D: 4.58 nm. This scale bar is about 10 (nm).
In the present work, however, we do detect a fluorescent signals from orange-emission QDs (~2 - 2.15 nm) and red-emission QDs (~2.5 nm) above critical QD size in the mixture of DOPC and DOPG. To interpret these experi-mental results, we propose a simple theoretical model based on geometric con-siderations of deformed lipid monolayer surrounding a QD in terms of the mo-lecular packing parameter and the conformational change of the lipid chain in-stead of complicated elastic free energy calculations. This model explains our experimental observation of shift of the specific QD size.
2. Background and Model
According to Israelachvili’s work [17], given the packing parameter P of a given lipid, the minimum radius Rmin of the special liposome is determined as
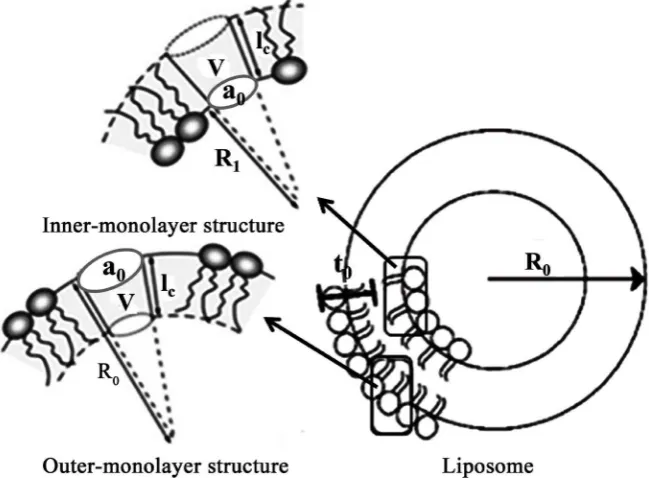
fol-low. Figure 2 shows a uni-bilayer liposome with the in-outer layer (R0) and the
outer layer thickness (t0) in a single liposome. For liposome of the outer layer
volume V0 and the outer surface area S0 with N0 molecules, there are
fol-lowing relations between them [18].
(
)
33
0 0 43π 0 0 0
V =N v= R − R t− (1)
2
0 4π 0 0
S = R =N a, 3
(
)
30 34 π 0 0 0
N R R t
v
= − − (2)
[image:3.595.211.538.75.330.2]DOI: 10.4236/ojbiphy.2018.83012 166 Open Journal of Biophysics Figure 2. Uni-bilayer liposome and inner and outer monolayer structures.
(
)
32 2 3
0 0 0 0 0 0
4π 3
a= R N = vR R − R t− (3)
Here, (a a≠ 0) is the actual area per head group. If Equation (3) is divided by
a0, the ratio of the actual area a to the optimal area a0 is given by
(
)
2 0
3 3
0 0 0 0 0
3 c
c
R
a v l
a a l R R t
=
− −
(4)
Here, a0 is referred to as the optimal surface area per molecule, defined at the hydrocarbon-water interface.
Equation (4) gives the area ratio as a function of the packing parameter (P v a l= 0c), the critical chain length (lc), the out radius (R0), and the thickness
of the outer layer (t0). If the packing parameter and critical chain length are
fixed, the ratio of the area to the optima head area (a a0) will approaches 1 with
a decrease of the out radius (R0). This condition approaches to the lower
possi-bility for liposome formation. When the minimum value of R0 is reached, the
smallest liposome can be formed. The out radius (R0) replace the value of Rmin,
we refers to t0=lc. Substituting a a0=1, and t0=lc, expressed as a formula
according to Rmin,
2 2 min min 0 1 0 3c c c l
v R l R
a l
− − + =
(5)
From Equation (5), the minimum radius is
(
)
(
)
min
3 3 1
6 1 c
P R
P l
+ −
=
DOI: 10.4236/ojbiphy.2018.83012 167 Open Journal of Biophysics Here, the packing parameter is P v a l= 0c.
For truly fluid hydrocarbon chains, meanwhile, the optimal head area should not depend strongly on the chain length or on the number of chains. We can de-fine the critical chain lc as the maximum effective length of the hydrocarbon
chain in the liquid state. The semi-empirical definition of the hydrocarbon chain length was theoretically interpreted by Israelachvili [17] Tanford [19] and Lindman [20]. lc for the saturated hydrocarbon chains is
(
)
max 0.154 0.1265 nm c
l ≤l = + n (7)
Here, lmax stands for the length of the fully extended hydrocarbon chain, and n is number of carbon atom for each hydrocarbon tail. However, as may be ex-pected, lc is of the same order as, though somewhat less than, the fully
ex-tended molecular length of the chain lmax. It can be seen that the minimum size
of a liposome (Rmin) depends on the packing parameter (P v a l= 0c) and on the
critical chain length (lc). Since v and lc are fixed, the only way to reduce the
packing parameter (v a lo c) is increasing the optimal head area (a0).
Modeling
The key point of this model would define the critical QD radius by limiting the
max
l to cover part of the void around the QD Smax at graph. For the definition
of Smax in this model, we considered only the size of QD core excluding ligand
(hexadecylamine).
Equation (6) shows the minimum possible radius Rmin of the spherical
lipo-some, which is composed of the lipids with the packing parameter P. We first assumed that the maximum possible curvature of the lipid monolayer with thickness d around the QD of radius r has its limit at the value 1Rmin to evade
any unfavorable surface energy penalties. In other words, Rmin is the critical
radius below which a bilayer cannot curve without introducing unfavourable packing strains such as QD inside the lipids. Therefore, when the size of each QD is smaller than Rmin, as in our experiment, the curvature of the monolayer
around the QD is approximated as 1Rmin , and the deformed monolayer profile
is a circular arc of radius as Rmin shown in Figure 4. In the case of Egg-PC
li-pid liposome, the packing parameter value is known to be 0.85 (v a l0c;
2 0 0.717 nm
a ≈ , v≈1.063 nm3 and 1.75 nm
c
l ≈ ) [17]. Therefore, we know that Rmin of Egg-PC liposome can get the value of 10.8 nm from Equation (6).
We can also introduce two parameters related to the conformational variation of the hydrocarbon chain around the QD: the compressing extent h of the hy-drocarbon chain and the maximum stretching extent S of the hydrocarbon chain in order to remove void formation around the QD. In the case of Egg-PC lipid, a saturated hydrocarbon chain is approximately composed of n = 18 of carbon number about 70%. When the number of carbon is n = 18, we defined
max 2.43 nm
l = form Equation (7). If S has only to contact with ligand, as shown
DOI: 10.4236/ojbiphy.2018.83012 168 Open Journal of Biophysics Figure 3. (a) A model representing the deformed monolayer due to the incorporation of a QD inside the lipid bilayer (b) A plot of chain length of the most stretched lipid, Smax as
a function of the QD radius, r; The dotted line corresponds to the minimum radius Rmin
of deformed lipid monolayer around QD.
located in a corner of the QD direction (point B in Figure 3(a)) to remove the void formation between lipid and QD. Here, we approximately considered the distance between point B and C as ligand length (~1 nm). For the maximum ex-tent, we can define Smax as 3.43 nm (the ligand length plus lmax). And we
as-sumed that the compression of the chain occurs at the top of the QD, as shown in Figure 3(a). In the case of maximum compression, the lipid monolayer thickness at point A is represented by hmin =1.22 nm from the Egg-liposome
thickness due to lmax=2.43 nm [21].
The distance S from the corner of the QD to the point on the circular arc of radius Rmin for a given θ can be expressed as
(
) (
2)
2minsin mincos min min 1
S= R θ−r + R θ−R +h + +r (8)
Equation (8) is differentiated with respect to θ to obtain the minimum Smax that is required to be equal to the chain length of the most stretched lipid among the lipids around the QD of radius r. Figure 3(b) shows a plot of Smax as a
function of the QD radius r. Smax can’t exceed the maximally stretched chain
length, ligand length (~1 nm) plus lmax, which is 3.43 nm in this case [17].
Oth-erwise, there would be a void formation at the ligand portion that is connected with corner of the QD. Therefore, the critical QD size is rcr≈1.8 nm, where the chain is maximally stretched to Smax (corresponding to the horizontal dashed
line in Figure 3(b)).
DOI: 10.4236/ojbiphy.2018.83012 169 Open Journal of Biophysics
3. Experimental Methods and Materials
3.1. Materials
In this experiment, we used four different kinds of lipid molecules:
L-α-phosphatidylcholine (Egg-Pc), 1,2-dioleoyl-sn-glycero-3-phosphocholine (DOPC), 1,2-dioleoyl-sn-glycero-3-[phospho-rac-(1-glycerol)] (DOPG), and 1,2-dipalmitoyl-sn-glycero-3-phosphocholine (DPPC), which were purchased from Avanti Polar Lipids. In the case of DOPC and DOPG, number of carbon atom for each hydrocarbon tail is n = 18 and DPPC is n = 16.
Before sample preparation, they were dissolved into chloroform at a deter-mined concentration. Deionized water was obtained from a Milli-Q plus 185 (Millipore, Molsheim, France) ultra-pure water system with a resistivity of ≥18 MΩ/cm. Five different sizes of hexadecylamine (~1 nm)-coated CdSe QDs dis-persed in toluene were purchased from Sigma-Aldrich. Each of them has a dif-ferent core radius; blue (~1.05 nm), green (~1.25 nm), yellow (~1.65 nm), orange (2.0 - 2.15 nm) and red-emission (~2.5 nm).
3.2. Preparation of QLC
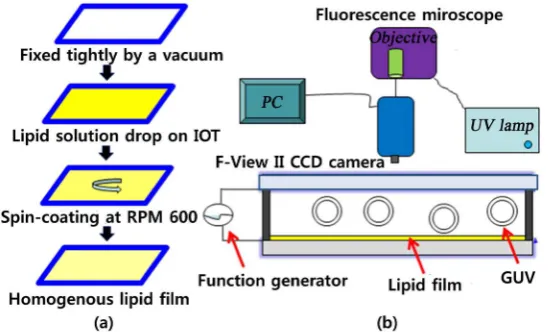
QLCs were synthesized by using the mixed solutions of QDs and phospholipids via the electroformation method [22] in conjunction with spin-coating tech-nique [23], as shown in Figure 4. Egg-PC (10 mg/1ml) and a mixture of DOPC lipid: DOPG lipid = 1: 1 (5 mg/1ml, molecular weight) and QD (5 mg/1ml) was prepared with the volume ratio of mixed DOPC and DOPG lipid solution:QD solution = 700 μl:25 μl. This well-mixed solution was deposited onto the ITO substrate, then spin-coated at 600 rpm for 100 s under a stream of nitrogen gas. This QD/lipid thin film was immediately dried out in a vacuum oven for 2 h to remove excess organic solvents. A home-made chamber for electroformation was built by combining two transparent conducting indium tin oxide (ITO) substrates (4 × 4 cm2, <50 Ω); one is clean and the other has a dried thin film
[image:7.595.238.514.514.680.2]DOI: 10.4236/ojbiphy.2018.83012 170 Open Journal of Biophysics with a spacer (~1 mm), then sealed with a vacuum grease (Dow Corning, High vacuum Grease). The chamber for was then filled with 2 ml of room-temperature deionized water. An AC signal of 10 Hz and 1.2 V (peak-to-peak) using a func-tion generator (model 33250 A, Agilent, USA) was applied to the chamber for 2 h. During this process, lipiosomes grew on the substrate. Then, the AC signal was set to 4 Hz and 2.0 V (peak-to-peak) for 10min to detach the liposomes from the substrate in order to make an easy observation on a confocal micro-scope (Axiovert 100 M, Zeiss, German).
4. Experimental Results and Discussions
4.1. Egg-PC QLC
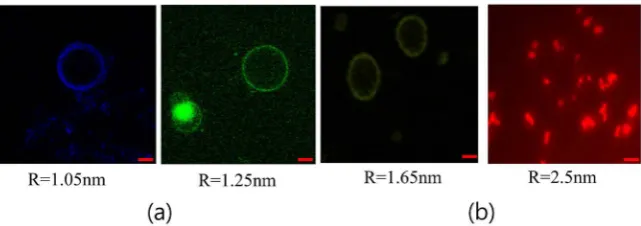
In order to checking this model, we checked over the QD size dependence for QD stabilization inside the lipid bilayer of liposome. The QLC is expected to be observed only for the QD size smaller than a certain specific size. We successful-ly obtained the blue-, green-and yellow-emission Egg-PC QLCs with clear and sharp fluorescent signals, as shown in Figure 5(a). However, when red-emission QDs were used with the same concentration as the blue-, green- and yel-low-emission QDs during the QLC preparation, we did not obtain the red-emission DOPC QLCs. Instead, we observed some aggregation kind of im-age, as shown in Figure 5(b). The results are similar to those of previous DOPC experiments [15].
It means that the aggregated several QDs prefer to be surrounded by lipid in-stead of QLC. In other words, red-emission QDs were not incorporated into the bilayer of liposome. The experimental results are supporting the predictions of our theoretical model.
We believe that, if the QD radius is larger than rcr, the QLC structure is no
longer stable due to the high energy cost in the formation of either the lipid vo-ids or increase of hydrophobic interface contacting with water, as shown in Fig-ure 6. It means that the mono-layer curvature of surrounding the QD is highly required to form the QLC. In other words, we consider that hydrocarbon chain
max
l of Egg-PC lipids is not long enough, wetting a void formation at the ligand
[image:8.595.216.537.556.669.2]DOI: 10.4236/ojbiphy.2018.83012 171 Open Journal of Biophysics Figure 6. The mono-layer deformation of positive curvature area in-duced CdSe surrounding by PC-type lipid.
portion that is connected with corner of the QD and the geometric shape of them don’t pack fully hydrophobic area deformed above rcr. As a result, the
QDs only below a certain specific size (core radius ≈ 1.8 nm) can stably reside in the lipid bilayer.
If lipids of large mono-layer curvature surrounding QD exist, they will reduce the deformation area and cover the void by highly curvature lipid. According to this model, rcr, the specific radius of QD, is affected by a change in the
mini-mum radius Rmin . In the case of Egg-PC lipid, the minimum of radius
(Rmin:10.8 nm) is given by Equation (6) and thus the maximum of radius
cur-vature is 1Rmin. For forming the QLC above rcr, it is necessary to use lipid
having large monolayer curvature more than 1Rmin . It is theoretically difficult
to reduce the curvature value of 1Rmin more than 1/10.8 nm−1 for a single lipid
molecule of the PC type.
According to the experimental result by Israelachvili [17], they have experi-mentally seen that it reduced the P≈0.37 (non-spherical micelle) to the
0.33
P≈ (spherical micelle) for sodium dodecyl sulphate surfactant (SDS) in water. Since ν and lc are fixed, the only way to reduce is to raise a0 by raising the pH of the solution. In practice, this could be achieved by increasing the pH of the solution. This would increase the degree of ionization of the negatively charged head-groups which increases the repulsion between them, resulting in an increase in a0. It means that the spherical micelle is more high curvature than non-spherical micelle. By Israelachvili’s experiment, in this study, we think that charged lipids (DOPG) with large optimal head area (a0) is able to from a highly mono-layer curvature more than 1Rmin by mixing the DOPC and DOPG.
4.2. DOPC/DOPG QLC
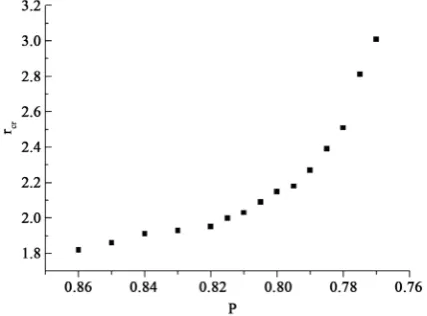
Figure 7 shows that rcr is changed by the reduction of P value. Figure 7 is not
a measured value but a calculated value by Figure 3(b), which the decrease of P resulted in the decrease of Rmin from Equation (6). The graph of Figure 3(b)
[image:9.595.249.498.70.226.2]DOI: 10.4236/ojbiphy.2018.83012 172 Open Journal of Biophysics Figure 7. The change of critical point rcr according to changing P.
right. In other words, the reduction of Rmin can cause high curvature. It means
that an increase in optimal head area (a0) results in highly curvature.
We seek to increase the large optimal head area (a0) to form a highly mono-layer curvature for checking the change of rcr. In this study, if v and lc
are fixed, the only way to reduce P v a l= 0c is to raise optimal head area (a0) by
using the DOPG. We have the following experiment to confirm the increase of
cr
r such as Figure 7.
As we mentioned earlier, QLC above rcr will be formed by mixing DOPG
with a charged heap-group and DOPC a neutral head-group for charge effect [17] [24].
We expected that this mixing would will be larger curvature than 1Rmin
be-cause of the increase of effective head-group area (ae0), which arises from the
repulsive interaction between the like-charged head-groups. It causes the geo-metry shape such as Figure 8(a). The phenomenon of effect head-group area explains as follows. For example, the micelle-forming lysolecithin (v a l0c<0.5)
and non-aggregate forming cholesterol (v a l0c>1.0) will mix in certain
propor-tions to form liposome (0.5<v a l0c <1). If we mix DOPC and DOPG, we will
expect that the mono-layer of the mixture of DOPC/DOPG lipids can form more a highly curvature mono-layer than Egg-PC mono-layer.
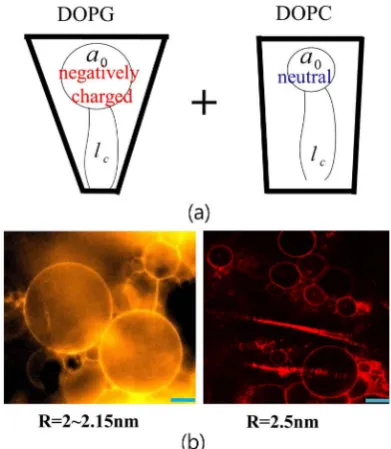
In this experiment, we observed the orange (radius; 2.0 - 2.15 nm) and red-emission QDs (radius ~2.5 nm) were successfully incorporated in the bilayer of the mixture of DOPC/DOPG lipids, as shown in Figure 8(b). This experi-ment result shows that the radius of curvature is increased by DOPG.
As we have anticipated the change of a specific point rcr, this experimental
result explains the increase in rcr by the increase of ae0 by charge effect.
4.3. DOPC/DPPC QLC
DOI: 10.4236/ojbiphy.2018.83012 173 Open Journal of Biophysics Figure 8. (a) Geometric shapes of DOPG (truncated shape) and DOPC (truncated shape close to cylindrical shape) at a0; (b) Confocal microscopy image of the QLCs prepared
with the same ratio of two lipids DOPC/DOPG (1:1) by using the orange and red-emission QDs (2 - 2.15 (nm) and ~2.5 (nm)). This scale bar is about 10 (μm).
Figure 9. QLC structure using DOPC/DPPC mixed lipid molecules in fluorescence mi-croscopy. This scale bar is about 50 (μm).
In conclusion, it can be expected that the role of charge effect at the head-group is an important factor to form QLC structure above the specific QD size. In this study, unlike previous experimental results, we can observe the orange and red-emission QLC due to highly curvature mono-layer.
5. Conclusion
[image:11.595.249.501.372.510.2]DOI: 10.4236/ojbiphy.2018.83012 174 Open Journal of Biophysics ~1.05 nm, 1.25 nm and 1.65 nm) but not with red-emission QDs (core radius ~2.5 nm). When DOPG lipids, which have a larger head group area, were mixed with DOPC lipids, QLCs were formed with orange-emission QDs as well as with red-emission QDs. The model predicts that 1) QDs below a certain critical size can stably reside in the lipid bilayer, and 2) the specific QD size increases as the head group area of the lipids increases. These predictions agree well with our experimental results in spite of a lack of exact information about the change of effect optimal head area and the conformational changes of the hydrocarbon chain around the QD.
Acknowledgements
This work was supported by a Research Institute for Convergence of Biomedical Science and Technology (30-2018-007), Pusan National University Yang-san Hospital.
References
[1] Park, J., Joo, J., Kwon, S.G., Jang, Y. and Hyeon, T. (2007) Synthesis of Monodis-perse Spherical Nanocrystals. Angewandte Chemie International Edition, 46, 4630-4660.https://doi.org/10.1002/anie.200603148
[2] Dubertret, B., Skourides, P., Norris, D.J., Noireaux, V., Brivanlou, A.H. and Lib-chaber, A. (2002) In Vivo Image of Quantum Dots Encapsulation in Phospholipid Micelles. Science, 298 1759-1762.https://doi.org/10.1126/science.1077194
[3] Fan, H., Leve, E.W., Scullin, C., Gabaldon, J., Tallant, D., Bunge, S., Boyle, T., Wil-son, M.C. and Brinker, C.J. (2005) Surfactant-Assisted Synthesis of Water-Soluble and Biocompatible Quantum Dot Micelles. Nano Letters, 5, 645-648.
https://doi.org/10.1021/nl050017l
[4] Park, S.H., Oh, S.G., Mun, J.Y. and Han, S.S. (2006) Loading of Gold Nanoparticles inside the DPPC Bilayers of Liposome and Their Effects on Membrane Fluidities.
Colloids and Surfaces B: Biointerfaces, 48, 112-118.
https://doi.org/10.1016/j.colsurfb.2006.01.006
[5] Bothun, G.D., Rabideau, A.E. and Stoner, M.A. (2009) Hepatoma Cell Uptake of Cationic Multifluorescent Quantum Dot Liposomes. Journal of Physical Chemistry Letters B, 113, 7725-7728.https://doi.org/10.1021/jp9017458
[6] Chen, Y., Bose, A. and Bothun, G.D. (2010) Controlled Release from Bilayer-Decorated Magnetoloposomes via Electromagnetic Heating. ACS Nano, 4, 3215-3221.
https://doi.org/10.1021/nn100274v
[7] Al-Jamal, W.T., Al-Jamal, K.T., Tian, B., Lacerda, L., Bomans, P.H., Frederik. P.M. and Kostarelos, K. (2008) Lipid-Quantum Dot bilayer Vesicles Enhance Tumor Cell Uptake and Retention in Vitro and in Vivo. ACS Nano, 2, 408-418.
https://doi.org/10.1021/nn700176a
[8] Binder, W.H., Sachsenhofer, R., Farnik, D. and Blaas, D. (2007) Guiding the Loca-tion of Nanoparticles into Vesicular Structures: A Morphological Study. Physical Chemistry Chemical Physics, 9, 6435-6441.https://doi.org/10.1039/b711470m
DOI: 10.4236/ojbiphy.2018.83012 175 Open Journal of Biophysics
[10] Zheng, W.W., Liu, Y., West, A., Schuler, E.E., Yehl, K., Dyer, R.B., Kindt, J.T. and Salaita, K. (2014) Quantum Dots Encapsulated within Phospholipid Membrane: Phase-Dependent Structure, Photostability, and Site-Selective Functionalization.
Journal of the American Chemical Society, 136, 1992-1999.
https://doi.org/10.1021/ja411339f
[11] Nandi, S., Malishev, R., Bhunia, S.K., Kolusheva, S., Jopp, J. and Jelinek, R. (2016) Lipid-Bilayer Dynamics Probed by a Carbon Dot-Phospholipid Conjugate. Bio-physical Journal, 110, 2016-2025. https://doi.org/10.1016/j.bpj.2016.04.005
[12] Gopalakrishnan, G., Danelon, C., Izewska, P., Prummer, M., Bolinger, P.Y., Geiss-buhler, I., Demurtas, D., Dubochet, J. and Vogel, H. (2006) Multifunctional Li-pid/Quantum Dot Hybrid Nanocontainers for Controlled Targeting of Live Cells.
Angewandte Chemie International Edition, 45, 5478-5483.
[13] Wi, H.S., Lee, K. and Pak, H.K. (2008) Interfacial Energy Consideration in the Or-ganization of a Quantum Dot-Lipid Mixed System. Journal of Physics: Condensed Matter, 20, Article ID: 494211. https://doi.org/10.1088/0953-8984/20/49/494211
[14] Daniel, M. and Reznickova, J. (2014) Energy of Quantum Dots Encapsulated in Bi-ological Membrane. Procedia Engineering, 79, 137-142.
https://doi.org/10.1016/j.proeng.2014.06.322
[15] Wi, H.S., Kim, S.J., Lee, K., Kim, S.M., Yang, H.S. and Pak, H.K. (2012) Incorpora-tion of Quantum Dots into the Lipid Bilayer of Giant Unilamellar Vesicles and Its Stability. Colloids and Surfaces B: Biointerfaces, 97, 37-42.
https://doi.org/10.1016/j.colsurfb.2012.04.025
[16] Kloepfer, J.A., Cohen, N. and Nadeau, J.L. (2004) FRET between CdSe Quantum Dots in Lipid Vesicle and Water- and Lipid-Soluble Dyes. The Journal of Physical Chemistry B, 108, 17042-17049. https://doi.org/10.1021/jp048094c
[17] Israelachvili, J. (1998) Intermolecular and Surface Forces. Harcourt Brace & Com-pany, New York.
[18] Segota, S. and Tezak, D. (2006) Spontaneous Formation of Vesicles. Advances in Colloid and Interface Science, 121, 51-75. https://doi.org/10.1016/j.cis.2006.01.002
[19] Tanford, C. (1972) Micelle Shape and Size. The Journal of Physical Chemistry, 76, 3020-3024. https://doi.org/10.1021/j100665a018
[20] Holmberg, K., Joensson, B., Kronberg, B. and Lindman, B. (2002) Surfactants and Polymers in Aqueous Solution. John Wiley & Sons, New York.
[21] Li, X.-J. and Schick, M. (2008) Theory of Lipid Polymorphism: Application to Phosphatidylethanolamine and Phosphatidylserine. Biophysical Journal, 78, 34-46.
https://doi.org/10.1016/S0006-3495(00)76570-2
[22] Angelova, M.I. and Dimitrov, D.S. (1986) Liposome Electroformation. Faraday Discussions of the Chemical Society,81, 303-311.
https://doi.org/10.1039/dc9868100303
[23] Estes, D.J. and Mayer, M. (2005) Electroformation of Giant Liposomes from Spin-Coated Films of Lipids. Colloids and Surfaces B: Biointerfaces, 42, 115-123.
https://doi.org/10.1016/j.colsurfb.2005.01.016
[24] Ninham, B.W. and Evans, D.F. (1986) The Rideal Lecture. Vesicles and Molecular Forces. Faraday Discussions of the Chemical Society, 81, 1-17.