http://dx.doi.org/10.4236/eng.2012.47048 Published Online July 2012 (http://www.SciRP.org/journal/eng)
Multi-Objective Optimization of Multi-Agent Elevator
Group Control System Based on Real-Time Particle
Swarm Optimization Algorithm
Yanwu Gu
School of Electronics & Information Engineering, Tongji University, Shanghai, China Email: [email protected]
Received April 19, 2012; revised May 10, 2012; accepted May 20,2012
ABSTRACT
In order to get a globally optimized solution for the Elevator Group Control System (EGCS) scheduling problem, an algorithm with an overall optimization function is needed. In this study, Real-time Particle Swarm Optimization (RPSO) is proposed to find an optimal solution to the EGCS scheduling problem. Different traffic patterns and controller mechanisms for EGCS are analyzed. This study focuses on up-peak traffic because of its critical importance to modern office buildings. Simulation results show that EGCS based on Multi-Agent Systems (MAS) using RPSO gives good results for up-peak EGCS scheduling problem. Besides, the elevator real-time scheduling and re-allocation functions are realized based on RPSO in case new information is available or the elevator becomes busy because it is unavailable or full. This study contributes a new scheduling algorithm for EGCS, and expands the application of PSO.
Keywords: Multi-Agent System; Elevator Group Control System; Real-Time Particle Swarm Optimization; Up-Peak
Traffic
1. Introduction
More than one elevator is installed in buildings to satisfy the need for carrying people and other items between floors. This creates challenges in cooperation and utiliza- tion between many elevators, leading to a scheduling problem. Proper scheduling can improve running effici- ency of the multiple elevators, collectively called the Ele- vator Group Control System (EGCS). Elevator Group Control (EGC) is a special type of planning and schedul- ing task. Scheduling in EGCS is a complex task because of a lot of unknown factors [1,2], a relatively big state space for a solution, and a huge number of constraints. This is mainly because scheduling of elevators needs to be done in such a way as to minimize unnecessary stops while dropping off and picking up passengers. Seckinger and Koehler prove this task to be NP-hard [3].
Recently, this topic has been studied extensively and many algorithms have been applied to the EGCS tech- nology. Kim et al. [4] propose applying control theory of Fuzzy Logic (FL) to the EGCS. But Fuzzy Logic cannot self-study. Since the system cannot be aware of all its states, dynamic real-time control is hard to attain. Zhu et al. [5] use Neural Networks (NN) to optimize EGCS, but because of the slow learning speed of NNs, the global optimized solution is hard to find. In addition, NNs have the tendency to be entrapped in the local best value, which causes the local optimized value to be wrongly
reported as the global best. Imasaki et al. [6] use Fuzzy Neural Network (FNN), which overcome problems ex- isting in Fuzzy Logic and Neural Networks, but the task re-allocation function is not realized.
In real-time, there is a lot of uncertainty, and the EGCS cannot rely only on scheduling, but also needs re- allocation. Whenever a car call or new hall call is made, new information is incorporated into the decision-making process to select an elevator car. This information may include measurable quantities such current position of cars, or unknown values such as delay times of cars ser- vicing any hall calls as passengers get off. In addition, re-allocation is needed in case an elevator becomes busy. An elevator may become full because no new passenger can enter it due to the car’s space being all taken by other passengers. It may also become full because the maxi- mum weight capacity of the car has been reached. Tech- nical issues may also lead to an elevator car becoming unavailable. Section 3.3 is dedicated to explaining how re-allocation is done in RPSO if these situations happen.
2. Problem Description and Performance
Indicies
2.1. Background
people come and go for work [7]. Depending on the con-figurations of the office building, lunch times can also result in peak traffic [8]. Also, the nature of the building gives an indication of the expected traffic patterns for these peak hours [8,9].
For instance, in office buildings, many people arrive to get to their respective work floors, causing up-peak traf- fic. In apartment buildings, many people leaving their apartment rooms for work leads to down-peak traffic. This study focuses on office buildings and investigates up-peak traffic because of its critical importance [10]. However, for sake of comparison, we also investigate other traffic modes. Section 4.4 is dedicated to proposing possible reasons for why different patterns can lead to different results for the same algorithm.
Analysis about why RPSO outperforms other algo- rithms in this study is also provided. Normally, a realistic building’s traffic pattern is a combination of the three. However, based on the nature of the building, one traffic pattern may be predominant at a particular time of day [7, 9]. Also, the simulation is set up such that the passen- gers’ arrival time follows a Poisson Distribution [10,11], shown as follows:
;
!
ne n
f n
n
(1)
where n is the number of passengers arriving λ = μI,μ is mean of distribution and I = time interval
Expectedly, the same algorithm gives different results for different traffic patterns. For the purposes of the simulation, the chosen traffic pattern has much more im-pact on the performance of elevators than the algorithm [10]. Consequently, all three traffic patterns are used in the simulation for comparison.
2.2. Centralized EGCS and EGCS Based on MAS
EGC is a class of the multi-objective dynamic scheduling problem, but with high complexity and real-time require- ments. The EGCS is taking a group of elevators as an organic unit using one controller to cooperate and sche- dule running of each elevator car. Its objective is to im- prove running efficiency and service quality by serving passengers in a shorter Waiting Time (WT) and Riding Time (RT), and reduce the overall cost of the EGCS. The EGCS controller includes single elevator controllers and the EGCS group controller. The single elevator controller normally controls logic performance of a single elevator, while EGCS group controller optimizes and schedules running of each elevator. The centralized ECGS model is called Centralized Multi-objective Optimization (CMO) model.
The present EGC methods are mostly centralized, where the group controller is responsible for assigning a
car. But with increasingly complex patterns in passenger traffic, workload of the group controller becomes the bottleneck in the optimization of the EGC problem. Koe- hler and Ottiger [12] introduce MAS into EGCS, where each single elevator controller offers a quote, and the quotes are compared to see which one out-performs the others. In a sense, this reduces the workload of the group controller, which is helpful in optimization of the EGC problem. The final decision about task assignments is made by EGCS group controller. So it is a multi-agent EGCS. Multi-agent EGCS is composed of multiple agents, namely elevator car, group controller, and a vir- tual management unit, so it is also MAS. Multi-agent ECGS is also referred to as Multi-Agent Multi-objective Optimization (MAMO) model.
MAMO is performing tasks in a divide-and-conquer manner. Thus, it is equivalent to the feedback control mechanism proposed by Qin et al. [13] for balancing workload. The feedback control mechanism automati- cally adjusts the use of resources depending on the speed of processing. The mechanism uses three components: feedback controller, resource sharing controller, and load balancer.
The load balancing scheme in MAMO is the cost func- tion. The cost function depends on the availability of the elevators, and the distribution of elevator utilization is equivalent to the load balancing scheme. Availability de- pends on the number of elevators that are free to be allo- cated and scheduled. The feedback controller is equiva- lent to the single elevator controller, which sends its cost quote to the group controller. Also, the resource sharing controller in MAMO is the group controller. This is be- cause the group controller ensures that elevator cars are being used efficiently.
Because EGCS based on MAS introduces the concept of multiple controllers, more than one agent is forming an answer-seeking network by cooperation. Multi-perfor- mance indices are maximally optimized by task break- down and cooperation. At present, the MAS theory and technique is used in a wide range of areas to solve some problems that cannot be solved normally (i.e. NP-Hard problems) or are not so easily solved by other algorithms.
2.3. Multi-Objective Optimization
Minimize F(x) = [F1(g1), F2(g2), …Fp(gp)]T , where Fi(x)
represents one out of p possible solutions to the starting problem F(x) with respect to gi = [y1, y2, …, yq]T . Here, yj
represents one performance index in q performance indi-ces.
2.4. Performance Indices
For the purpose of this study, the performance indices used for EGCS are Average Waiting Time (AWT), Stan-dard Deviation of Waiting Time (STDwt), Average RT
(ART), Standard Deviation of RT (STDrt), Distribution of
Elevator Utilization (DEU), Standard Deviation of Ele- vator Utilization (STDeu), Distribution of Passenger
Waiting Time, Long Waiting Rate, and Distribution of Long Waiting Time. These 9 performance indices in total are used to judge the EGCS experiments. The criterion for optimization is a combination of these indices; mainly, the objective function is a combination of WT and RT. The other indices are used in subsequent auxiliary ob- servations to analyse optimization.
Waiting Time (WT) refers to the time measured from when a passenger makes a hall call request to use an ele- vator till the time an elevator comes to the passenger’s floor to be available for service, and it is observed that the WT distribution roughly follows Exponential Distri- bution [8,10]. While Standard Deviation of WT, STDwt
shows how much variation of passengers’ WT there is from the average WT, and is computed as follows:
2 2 1 1 2 ( ) n n i i wt wt
n wt i wt i
STD n
(2)RT (RT) refers to the time period starting from passen- gers’ entering the elevator car till they leave the car, and it is observed that the RT roughly follows Gamma Dis- tribution [10]. Standard Deviation of RT, STDrt is a re-
flection of fluctuation for passengers’ RT from the aver- age RT. It shows degree of dispersion of passengers’ RT:
2 2 1 1 2 ( ) n n i i rt rt
n rt i rt i
STD
n
(3)Studies involving surveys of passengers waiting for elevators have shown that passengers start getting impa- tient after 17 seconds, and considerably agitated after 35 seconds. Considering passengers’ impatient mentality, the situation may change dramatically after their WT rea- ches 1 minute, i.e. 60 seconds. Researchers hope to con- trol WT to be much less than 60 seconds for EGCS. The ratio between number of passengers’ whose WT is longer than 60 seconds and total number of passengers is called Long Waiting Rate (LWR):
( )
( ) 60LWR N wt i wt i
n
(4)
Whether all elevators can be fully used is an obvious reflection of the effectiveness of an intelligent algorithm for EGCS. Elevator Utilization is counted as the number of times each elevator is being used. If Ei is the ith ele- vator, i = 1, ···, 8, then N(Ei) represents the number of
times the ith elevator is involved in a car call. Standard Deviation of Elevator Utilization, STDeu is used to show
the degree of dispersion of elevators being used. The smaller the dispersion is, more evenly and fully the ele- vators are being scheduled, and the higher the elevator’s utilization ratio is:
22 1 2 n i i i eu eu
n N E N E
STD
n
(7)Considering that passengers’ mentality changes within or longer than 60 seconds, they are counted respectively. For passengers with WT within 60 seconds, passengers’ Distribution of WT is divided into 010 s, 1120 s, 2130 s, 3140 s, 4150 s, 5160 s, 60 s+, 7 spans to count. For those whose WT is longer than 60 s, Distribution of Long WT time is divided into 6165 s, 6670 s, 7175 s, 7680 s, 8185 s, 8690 s, 9195 s, 96,100 s, 101,105 s, 106,110 s, 111,115 s, 116,120 s, 120 s+, 13 spans totally.
3. RPSO Algorithm Description
3.1. Particle Swarm Optimization (PSO)
PSO is a heuristic and stochastic technique that is useful in optimizing nonlinear functions and related problems [14]. However, with basic PSO, finding the globally op-timized solution for some problems is less accurate, and often the local best solution is reported as the global best. Shi et al. introduced inertia weight into the original PSO in 1998, which show a significant and effective impact on the original PSO.
3.2. Real-Time PSO (RPSO)
The PSO algorithm provides a means to approximate large-scale NP-Hard problems. However, the require- ments of EGCS are to quickly decide on an elevator for a hall call or a car call. This decision is pertinent in both scheduling and re-allocation. For car allocations, perfor- mance needs to be optimized by making decisions based on real-time information about all cars, passengers, and requests. This is also true for car re-allocations that need to be made if an allocated car becomes busy, given the dynamic nature of the system.
tor to service their request. In addition, the time taken for auxiliary events to complete also needs to be factored in, such as car traveling speed, doors opening, etc. Surveys conducted put this threshold at less than 35 seconds wait time [15]. Consequently, EGCS scheduling can be seen as a soft task. The applicability of PSO to these real-time requirements is investigated. Two situations are a major concern: 1) Size of problem set, and 2) Efficiency gains by using PSO.
1) Size of problem set: Given that PSO is meant to
deal with huge problems, it is important to determine if this is still true when working with EGCS. It is deter- mined that the choice of which elevator car to use for servicing hall calls or car calls is non-trivial. This can be proven in the following way: If there are n passengers waiting for an elevator car and melevator cars in a build-ing, each elevator car as mi, where i = 1, 2, ···, e, and e is
the total number of elevator cars installed in the building.
A(mi) represents the availability of an elevator car, i.e.
whether the elevator care is busy or free to be scheduled.
m0 is the number of elevator cars that are actually avail- able at the moment.
There are many factors that affect the availability of a car. An elevator car may be serving other passengers on a floor that is very far from where the call is made. So it would be inefficient to assume that all elevator cars are equally available. Therefore, it can be stated that m0 _ m. In addition, C(mi) is a cost function for selecting the
cur-rent best elevator to serve a car call. The choice of ele-vator depends on various MO criteria, such as which elevator is able to get to the needed floor fastest, or minimizing WTs, and so on.
The calculation of which elevator will be best is based on a fitness value associated with each elevator. For in- stance, available elevators that are more floors away from where the car is made will tend to be relatively slower to those who are nearer. EGCS needs to optimize both A(mi) and C(mi) for all of n passengers who want to
use an elevator. Various parameters such as WT, RT, etc. need to be optimized which are related to A(mi) and
C(mi). So doing all this is not a trivial task.
2) Efficiency gains by using PSO: After various si-
mulated experiments, results showed that RPSO signifi- cantly improves the parameters that needed to be opti- mized. For instance, with RPSO implementation, the average WTs reduce significantly.
In EGCS, PSO is used as follows. An elevator is equivalent to a particle and each particle has three attri- butes: Position, Cost Function and Velocity. The ID of potential appointed elevator is used as Position attribute, namely initial solution. The elevator’s cost of finishing a job is used as the Cost Function attribute, and Velocity attribute as the running speed of the particle.
A flock contains a subgroup of elevators that are arbi-
trarily selected. The flock is dynamically generated for each iteration. From among this subgroup, an elevator can then be selected as a candidate solution by compar- ing the fitness criteria against its cost value. Each flock gets pBest by comparing the value from the cost function. Depending on the flock size, the pBest values are deter- mined for random particles by iteration. The iteration terminates when a threshold is reached, and the best of pBests is the final solution, gBest. EGCS involves a dy- namic scheduling problem.
Every time when a new job comes, the elevator group controller will use our PSO algorithm to optimize the solution set, which means it computes and figures out the optimized solution. So the algorithm proposed not only has a real-time function, but also fulfills the task re-al-location function, thus this method is called RPSO. After repeated experiments, it is found that RPSO can remark- ably improve system performance indices to be opti- mized. Average WT and dispersion of elevators’ utiliza- tion all reduced prominently.
Random sampling is used to select sample solutions using the flock as the population. The random sampling strategy used is sampling without replacement. In this strategy, the uniqueness of the randomly generated num- bers is assured within a pre-determined block size.
Let P = range of numbers to be generated,
B = block of random numbers, corresponding to flock size.
The numbers from P are randomly selected into B. However, the selected number is not replaced within P until the desired size of B is reached. After that, all num- bers within P are available for random selection once again.
During algorithm debugging, it is found out that ran- dom numbers have repeating phenomenon. So a custom random number generator is designed, which can gener- ate unrepeated random numbers in a fixed step length. In the Generator, if the number of required unique items is 4, then the random numbers generated wound not be re- peated in step length of 4. There would not be repeated solutions when flock size equals to 4, i.e. “2, 3, 1, 3”. So RPSO can get gBest faster by avoiding repeated compu- tation.
3.3. Objective Function and Elevator Re-Allocation
1 cur 2 cur V WT RT 3LI
where WTcur, Current WT and RTcur, Current RT are
re-lated to destination floors for the elevator to finish its current task, and the number of tasks for the elevator LI,
Load Index = Current weight/Maximum allowed weight And i,i1, 2,3 are weighting coefficients, with
3
1
1
i i
. [image:5.595.325.522.86.216.2]PSO might be useful to solve big problems, but it can be used to get a solution in real time also. It is demon- strated that real time processing is non-trivial. Later on it is also demonstrated that there are significant improve- ments in the desired results when using the RPSO strat- egy.
Figure 1 shows the realization of real-time elevator
re-allocation function in case the elevator is busy or full. It should be noted that re-allocation is attempted until an elevator is free. Given that the number of passengers and calls made is finite, there is a certainty that this exit con- dition will be reached eventually.
When a passenger arrives, the EGCS controller uses RPSO to decide which elevator to use to serve the pas- senger. This is the real-time control aspect. However, since this is in real time, it is possible that the selected elevator is already busy. If the potential elevator is busy, then the controller needs to again select another elevator using RPSO. This demonstrates the re-allocation function. The loop lasts till all the passengers are transported to their desired floors.
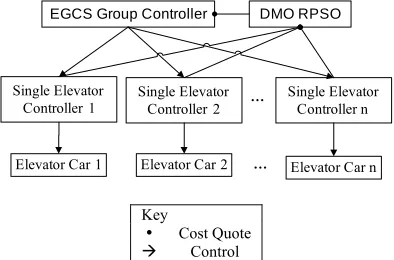
3.4. Multi-Agent EGCS Based on RPSO
EGCS based on a multi-agent system is shown in Figure 2.
Start
C=1
Passenger C arrives
Is elevator ec busy?
Increment C
Is C= Num_passengers?
End
No
No
Yes
Allocate elevator ec using RPSO
[image:5.595.87.237.512.719.2]Yes
Figure 1. Elevator allocation and re-allocation using RPSO.
EGCS Group Controller
Single Elevator Controller 2 …
Single Elevator Controller n Single Elevator
Controller 1
DMO RPSO
Elevator Car 1 Elevator Car 2 … Elevator Car n
Key
Cost Quote
Control
Figure 2. Using RPSO in multi-agent eGCS.
In an optimized multi-agent EGCS based on RPSO, each elevator has its own controller. Every controller carries on computing by a divide-and-conquer approach to the solution space, eventually leading to a quote of its own cost. In the group controller, the cost function de- pends on each subcontroller’s quotation. This quotation is used to set the particles’ cost attribute. In MAMO with RPSO (MAMO-RPSO), the pBest is found by iterating through randomly selected particles in the group control- ler. The best value from all the pBest values is the final solution, gBest. Once the gBest is gotten, the elevator car ID that is optimal for finishing the task assignment is selected. The main difference in MAMO-RPSO is the location of the cost computations. As shown in Figure 2,
each controller sends its cost quote to the algorithm. Then the group controller eventually decides which ele- vator car to move based on the results of MAMO-RPSO. Since the computation is distributed across multiple agents, the solution space within each sub-controller is smaller, leading to an overall faster computation. This is different from CMO using RPSO (CMO-RPSO), where the group controller does two things: compute cost of each controller, and also send the controlling signals. In CMO-RPSO, swarm optimization is used in the cost computation and comparison aspect. Possible solutions available to the central controller are represented as groups of particles randomly selected and grouped as a sub-set of the larger solution set, i.e. flock. The entire solution set is represented as a collection of these poten- tially overlapping sub-sets as a swarm. With MAMO- RPSO, there is division of labour between Control and Cost Quote. This allows the solution space to be tackled in smaller sub-sets, consequently speeding up the EGCS scheduling.
not as popular as centralized control in practice. Our ap- proach promises to improve the baseline efficiency of distributed controllers by real-time load sharing and re- allocation mechanisms via RPSO.
not constant, so the successive assigning of passengers to elevators is not linear. Secondly, the passengers’ selec- tion of destination floors is not sequential or linear, lead- ing to accumulation of passengers waiting for service and adding to the load. Thirdly, which car will be utilized depends on which floors are served in the meantime. Consequently, even though the cars are filled to capacity, the controller’s workload is high because of the current position of the elevator cars versus the uneven arrivals of passengers coupled with non-sequential selection of des- tination floors. Also, the simulation uses peak traffic with ArR of about 41 passengers per minute.
4. Simulation
4.1. Simulation Parameters
The experiments simulate dynamic elevators operating in a realistic building. It is assumed that no passenger pressed the wrong button, either by mistake or on pur- pose. In addition, the building is modeled under the as- sumptions of an office building. Also, the speed of the elevator car is assumed as constant, going from stop state at 0 m/s to 2.5 m/s, ignoring acceleration and decelera- tion. All traffic patterns, up-peak, down-peak and inter- floor traffic are taken as simulation objects.
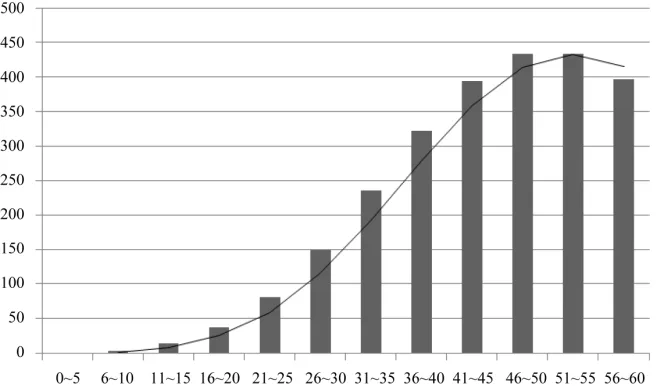
The elevator traffic flow generator essentially gener- ates arbitrary sequences of passengers making hall and car calls. By varying the Generator’s settings for per- centage of passengers going up, down, or between floors, different patterns are generated. The distribution of up- peak traffic flow is shown in Figure 3 as an example:
Up-peak traffic: 90% are going up, 5% as inter-floor
and 5% as down traffic; Meanwhile, parameters of the elevators and RPSO are as follows, based on [17]:
Inter-floor traffic: 5% are going up, 90% as inter-
floor and 5% as down traffic; Total number of elevators: n = 8
Elevators’ maximum carrying capacity: Max = 1000 kg
Down-peak traffic: 5% are going up, 5% as inter- floor and 90% as down traffic.
All patterns’ passenger creation time is a Poisson Dis- tribution with mean = 6 [16]. A traffic flow with 2500 passengers coming in 60 minutes is generated using an Elevator Traffic Flow Generator. With a floor height of 2.3 m and a velocity of 2.5 m/s, each car would take ap- proximately 15 s to travel from the ground floor to the 16th floor. Within this time, approximately 10 passengers may have arrived. Given that this is a non-linear dynamic system, in order to test the algorithms thoroughly, a heavy traffic load is generated for the controller using the Poisson distribution.
Firstly, the rate of the number of passengers arriving is
Elevator’s running speed: v = 2.5 m/s Total number of floors: Q = 16 floors Height of each floor: h = 2.3 m
Passengers’ Arrival Rate (ArR): 125 p/3 mins
4.2. Experiment Setup
[image:6.595.135.463.524.717.2]Koehler and Ottiger [12] suggest using a multi-agent mo- de for EGCS. The experiments carried out in this study are as follows. First, the ideas synthesized by Wang et al. are implemented as CMO and MAMO. Then RPSO is introduced and implemented as CMO-RPSO and MAMO- RPSO. PSO is applied to CMO and MAMO by adapting
the way cost computations and comparisons are made by the central or multi-agent controller respectively. Instead of the controller making a decision on the entire solution space, swarm optimization allows iterating through sub- sets of the solution space till a threshold is reached lead- ing to an optimal cost quote. Comparative studies be- tween these two implementations’ simulation results for all traffic patterns are then done. In this way, the effec- tiveness of one algorithm over the other could be quanti- fied for all traffic situations, especially the critical up- peak scenario.
4.3. Simulation Result
RPSO is used to optimize EGCS. Statistics are presented as follows. The various performance indices mentioned are shown for MAMO, CMO, MAMO-RPSO and CMO- RPSO.
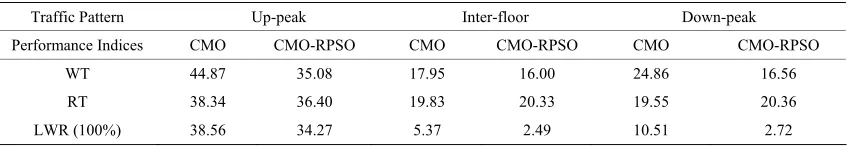
A general way to compare the efficiency of elevator group scheduling is to use average WTs and RTs. Table 1 shows comparisons for CMO and CMO-RPSO for
three traffic patterns.
We can see from Table 1 that it is possible to use an
algorithm to get different results because of different tra- ffic patterns. Normally, inter-floor gives the best result of the three, no matter what the algorithm is, and down- peak traffic gives better performance than up-peak traffic. But RPSO optimizes them no matter what the traffic pat- tern is. Nevertheless, the up-peak situation is more criti- cal to the traffic flow of office buildings. Besides, it is observed that the WT distribution roughly follows Expo- nential Distribution, and RT roughly follows Gamma Distribution.
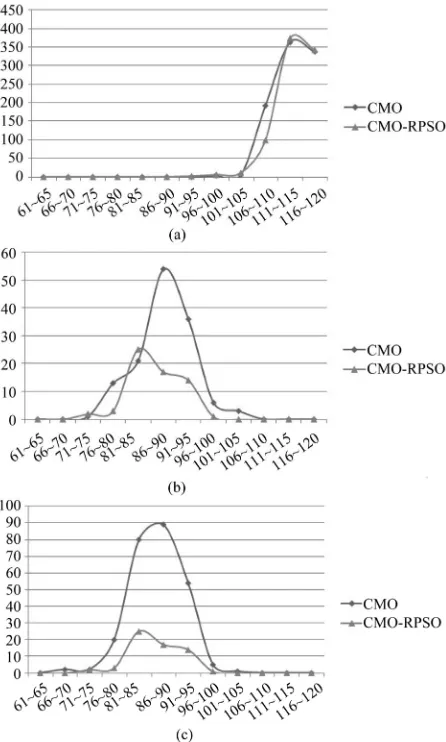
Next, distributions of long WT for three traffic pat-
terns with CMO and CMO-RPSO algorithms are pre- sented in Figure 4. The x-axis for each sub-figure repre-
sents passengers’ long WT, and y axis shows the number of passengers in each time span. It can be seen that the introduction of RPSO reduces the long WT for the three traffic situations. In addition, as expected, the algorithm gives different results for different traffic patterns, shown by the peaks depicting the maximum long WT recorded for each traffic pattern.
Since morning up-peak traffic is a critical traffic situa- tion in office buildings, a more detailed comparison for up-peak traffic pattern for the different algorithms is shown. Table 2 shows the results of WT and RT for
up-peak traffic with CMO, MAMO, CMO-RPSO and MAMO-RPSO algorithms. Also, some auxiliary results are shown, such as Standard Deviation (StdDev), and LWR.
It is clear from Table 2 that because of the introduc-
[image:7.595.87.512.521.594.2]tion of RPSO, the main performance index, WT, is re- duced dramatically. When RPSO is introduced into multi-agent EGCS, the simulation results aer even better. Again simulation results show how efficient the MAS is. The cooperation of multi-agents not only optimizes pas- sengers’ WT but also the degree of deviation in the WT. The MAS system performs better than the centralized system, as shown by the indices. For example, MAMO- RPSO reduces the WT of passengers by almost 50% compared with CMO-RPSO. In addition, the deviation of WT is 52% less with MAMO-RPSO, showing more con- sistent reduction in WTs per passenger. The results shown here are based on averaging. Meanwhile, the Standard Error of Mean (SEM) of WT is useful in predicting its consistence CMO and MAMO will perform in other ad- ditional situations. CMO-RPSO has SEMwt of 0.6868,
Table 1. Simulation result of CMO and CMO-RPSO for three traffic patterns.
Traffic Pattern Up-peak Inter-floor Down-peak
Performance Indices CMO CMO-RPSO CMO CMO-RPSO CMO CMO-RPSO
WT 44.87 35.08 17.95 16.00 24.86 16.56
RT 38.34 36.40 19.83 20.33 19.55 20.36
[image:7.595.84.511.621.735.2]LWR (100%) 38.56 34.27 5.37 2.49 10.51 2.72
Table 2. The results of WT and RT for up-peak traffic.
Performance Indices CMO MAMO CMO-RPSO MAMO-RPSO
WT 44.87 40.56 35.08 17.44
StdDev of WT 46.48 42.02 34.34 16.60
RT 38.34 38.30 36.40 35.40
StdDev of RT 18.92 18.67 18.99 17.92
WT + RT 83.21 78.87 71.49 52.84
StdDev of WT + RT 55.03 50.98 44.16 29.39
Figure 4. Distributions of long WT for three traffic patterns. (a) Up-peak; (b) Inter-floor; (c) Down-peak.
while MAMO-RPSO has 0.3320. This shows that MAMO- RPSO will give more consistently better results. The number of passengers whose WT is longer than 60 se- conds is reduced substantially also, and LWR is reduced from 34% to a quarter of 1%, which is a huge improve- ment.
Distribution of up-peak passengers’ WT is shown in
Figure 5.
From Figure 5, the introduction of RPSO not only re-
duces up-peak passengers’ WT, but also increases the po- pulation of passengers that are processed. We chose a time lapse of 10 seconds to measure how many passen- gers can be processed within these 10 seconds. Accord- ing to the Americans with Disabilities Act (ADA), mo- dern elevator doors should delay a minimum of 3 se- conds for each car call, while the doors should delay a minimum of 5 seconds before closing [18]. With an end- correction of 2 seconds, we determine how many active elevators can serve passengers within these 10 second door delays to the elevator car. After an initial high peak
at start-up, followed by a downward trend, there is a peak in each scheduling strategy. For CMO, it happens at <100 s, around <80 s for MAMO, <90 s for CMO-RPSO, <40 s for MAMO-RPSO. The reason for these peaks is passengers’ arriving time follows a Poisson Distribution. It can be seen from Figure 3 that there is an arrivals peak
between 46 s - 55 s, which is why the peaks in Figure 5
happen. When many passengers arrive at the same time, the high density of arrivals causes WTs at that period to become longer. But if CMO and CMO-RPSO, MAMO and MAMO-RPSO are compared, it can be shown that the peak moves forward horizontally by approximately 10%, and 50% respectively, which is fairly close to the improvement of passenger’s WT. When RPSO is used, the WTs are relatively shorter at the period of high arri- val density. Besides, in multi-agent EGCS based on RPSO, over 98%, which is nearly all passengers arrive at their target floor within 60 seconds.
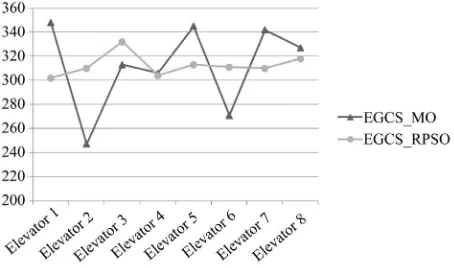
Figure 6 shows the situation of how elevators are used
during up-peak traffic:
From Figure 6 it is shown that because of the intro-
duction of RPSO, the frequency of each elevator usage is fluctuating between 302 and 322. At the same time, dis- persion of elevators’ utilization is counted as follows: for original multi-objective EGCS, STDeu = 40.30, this
number reduces to STDeu = 6.61 with the introduction of
RPSO.
The results from experiments show that MAMO- RPSO performs elevator re-allocation 3.51% of the times elevator calls is made in up-peak traffic. Meanwhile, CMO-RPSO reallocates 1.23% of the elevators called. Clearly, CMO-RPSO is reallocating less elevators, about 65% less than MAMORPSO, which means that it is more efficient in selecting the optimal elevator for a call in up-peak traffic pattern. The optimal elevator not only has the lowest cost, but is also free to be used.
4.4. Analysis and Discussion
The results expectedly show that even the same algo- rithm gives different results for different traffic patterns. For the simulation experiment, the chosen traffic pattern has much more impact on the performance of elevators than the algorithm. These observations are analysed and discussed from the point of view of traffic patterns. How- ever for up-peak traffic, improvements in the WT and RT are achieved when using RPSO in multi-agent control mechanism. There are significant improvements in the WTs especially. The results are also analysed from a comparative view of algorithms used in the simulation.
Figure 5. Distribution of up-peak passenger WT.
Figure 6. Distribution of elevator utilization for up-peak traffic.
WTs than the scheduling algorithms. For example, inter- floor traffic show smaller WTs than up-peak or down- peak traffic for all the algorithms used in the experiment.
So, for up-peak traffic, most elevator cars will move to a floor m and stay there. Subsequent up-peak traffic will involve the car moving back down to the ground floor and then back to an upper floor. The time taken by the elevator car in moving from ground floor to the mth floor consequently increases the total WT for a passenger. Si- milar analysis can be shown for downpeak traffic. How- ever, with inter-floor traffic, the car will move shorter distances within floors, leading to shorter waiting for passengers. For this problem, there are other controlling mechanisms that allow elevator cars to move to other floors after dropping off passengers, by trying to predict where the next call might be [19]. These predictive stra- tegies are expected to provide more uniform results and could be affected more by the algorithm than the traffic patterns. Also, when zoning controlling mechanisms are used, elevator cars are serving specific logical partitions of floors called zones [9,20]. The results in this case are also expected to be more uniform for the traffic patterns. Some elevator manufacturers include mechanisms to detect traffic patterns and select appropriate algorithms
based on the traffic situation. However, the scope of this study is to generically investigate scheduling, and auxi- liary optimizations based on traffic situations are left for future research.
For up-peak traffic, we present an analysis of the im- provements of WT observed with the introduction of RPSO. CMO-RPSO shows an improvement of over 22% in the WT, while MAMORPSO improves the WT by almost 57%. The reduced WTs achieved by using RPSO can be explained by the number of cost comparisons that are done when RPSO is used. The elevator controller makes decisions based on the cost function for each ele- vator. With m elevators and n passengers, the controller would normally have to make m × n comparisons of which elevator has the smallest cost. However, with RPSO, the size of the solution set depends on the flock size and swarm size. The number of elevators compared in RPSO is equal to the configuration of the flock size, which consequently affects the solution space size. The elevators to be compared are randomly selected and the elevator with the smallest cost is selected as the local best. Depending on the swarm size configuration, another local optimal can be selected until a satisfactory global optimal cost is obtained. Consequently, the number of comparisons can be controlled with swarm size and flock size. In fact, swarm size and flock size can be configured so the following condition is met.
swarm_size × flock_size < m
So the number of cost comparisons in RPSO is always less than m × n, which is why there are improvements in the WTs. It is noted that if swarm size × flock size ≥ m then RPSO will not work efficiently. At the threshold when swarm size × flock size = m, CMO-RPSO and MAMORPSO may behave the same way as CMO and MAMO. However, at swarm size × flock size > m it is almost certain that RPSO will perform worse than CMO or MAMO.
[image:9.595.62.289.278.412.2]also improved with RPSO. This can be shown as follows, using the statistic of WT + RT: with CMO-RPSO, the total average time a passenger spends using an elevator is reduced by approximately 14%. With MAMO-RPSO, the reduction is up to 33%.
It is also observed that randomization plays an impor- tant role in determining the final global optimal solution. This is explained as follows. m0 (where m0 = flock size) elevators are randomly selected for finding the local op- timal solution, where m0 < m. Depending on the hard- ware or software platform used, the function for generat- ing random numbers needs to be fast and diverse for get- ting best results. In the experiments carried out, random selection without replacement is used to make sure that the same random solutions are not re-selected.
The results also clearly point out that MAMO in gene- ral outperforms CMO, both with and without RPSO. For the improvements between CMO and MAMO, the reason for this is the division of the solution space into smaller subsets. The smaller solution sets could be processed faster because the scheduling possibilities are limited, i.e. less than the larger solution space. Consequently, the overall solution is also reached faster.
It has been noted that the re-allocation of elevators is better with CMO-RPSO. It is because in MAMO-RPSO each single elevator controller is calculating and sending cost quotes, it might not consider other elevators; hence each controller does not have an overall real-time per- spective. However, it is also noteworthy that MAMO- RPSO is still giving substantially better results with WT. This is because dividing the calculations across multiple controllers reduces the overall decision making time for the group controller. Overall, MAMO-RPSO is able to perform EGCS scheduling more efficiently than CMO- RPSO.
Our contributions include an enhancement of the PSO algorithm as RPSO, which decreases average WTs. We also use known concepts in EGCS scheduling to explain our results. The simulation results for the WTs serve as theoretical benchmarks which can be used as a motiva- tion for real-world implementation on hardware.
5. Conclusions
In this paper, RPSO is proposed as a solution to the multi-agent EGCS scheduling problem. Besides, real- time elevator re-allocation function is realized using RPSO. Results from experiments also reiterate that EGCS based on MAS can overcome the bottleneck in centralized EGC and RPSO is an efficient algorithm. Multi-agent EGCS using RPSO gives good result for the EGCS scheduling problem. Our contributions include development of the RPSO algorithm to decrease average WTs. In future work, testing on hardware will be carried out to see the effectiveness of the RPSO algorithm in
real-life situations. Also, comparative analysis will be done using varied values for handling capacity and arri- val rate to analyze performance in extremely demanding situations.
REFERENCES
[1] P. Robertson, R. Smith and A. Rae, “Lift Traffic Patterns in a Multi-Storey Residential Block,” Applied Ergonom- ics, Vol. 7, No. 2, 1976, pp. 85-88.
doi:10.1016/0003-6870(76)90154-X
[2] R. H. Crites and A. G. Barto, “Elevator Group Control Using Multiple Reinforcement Learning Agents,” Ma- chine Learning, Vol. 33, No. 3, 1998, pp. 235-262. doi:10.1023/A:1007518724497
[3] B. Seckinger and J. Koehler, “Online-Synthese von Aufzugssteuerungen als Planungsproblem (In German),” Workshop Planen und Konfigurieren Interner Bericht des Instituts fur Informatik der Universitat Wu Rzburg, 1999, pp. 127-134.
[4] C. Kim, K. Seong, H. Lee-Kwang and J. Kim, “Design and Implementation of a Fuzzy Elevator Group Control System,” IEEE Transactions on Systems, Man and Cy- bernetics, Part A: Systems and Humans, Vol. 28, No. 3, 1998, pp. 277-287. doi:10.1109/3468.668960
[5] D. Zhu, L. Jiang, Y. Zhou, G. Shan and K. He, “Modern Elevator Group Supervisory Control Systems and Neural Networks Technique,” IEEE International Conference on Intelligent Processing Systems, Vol. 1, 1997, pp. 528-532. [6] N. Imasaki, S. Kubo, S. Nakai, T. Yoshitsugu, J. I. Kiji and T. Endo, “Elevator Group Control System Tuned by a Fuzzy Neural Network Applied Method,” International Joint Conference of the 4th IEEE International Confer- ence on Fuzzy Systems, Vol. 4, 1995, pp. 1735-1740. [7] F. Luo, Y. G. Xu and J. Z. Cao, “Elevator Traffic Flow
Prediction with Least Squares Support Vector Machines,”
International Conference on Machine Learning and Cy- bernetics, Vol. 7, 2005, pp. 4266-4270.
[8] CIBSE Guide D, “Transportation Systems in Buildings,” The Chartered Institution of Building Services Engineers, London, 2010
[9] M. L. Siikonen, “On Traffic Planning Methodology,” Ele- vator Technology, Vol. 27, No. 3, 2000, pp. 267-274. [10] H. Hakonen and M. L. Siikonen, “Elevator Traffic Simu-
lation Procedure,” Elevator World, Vol. 57, No. 9, 2008, pp. 180-190.
[11] T. Susi, J. Sorsa and M. L. Siikonen, “Passenger Be- haviour in Elevator Simulation,” Elevatori, Vol. 34, No. 5, 2005, pp. 28-37.
[12] J. Koehler and D. Ottiger, “An AI-Based Approach to Destination Control in Elevators,” AI Magazine, 2002, p. 23.
[14] J. Kennedy and R. Eberhart, “Particle Swarm Optimiza- tion,” Proceedings of IEEE International Conference on Neural Networks, Vol. 4, 1995, pp. 1942-1948.
doi:10.1109/ICNN.1995.488968
[15] R. Smith and R. Peters, “Method of Assigning Hall Calls Based on Time Thresholds,” US Patent 8,104,585 B2, 2012.
[16] Z. Wang, D. Sun, G. Zhan and Q. Wu, “Design and De- velopment of Standard Traffic Flow Model of Elevator Group Control System,” Mechatronics, Vol. 15, No. 5, 2009, pp. 29-33.
[17] Chinese Construction Bidding Website, “Elevator
Re-quirements and Parameters for Quality and Technical Standards,” 2011. http://www.zhaobiao.gov.cn
[18] USA Department of Justice, “Americans with Disabilities Act (ADA),” 2011. http://www.ada.gov
[19] D. Nikovski and M. Brand, “Decision-Theoretic Group Elevator Scheduling,” Proceedings of the 13th Interna- tional Conference on Automated Planning and Schedul-ing, 2003, pp. 133-142.