ISSN Print: 2327-4018
DOI: 10.4236/ojmsi.2018.63003 Jul. 10, 2018 27 Open Journal of Modelling and Simulation
Models of Tax Planning Simulation:
The Case of Greece
Nikolaos Varotsis
1, Ioannis Katerelos
21Business Department, Hellenic Open University, Greece 2Psychology Department, Panteion University of Athens, Greece
Abstract
This paper highlights the timeless failure of the tax system in Greece despite its continuous reform, addressing the study of tax evasion phenomenon with a different approach. The study aims to identify socio-psychological characte-ristics and attitudes that affect the study of tax behavior using the mathemati-cal research of linear models for tax policy and to assess tax behavior with si-mulation models, where state reform, tax reform and fiscal restructuring— along with social consensus, transparency and fair taxation—are control pa-rameters. The survey involved 320 taxpayers from the entire Greek territory. Mathematical study using linear analysis showed that a linear model inte-grates fiscal, social and psychological factors are significantly better in representing tax behavior, lowering tax evasion. Specifically, a main futures model is bettering the tax behavior (R2 = 0.237) improving the tax revenues. These results plainly infer the conclusion that tax behavior in Greece might affected by fiscal, social and psychological factors.
Keywords
Tax Evasion, Social Simulation, Tax Behavior, Compliance, Public Policy
1. Introduction
Tax evasion remains of the biggest challenges facing the Greek society. The illeg-al evasion of taxes is a major economic and sociilleg-al problem [1] because it be-reaves the public of social resources that would improve the country’s standard of living. Evasion is also acting as a means of redistribution of disposable income from legitimate taxpayers to tax evaders. Moreover, the recent protracted eco-nomic austerity policy, combined with additional taxes [2], in association with the financial solidarity of the European Union and the International Monetary How to cite this paper: Varotsis, N. and
Katerelos, I. (2018) Models of Tax Planning Simulation: The Case of Greece. Open Journal of Modelling and Simulation, 6, 27-44.
https://doi.org/10.4236/ojmsi.2018.63003
Received: May 16, 2018 Accepted: July 7, 2018 Published: July 10, 2018
Copyright © 2018 by authors and Scientific Research Publishing Inc. This work is licensed under the Creative Commons Attribution International License (CC BY 4.0).
http://creativecommons.org/licenses/by/4.0/
DOI: 10.4236/ojmsi.2018.63003 28 Open Journal of Modelling and Simulation Fund—aimed at serving the financial needs of the public debt—is continuing, while tax evasion remains unaffected. This situation conduces to the frustration of both the Greek and European taxpayers.
The long-range presence of intense evasion, despite several changes in the tax legislation, is not just limited to the failure of the tax-audit authorities, but is possibly extended by the forbearance exhibited by the community [3]. An economy or/and a society that have habitual learned to tolerate the shadow economy and the illegal acquisition of non-taxed income at a high level; it has effectively adopted a corresponding illegal tax behavior [4]. The tolerant attitude held by taxpayers regarding tax evasion is obviously not derived solely from the weaknesses of the tax authorities. It possibly involves socio-psychological cha-racteristics and perceptions of the mix of budgetary and tax public policy [5] and the management of fiscal resources—these influencing the tax behavior, and thus helping to preserve this attitude [6].
The exploration of fiscal and socio-psychological factors that influence tax behavior and the design of a tax system that integrates them is the contribution of this research to existing literature. The exploratory factor analysis of this re-search indicated 6 factors that may have a positive impact on tax revenues. Ex-perimenting with tax planning simulation models that, besides taxpayers’ eco-nomic and tax assets, includes fiscal and socio-psychological characteristics, po-tentially can successfully expand the tax base and the effectiveness of the tax sys-tem.
2. Background
[image:2.595.210.538.604.700.2]2.1. Comparing Tax Systems
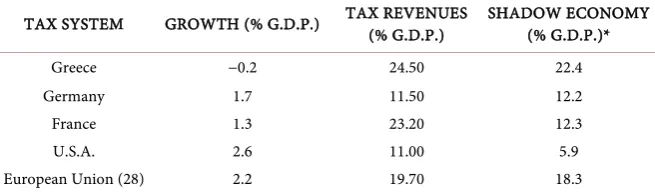
Table 1 compares aspects of three National and tax systems and the average for the European Union of 28 countries with the Greek tax system. As seen from the table the Greek economy demonstrates a relatively large non-taxed economy (Shadow Economy). However, the proportion of GDP taken in tax revenue is higher than the European average [7]. The percentage of tax revenues to total GDP expenditure, calculated as the sum of taxes compared to the height of GDP for each year, excluding social health insurance funds, amounts to 11.09% of GDP in Greece (9.7% EU 27) [8].
Table 1. Overview of tax systems.
TAX SYSTEM GROWTH (% G.D.P.) TAX REVENUES (% G.D.P.) SHADOW ECONOMY (% G.D.P.)*
Greece −0.2 24.50 22.4
Germany 1.7 11.50 12.2
France 1.3 23.20 12.3
U.S.A. 2.6 11.00 5.9
European Union (28) 2.2 19.70 18.3
DOI: 10.4236/ojmsi.2018.63003 29 Open Journal of Modelling and Simulation Greece, in the informal sector, occupies 21st position (22.4%) among the 28 European Union countries (average 18.3%) and, without consideration of social benefits, 11.09% instead of 9.7% when compared with the European average. The proportion of tax revenues in GDP of Greece is more than the average Eu-ropean average (19.70%). This difference is higher than the comparable figures for the German and the American tax system, these representing two of the largest global economies showing largely economic activity. The comparison of the Greek tax system with the French shows that the former is extremely inade-quate for despite displaying similar tax percentage of GDP, Greece has a shadow economy of more than twice the volume [9].
According to the Court of Auditors’ Report for the financial year 2009 (ECA, 2011) at the end of 2009 Tax Entitlements pending were 33.55 billion €. In late 2013 the overdue taxes were more than 65 billion €. Today they exceed 95.00 bil-lion € [10]. Merely the interest due on taxes for the one year 2016, added another 11 billion €. During the years 2010-2013 the overdue taxes virtually doubled, while tax evasion showed no reduction remaining very high compared with the European average—for the year 2012 it amounted to 24% of the Gross National Product or 43.2 billion €. For 2013 it stands at 23.3% or 44.7 billion € [11]. By the end of 2017 the sum of overdue taxes will ascend the 60% of GDP surpassing the 100 billion €.
2.2. Tax Behavior
The economic human behavior often deviates from the neoclassical rational model [12], embodying actions aimed at the welfare and beliefs of others. Hu-man behavior and decision making [13] vary from rational choice by the activa-tion of mental shortcuts (heuristics) and cognitive limits (cognitive bias) [14]. The dominant features for the individual are rationality in behavior and selfish-ness with sole motive staff satisfaction of interest in material goods [15]. How-ever, social preferences such as altruism, reciprocity, intrinsic motivation, the desire to preserve morality, trust, envy, all have conspicuous impact [16] on economic behavior [17], affecting economic fundamentals such as unemploy-ment, charity and education. Understanding the nature and interaction of social preferences and social norms is particularly beneficial [18] for improving the understanding of economic behavior [19], and in managing and improving economic policy and tax policy [20].
DOI: 10.4236/ojmsi.2018.63003 30 Open Journal of Modelling and Simulation categories of taxpayer results in an inequitable distribution of the tax burden, disadvantaging the honest taxpayer in the harvest of tax revenue.
The formation of tax systems with increased tax rates is too simplistic to be successful in a modern complex socio-economic system [25]. An increment in tax rates achieves only an interim increase in tax revenue while implementing tax models with low social efficiency [26], maintain the “marginal” behavior of the population using mixed strategies over time adopting a temporary option to pay taxes and then adapting in any way to eschew paying taxes [27]. This kind of behavior is a political exploitation object while raising taxes for balancing the budget exacerbates inequality, social conflict and the distortion of competition.
The over-taxation in addition to creating economic lassitude in the population leads to social reactions to an ineffective government. This is caused by the ratio of taxable income and tax [28]. The increase in tax rates through tax policy dif-ferentiation [29] is ineffective for increasing tax revenues and managing the economy. Finding the optimal tax rate is a prerequisite for a sustainable tax pol-icy [30].
2.3. Social Simulation
Simulation is the process of experimentation [31] models. The simulation of so-cial phenomena involves creating a model to aid our understanding and confir-mation everyday experiences [32]. Social simulations are based on systems con-sisting of human beings [33]. The complex dynamics [34] of social systems [35]
makes it difficult to accurately predict behavior. The interaction of human factors [36] provides explanations for the emergence of social phenomena
[37]. Therefore, it is more efficient to model at different levels. The process of micro-simulation in which different levels of the system simulation are selected achieves this. These levels in a social simulation of an economic system, specifi-cally in a tax system [38], which include socio-psychological characteristics [39], may provide an optimistic model, a pessimistic one, and at least an intermediate model.
A tax algorithm calculates taxes on disposable income. A simulation of a tax planning for a population with economic and socio-psychological characteris-tics, can better explore various strategies that combine different disciplines. This achieves an investigation of macroeconomic effects in relation to those individu-al characteristics of the population that determine the tax behavior, with the ul-timate goal of modeling tax compliance [40].
2.4. Social Consensus
Social consensus is an agreement on a common social purpose [41] [42] from all involved and interested parties. The social consensus—also known as functio-nality—is based [43] on societies of self-preservation and social responsibility
DOI: 10.4236/ojmsi.2018.63003 31 Open Journal of Modelling and Simulation The social consensus contrasts [47] with the practice of conflict [48] that re-quires modification of the existing status quo in order to accomplish a change. The social consensus aims to balance the society through an altogether accepta-ble agreement [49] on the rules, values and operational regulations of the society on a particular frame.
2.5. Tax Reform
The tax reform and the state reform is the method [50] an elected government chooses to improve the tax system and the state administration with the aim of collectability of taxes and the quality of government services. Tax reform could include simplifying the tax system, increase or reduction of taxes, the change of progressiveness of tax income, imposing new taxes, eliminating inefficient taxes for economy, by updating of demographic characteristics or even the procedure of collection of established taxes [51]. The state reform may include simplifying citizen transactions with the state, improving the provision of government ser-vices, the functionality of public services [52] for the benefit of citizens [53] and the public works efficacy in relation to the financial requirements and condi-tions.
The tax system and state operation effectiveness is linked to economic devel-opment and the efficient management of the available financial resources. It is a key factor for economic prosperity and social cohesion and is also the corner-stone of an independent democratic state [54].
The efficiency of a tax system depends on the economic environment in rela-tion to the social characteristics of taxpayers [55]. The importance of a fair tax system is fair distribution of the tax burden in relation to real incomes [56]. The primacy of justice or of selfishness compared to taxation is the key efficiency factor of a tax model [57]. The fair distribution of tax burden is affecting the de-gree of tolerance evasion both to the consistent taxpayers and to the fraudsters, stressing the importance of a fair tax system [58].
2.6. Tax Compliance
Tax behavior depends on the tax compliance of taxpayers in relation to legisla-tion [59]. Changes in tax law can cause changes of the behavior of taxpayers, these being adaptive to the new legal environment that has been created.
Change in tax legislation influences the consumption behavior of the taxpayer
[60]. Appropriate tax advice from an accountant can adjusts the recording of tax status, the changing tax returns, the reviewing of the timing of transactions and so performing a series of actions that do not alter the consumer behavior but the tax mapping of this behavior. Especially in high income taxpayers [61] the tigh-tening of tax legislation can lead to alteration of their taxable income rather than the actual level of prosperity and consumer behavior.
DOI: 10.4236/ojmsi.2018.63003 32 Open Journal of Modelling and Simulation tax rates affects low income brackets more than the high who can adjust their consumption behavior to the new situation, without appreciably affecting their living standards and tax morality [63] [64].
According to tax legislation in Greece, evasion leads to the activation of sen-tences [65] comprising the capture of movable and immovable property, seizing bank accounts, temporary or permanent closure of businesses and, in exception-ally cases, high evasion can lead to imprisonment [66]. As a consequence, fear of selecting legal or illegal (tax evasion) tax behavior is caused by the imposition of such penalties.
2.7. Transparency
Transparency is the degree of perception of managed information of a sender
[67] by an administrator [68]. Administrators should enhance the visibility, un-derstanding and accuracy of information to stakeholders in order to achieve [69]
adequate transparency [70]. The removal of all obstacles in the information management and the public decision-making constitutes the radical transparen-cy [71].
In politics [72], transparency is inherent with the integrity of government of-ficials, the accountability of civil servants and limit corruption [73]. The more a government publishes regulations, tenders, budgets and accounts [74], the fur-ther enhances transparency [75]. Transparency is also enhanced when laws and decisions of a government put into public consultation before finally legislated
[76].
3. Method
3.1 Participants
This research investigated the identification of characteristics and perceptions which play an important role in the tax behavior and endurance of evasion. The total sample from respondents consists of 320 anonymous questionnaires. An audit for outliers to the data reported a successful outcome (100%). The sample consisted of 159 men (49.7%) and 161 (50.3%) women—this achieving a harmo-nious symmetry in relation to the total population. Data was collected between June and December 2016.
3.2. Procedure
DOI: 10.4236/ojmsi.2018.63003 33 Open Journal of Modelling and Simulation The anonymity of the questionnaires helped to overcome the authentication failure that exists in the online survey through the use of social networks. Limi-tations of the research process probably include that the sample may contain a small number of older or retired taxpayers, low or limited educational level or/and busy which tend to more easily reject their participation on a survey.
3.3. Measures
All methods and implementation of linear models were performed in SPSS 20.0. The quantitative survey was conducted by the completion of anonymous ques-tionnaires which were distributed, completed and collected online. The ano-nymous questionnaire contained five parts. The Part A recorded the personal and demographic data of the participants, Part B investigated the assessment of the tax system through thirty questions, Part C focused on investigating the atti-tude to tax policy with forty questions, and Part D the fiscal policy mix with fourteen questions which participants answered using a 5 point-scale. Part E listed twenty-two possible causes that might incite a taxpayer to evade taxes.
4. Results
Part A lists personal, demographic and economic characteristics of respondents. From the results of the Part B there is apparent agreement that the tax system in Greece is ineffective. The main reasons noted for the inefficiency is that the tax system is unfair, it treats all taxpayers equally, while not delivering equitable management of public resources. The tax system itself is basically responsible for the tendency towards tax evasion. The amount of tax is excessive and the sup-posed transparent management of public resources a failure.
The results of the Part C show there is no sense of satisfaction with either the tax system or for the distribution and fiscal management of public funds. It is evident from the data that these do not meet the requirements of taxpayers. Apart from the non-acceptance of the existing tax system there is a general dis-taste for the way in which public funds are spent. Redistribution of income is not achieved by the existing tax system and the implemented tax policy mix.
Part D shows that taxpayers expect a new tax system and a new fiscal policy mix by the restructuring of government spending. There are certain areas of public spending proposed in order to directly save resources for budget consoli-dation. There are other areas proposed to improve management and also specific areas that should be included in a new fiscal policy. The preference is of gov-ernment revenues to run on a Govgov-ernment rather than on a European level, however, with regard to the management of state income, taxpayers seem to have more confidence in broader European management rather than Govern-ment and/or Local Authorities manageGovern-ment. However, the joint manageGovern-ment of Tax revenues at Government, European and Local level is also seen as acceptable.
DOI: 10.4236/ojmsi.2018.63003 34 Open Journal of Modelling and Simulation almost two out of three taxpayers that the main causes of tax evasion in Greece are political corruption and unfair taxation. Other important causes of tax eva-sion recorded are: mismanagement at government level, the lack of transparency in government spending policy, high taxes and poor public services.
This research indicates the reasons which might motivate a taxpayer to evade tax. There is agreement in around two out of three taxpayers that the main rea-sons underlying tax evasion in Greece are corruption and unfair taxation. Other important causes of tax evasion indicated are mismanagement at government level, the lack of transparency in government policy, high taxes and poor public services.
5. Exploratory Factor Analysis
[image:8.595.208.542.601.725.2]An exploratory factor analysis was conducted (Principal Axis Factoring) with direct rotation (Direct Oblimin) using the software SPSS version 20.0. This was done after a data suitability estimate for factor analysis [77]. The analysis indi-cated 6 factors which were obtained with the SPSS 20.0 program.
Table 2 presents a summary of the factor analysis. The six factors identified in this analysis and assessment of the tax system were; State Reform, Tax Reform, Social Consensus, Financial Restructuring, Transparency and Fair Taxation.
The Confirmatory Factor Analysis was performed using the method of maxi-mum likelihood to estimate the model. This rejected the possibility of variables having have zero correlation. However, the influence of a latent factor the ob-served variables was not confirmed in the factor analysis. The factor analysis system showed that a latent factor model is not a good fit.
6. Simulation Model Tax Planning
The exploration of a linear tax planning model that incorporates socio-psychological characteristics may give rise to improved procedures concerning tax revenue. In the Model of Essential Characteristics, Taxes might be calculated in relation to the basic tax behavioral factors as measured by Factor Analysis, adding the fac-tor of a tightening of sanctions on fraudsters. On the Model of Personal Property Taxes [78] are calculated in relation to the property of taxpayers (movable, im-movable, property statements etc.).
Table 2. Summary of factor analysis.
FACTOR EIGENVALUE PCT VAR NO. ITEMS Alpha
State Reform 7.621 9.998 21 6.131
Tax Reform 4.903 6.021 16 3.231
Social Consensus 3.053 3.373 7 2.866
Fiscal Restructuring 2.658 2.756 4 2.969
Transparency 2.560 2.607 2 2.969
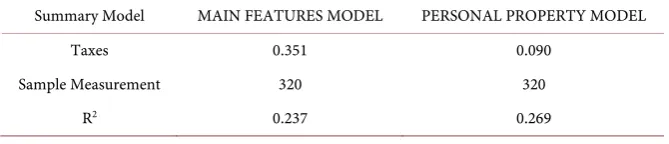
DOI: 10.4236/ojmsi.2018.63003 35 Open Journal of Modelling and Simulation In a period of shrinking economy, with a smaller increase in tax revenues re-sulting from a model incorporating the personal property of taxpayers, a greater increase in Tax Revenue might be achieved by a model that incorporates the key features of taxpayers and the severe punishment of tax evaders, which is more effective in times of economic growth. State Reform and Fair Taxation are the Key Factors in reforming the tax system, however the low R2 reveals a complexi-ty in the phenomenon. A summary of the Models is presented in Table 3 below. Research on a Simulation Model was carried out with the Bootstrapping me-thod incorporating the key features of tax behavior and property taxpayers. This model considered the effect from a tax planning model with key features and personal property using the Bootstrapping method. The method Bootstrapping (IBM SPSS Bootstrapping 20) was applied through the SPSS version 20.0 soft-ware.
The simulation method is achieved with a statistical resampling Bootstrapping
[79], the distribution of actual research results. During the execution of the pro-posed method chosen by the software a number of one thousand hypothetical samples with 95% confidence interval.
The factors of the model are those resulting from the factor analysis and translated into 01 = State Reform, 02 = Tax Reform, 03 = Social Consensus, 04 = Fiscal Restructuring, 05 = Fair Taxation and 06 = Transparency. For a systems dynamics simulation model assessment, it was carried out with four different scenarios Economic Development. The informal economy (Shadow Economy) calculated with a factor 0.23 (SE = 0.23 GDP) for the coming years 2014-2020, as a percentage to GDP (GDP) per year (Y). The Savings Tax (TS) on the Simula-tion Model Method of Bootstrapping is Tax Save = Tax Loss and total taxes after application of the outcome model [80] is mapping to: Tax = Budget Tax + Tax Saving. The model of personal characteristics is expressed from:
( )
( )
(
( )01 ( )02 ( )03 ( )04 ( )05 ( )06)
Tax PS Tax A= ⋅ SR +TR +SC +FR +FT +Tr
[image:9.595.206.541.656.728.2]where Tax PS
( )
represents the taxes arises from the model of personal charac-teristics, Tax A( )
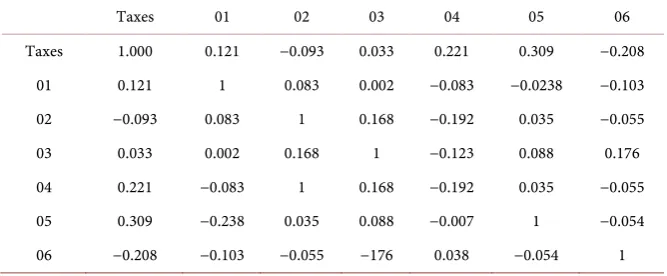
are the annual total budgeted tax revenues under the me-dium-term program, SR( )01 is the factor of State Reform, TR( )02 is the factor of Tax Reform, SC( )03 is the factor of Social Consensus, FR( )04 is the factor of Fiscal Restructuring, FT( )05 is the factor of Fair Taxation and Tr( )06 is the fac-tor of Transparency. In Table 4 is representing the correlations variables in the model of personal characteristics that is based the reference sample for the boot-strapping method.Table 3. Summary model key features and personal property.
Summary Model MAIN FEATURES MODEL PERSONAL PROPERTY MODEL
Taxes 0.351 0.090
Sample Measurement 320 320
DOI: 10.4236/ojmsi.2018.63003 36 Open Journal of Modelling and Simulation
Table 4. Correlations variables simulation model sample = 1000, R2 = 0.269.
Taxes 01 02 03 04 05 06
Taxes 1.000 0.121 −0.093 0.033 0.221 0.309 −0.208
01 0.121 1 0.083 0.002 −0.083 −0.0238 −0.103
02 −0.093 0.083 1 0.168 −0.192 0.035 −0.055
03 0.033 0.002 0.168 1 −0.123 0.088 0.176
04 0.221 −0.083 1 0.168 −0.192 0.035 −0.055
05 0.309 −0.238 0.035 0.088 −0.007 1 −0.054
06 −0.208 −0.103 −0.055 −176 0.038 −0.054 1
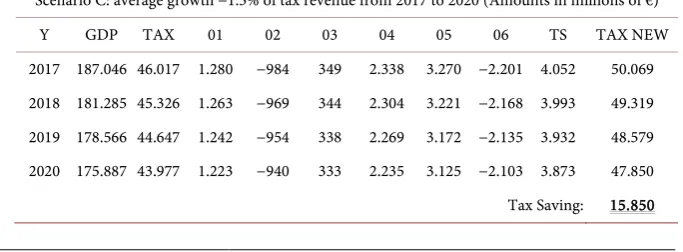
In Table 5 we fix the results for the years 2013 to 2016 on the basis of the Me-dium Term Program [81] and Tables 6-9 is a provision with four average eco-nomic growth scenarios, first (Optimistic) by +3.5%, the second (Realistic) with 0.5%, the third (Pessimistic) to −1.5% and the fourth (Very Pessimistic) to −4.5%. Subsequently we investigate the extent to which tax savings are related to factors in the model of personal characteristics. The estimation of tax saving re-sulting from:
( ) (
)
(
( )01 ( )02 ( )03 ( )04 ( )05 ( )06)
Tax S = GDP SE⋅ ⋅ SR +TR +SC +FR +FT +Tr
where Tax S
( )
represents the tax savings from the Shadow Economy of GDP. The total new computed taxes Tax New(
)
resulting from:(
)
( )
( )
Tax New =Tax A +Tax S
where Tax A
( )
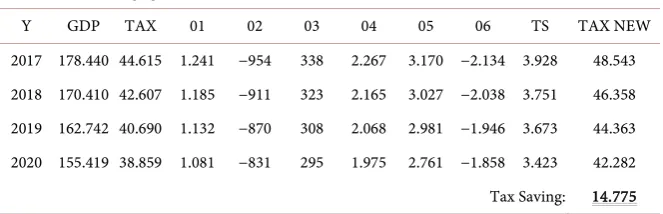
are the annual total budgeted tax revenues under the me-dium-term program [80].As seen from the above Tables 5-9, based on a Simulation Model for Tax Planning, a significant amount of lost taxes might be recovered. Recovery of ad-ditional taxes may approach 18 billion € for the four years from 2017 to 2020, while exceeding 17 billion € for the four years from 2013 to 2016 based on the growth figures of the economy and tax payments as provided for in the Medium Term Plan. Note that the calculation of taxes on growth scenarios and/or reces-sion of GDP for the years 2017 - 2020 was calculated as a proportion of the taxes under the Medium Term Plan for the year 2016.
DOI: 10.4236/ojmsi.2018.63003 37 Open Journal of Modelling and Simulation Table 5. Tax savings calculation for the years 2013 to 2016 after the reformation based on a simulation model with the Bootstrapping method.
BUDGETS TAX REVENUES 2013-2016 BASED ON THE MEDIUM TERM (Amounts in millions of €)
Y GDP TAX 01 02 03 04 05 06 TS TAX NEW
[image:11.595.209.539.295.398.2]2013 189.708 52.255 1.492 −1.146 407 2.725 3.810 −2.565 4.723 56.978 2014 188.750 50.406 1.402 −1.078 382 2.562 3.582 −2.411 4.439 54.845 2015 187.797 48.412 1.347 −1.035 367 2.460 3.440 −2.315 4.264 52.676 2016 186.849 46.718 1.300 −999 354 2.374 3.320 −2.234 4.115 50.833 Tax Saving: 17.541
Table 6. Tax savings calculation for the years 2017 to 2020 after reformation based on a simulation model with the Bootstrapping method (average growth +3.5%).
SCENARIO A: AVERAGE GROWTH 3.5% of tax revenue from 2017 to 2020 (Amounts in millions of €)
Y GDP TAX 01 02 03 04 05 06 TS TAX NEW
2017 193.388 48.353 1.345 −1.034 367 2.457 3.436 −2.313 4.258 52.611 2018 200.157 50.045 1.392 −1.070 379 2.543 3.556 −2.394 4.406 54.451 2019 207.162 51.797 1.441 −1.108 393 2.632 3.681 −2.478 4.561 56.358 2020 214.413 53.609 1.491 −1.146 406 2.425 3.810 −2.564 4.722 58.331 Tax Saving: 17.947
Table 7. Tax savings calculation for the years 2017-2020 after reformation based on a si-mulation model with the Bootstrapping method (average growth +0.5%)
SCENARIO B: 0.5% average growth in tax revenues from 2017 to 2020 (Amounts in millions of €)
Y GDP TAX 01 02 03 04 05 06 TS TAX NEW
2017 187.783 46.951 1.306 −1.004 356 2.386 3.336 −2.245 4.135 51.086 2018 188.722 47.186 1.313 −1.009 358 2.398 3.353 −2.257 4.156 51.342 2019 189.665 47.422 1.319 −1.014 360 2.410 3.370 −2.268 4.177 51.599 2020 190.614 47.659 1.323 −1.017 361 2.417 3.380 −2.275 4.189 51.848 Tax Saving: 16.657
Table 8. Calculation of tax saving for the years 2017 to 2020 after reformation based on a simulation model with the Bootstrapping method (average growth −1.5%).
Scenario C: average growth −1.5% of tax revenue from 2017 to 2020 (Amounts in millions of €)
Y GDP TAX 01 02 03 04 05 06 TS TAX NEW
[image:11.595.208.539.459.561.2] [image:11.595.199.541.613.739.2]DOI: 10.4236/ojmsi.2018.63003 38 Open Journal of Modelling and Simulation Table 9. Calculation of tax saving for the years 2013 to 2016 after reformation based on a simulation model with the Bootstrapping method (average growth −4.5%).
Scenario D: average growth −4.5% of tax revenue from 2017 to 2020 (Amounts in millions of €)
Y GDP TAX 01 02 03 04 05 06 TS TAX NEW
2017 178.440 44.615 1.241 −954 338 2.267 3.170 −2.134 3.928 48.543 2018 170.410 42.607 1.185 −911 323 2.165 3.027 −2.038 3.751 46.358 2019 162.742 40.690 1.132 −870 308 2.068 2.981 −1.946 3.673 44.363 2020 155.419 38.859 1.081 −831 295 1.975 2.761 −1.858 3.423 42.282 Tax Saving: 14.775 Y = Year, GDP = Gross Domestic Product, Tax = Total Taxes, 01 = State Reform, 02 = Tax Reform, 03 = Social Consensus, 04 = Financial Restructuring, 05 = Fair Taxation, 06 = Transparency, TS = Tax Saving, Tax New = Total Restated Tax.
reform of the tax system based on independent socio-psychological variables of the model, which affect the tax treatment of the population.
7. Discussion
This research revealed significant evidence on the linear relationship of so-cio-psychological factors [82] into the person’s tax behavior. The social consen-sus, transparency, fair taxation in conjunction with state restructuring and tax reform alter the tax behavior, enhancing government revenue. The so-cio-psychological approach to the tax fraud problem focuses on finding the cha-racteristics that affect the tax behavior, while eliminating the corruption. The as-similation of the specific characteristics from a revised tax policy restricts the extent of tax evasion.
The size of the shadow economy is shrinking and the tax revenue are increas-ing from the implementation of tax plannincreas-ing simulation models incorporatincreas-ing socio-psychological characteristics of the taxpayer. A tax planning simulation model [83] that has as its basis the individual socio-psychological characteristics achieves an increase in tax revenue [84]. The development of a model simulation with bootstrapping method confirmed this conclusion.
Legislative initiatives and the tax imputed income when applied in an isolated policy is less effective than a tax policy that involves socio-psychological factors. The opaque functioning of the state, the unfair tax system, and lack of social consensus increases [85] the propensity for fraud. Linear models enriched with socio-psychological factors explain tax behavior most satisfactorily.
The study of tax behavior in Greece revealed a multifaceted phenomenon as-sociated with many factors. A linear tax behavior model can be enriched by sev-eral independent factors. Testing with more simulation models of tax behavior may provide perspective for further increase in tax revenues.
8. Conclusions
DOI: 10.4236/ojmsi.2018.63003 39 Open Journal of Modelling and Simulation tax system in Greece with fiscal and socio-psychological characteristics, improv-ing the overall tax collection [86]. The effectiveness of the proposed tax model is based on the fiscal and socio-psychological characteristics emerged from the ex-ploratory factor analysis in the survey results.
State reform has a positive effect while, on the contrary, the tax reform applied has a negative impact on the collection of taxes. The tightening of penalties does not maximize the profitability of a tax planning simulation model, without the processing of penalties. Transparency does not appear to contribute to the effec-tiveness of tax collection, while fiscal restructuring and the punishment of tax evaders contributing to fair taxation are necessary factors for the effectiveness of a tax planning simulation model in tax collection.
From the study of the existing literature and the results of the current re-search, it appears that the legislative function (e.g. penalties) or the economic characteristics (e.g. living costs) when applied individually are ineffective in rela-tion to a tax policy involving fiscal and socio-psychological features. Restructur-ing the tax base through net tax-addRestructur-ing practices does not achieve a significant reduction in tax evasion [87], since taxpayers subsequently adopting an adjusted dynamic tax behavior under any new mixture of tax policies [88].
The exploration of socio-psychological factors that affect tax behavior and de-signing a tax system that incorporates them constitutes a novelty of this re-search. Experimenting with models of tax planning simulation that besides tax-payers’ economic attributes and assets include socio-psychological features, can achieve widening the tax base and efficiency of the tax system. The further wi-dening of the factors shaping tax behavior in Greece is necessary especially when tax evasion is a timeless problem that despite the legislation change remains high over time.
References
[1] Slemrod, J. and Yitzhaki, S. (2002) Tax Avoidance, Evasion, and Administration. In: Auerbach. A.J. and Feldsten, M., Eds., Handbook of Public Economics, Vol. 4, El-sevier, Amsterdam, 1425-1442.
[2] Brondolo, J. (2009) Collecting Taxes during an Economic Crisis: Challenges and Policy Options. International Monetary Fund, New York.
[3] Alm, J., Bloomquist, K.M. and McKee, M. (2016) When You Know Your Neighbor
Pay Taxes: Information, Peer Effects, and Tax Compliance.
https://doi.org/10.1111/1475-5890.12111
[4] Alm, J., McClelland, G.H. and Schulze, W.D. (1992) Why Do People Pay Taxes? Journal of Public Economics, 48, 21-38.
https://doi.org/10.1016/0047-2727(92)90040-M
[5] Gilardi, F. (2016) Four Ways We Can Improve Policy Diffusion Research. State Pol-itics and Policy Quarterly, 16, 8-21. https://doi.org/10.1177/1532440015608761
[6] Reckers, P.M., Sanders, D.L. and Roark, S.J. (1994) The Influence of Ethical Atti-tudes on Taxpayer Compliance. National Tax Journal, 47, 825-836.
[7] World Bank (2017) Tax Revenue 2016 (% GDP)—All Countries.
DOI: 10.4236/ojmsi.2018.63003 40 Open Journal of Modelling and Simulation [8] Eurostat (2013) Taxation Trends in European Union. Eurostat Statistical Books,
Luxembourg.
[9] Frewer, L. (2004) The Public and Effective Risk Communication. Toxicology Let-ters, 149, 391-397. https://doi.org/10.1016/j.toxlet.2003.12.049
[10] The Kathimerini (2017) Exceeded 94 Billion the Arrears to the State—12.6 Billion the New “Fez” Only for 2016.
http://www.kathimerini.gr/890225/article/oikonomia/ellhnikh-oikonomia/3eperasa n-ta-94-dis-oi-lh3ipro8esmes-ofeiles-pros-to-dhmosio---126-dis-nea-fesia-mono-to -2016
[11] Schneider, F. (2013) Size and Development of the Shadow Economy of 31 European and 5 Other OECD (Organization for Economic Co-Operation and Development) Countries from 2003 to 2015: Different Developments. Johannes Kepler University, Altenbergerst.
[12] Conlisk, J. (1996) Why Bounded Rationality? Journal of Economic Literature, XXXIV, 669-700.
[13] Edwards, W. (1954) The Theory of Decision Making. Psychological Bulletin, 51, 380-417. https://doi.org/10.1037/h0053870
[14] Tversky, A. and Kahneman, D. (1974) Judgment under Uncertainty: Heuristics and Biases. Science, 185, 1124-1131. https://doi.org/10.1126/science.185.4157.1124
[15] Just, D.R. (2014) Introduction to Behavioral Economics. Wiley, Hoboken, NJ. [16] Dhami, S. (2016) The Foundations of Behavioral Economic Analysis. Oxford
Uni-versity Press (OUP), Oxford.
[17] Kahneman, D. (2003) A Psychological Perspective on Economics. American
Eco-nomic Review, 93, 162-168. https://doi.org/10.1257/000282803321946985
[18] Kahneman, D. (2003) Maps of Bounded Rationality: Psychology of Behavioral Eco-nomics. American Economic Review, 93, 1449-1475.
https://doi.org/10.1257/000282803322655392
[19] Loewenstein, G. (2000) Emotions in Economic Theory and Economic Behavior. The American Economic Review, 90, 426-432. https://doi.org/10.1257/aer.90.2.426
[20] Bowman, W. (2010) Tax Policy. In: Anheier, H.K. and Toepler, S., Eds., Interna-tional Encyclopedia of Civil Society, Springer, New York, NY.
[21] Kirchler, E. (1999) Reactance to Taxation: Employers’ Attitudes towards Taxes. The Journal of Socio-Economics, 28, 131-138.
https://doi.org/10.1016/S1053-5357(99)00003-7
[22] Andreoni, J., Erard, B. and Feinstein, J. (1998) Tax Compliance. Journal of Eco-nomic Literature, 36, 818-860.
[23] Kaplow, L. (1996) How Tax Complexity and Enforcement Affect the Equity and Ef-ficiency of the Income Tax. National Tax Journal, 49, 135-150.
[24] Cullis, J.G. and Lewis, A. (1997) Why People Pay Taxes: From a Conventional Eco-nomic Model to a Model of Social Convention. Journal of Economic Psychology, 18, 305-321. https://doi.org/10.1016/S0167-4870(97)00010-X
[25] Murphy, K. (2008) Enforcing Tax Compliance: To Punish or Persuade? Economic
Analysis and Policy, 38, 113-135. https://doi.org/10.1016/S0313-5926(08)50009-9
[26] Wenzel, M. (2004) An Analysis of Norm Processes in Tax Compliance. Journal of Economic Psychology, 25, 213-228. https://doi.org/10.1016/S0167-4870(02)00168-X
DOI: 10.4236/ojmsi.2018.63003 41 Open Journal of Modelling and Simulation 171-188. https://doi.org/10.1016/S0313-5926(12)50019-6
[28] Tucker, I.B. (2013) Survey of Economics. South-Western College Publication, Chula Vista.
[29] Hammar, H., Jagers, S.C. and Nordblom, K. (2009) Perceived Tax Evasion and the Importance of Trust. The Journal of Socio-Economics, 38, 238-245.
https://doi.org/10.1016/j.socec.2008.07.003
[30] Laffer, A.B. (2004) The Laffer Curve: Past, Present and Future. Article No. 1765, The Heritage Foundation Publications, 1-16.
[31] Korn, G.A. (2013) Advanced Dynamic-System Simulation: Model Replication and
Monte Carlo Studies. John Wiley & Sons, Inc., Hoboken, NJ, 1-28.
https://doi.org/10.1002/9781118527412
[32] Krauskopf, T. and Prinz, A. (2011) Methods to Reanalyze Tax Compliance Experi-ments: Monte Carlo Simulations and Decision Time Analysis. Public Finance Re-view, 39, 168-188. https://doi.org/10.1177/1091142110381642
[33] Gilbert, N. and Troitzsh, K.G. (2005) Simulation for the Social Scientists. Open University, Berkshire.
[34] Rossiter, S., Noble, J. and Bell, K.R.W. (2010) Social Simulations: Improving Inter-disciplinary Understanding of Scientific Positioning and Validity. Journal of Artifi-cial Societies and SoArtifi-cial Simulation, 13, 10. https://doi.org/10.18564/jasss.1590
[35] Katerelos, I. (2013) Chaos and Order in Social Systems. Papazisis Publications, Athens.
[36] Gilbert, N. (1999) The Simulation of Social Processes. Center of Research on Simu-lation in the Social Sciences, 1-14.
[37] Edmonds, B. and Meyer, R. (2013) Simulating Social Complexity. Springer, Berlin, 3-12. https://doi.org/10.1007/978-3-540-93813-2
[38] Friedland, N., Maital, S. and Rutenberg, A. (1978) A Simulation Study of Income Tax Evasion. Journal of Public Economics, 10, 107-116.
https://doi.org/10.1016/0047-2727(78)90008-7
[39] Muehlbacher, S., Hartl, B. and Kirchler, E. (2015) Mental Accounting and Tax Compliance: Experimental Evidence for the Effect of Mental Segregation of Tax Due and Revenue on Compliance. Public Finance Review, 45, 118-139.
https://doi.org/10.1177/1091142115602063
[40] Bloomquist, K. (2011) Tax Compliance as Evolutionary Coordination Game: An Agent-Based Approach. Public Finance Review, 39, 25-49.
https://doi.org/10.1177/1091142110381640
[41] Weller, S.C. (2007) Cultural Consensus Theory: Applications and Frequently Asked Questions. Field Methods, 19, 339-368. https://doi.org/10.1177/1525822X07303502
[42] Wood, J.V. (1989) Theory and Research Concerning Social Comparisons of Person-al Attributes. PsychologicPerson-al Bulletin, 106, 231-248.
https://doi.org/10.1037/0033-2909.106.2.231
[43] Keltner, D. and Kring, A.M. (1998) Emotion, Social Function and Psychopathology. Review of General Psychology, 2, 320-342.
https://doi.org/10.1037/1089-2680.2.3.320
[44] Sutinen, J.G. and Kuperan, K. (1999) A Socio-Economic Theory of Regulatory Compliance. International Journal of Social Economics, 26, 174-193.
DOI: 10.4236/ojmsi.2018.63003 42 Open Journal of Modelling and Simulation [46] Katerelos, I. and Varotsis, N. (2017) A Cusp Catastrophe Model of Tax Behavior.
Nonlinear Dynamics, Psychology, and Life Sciences, 21, 89-112.
[47] Ross, L., Greene, D. and House, P. (1976) The “False Consensus Effect”: An Ego-centric Bias in Social Perception and Attribution Processes. Journal of Experimental Social Psychology, 13, 279-301. https://doi.org/10.1016/0022-1031(77)90049-X
[48] Lane, W.C. (1976) Consensus, Conflict, and International Stratification Theories of Modernization: An Evaluation. Mid-American Review of Sociology, 1, 19-32. [49] Peredo, A.M. and McLean, M. (2006) Social Entrepreneurship: A Critical Review of
the Concept. Journal of World Business, 41, 56-65.
https://doi.org/10.1016/j.jwb.2005.10.007
[50] Organization for Economic Co-Operation and Development (OECD) (2010)
Citi-zen-State Relations: Improving Governance through Tax Reform. TPA, OECD, Paris.
[51] Slemrod, J. (2001) A General Model of the Behavioral Response to Taxation. Inter-national Tax and Public Finance, 8, 119-128.
https://doi.org/10.1023/A:1011204301325
[52] Matei, L. and Lazar, C.G. (2011) Quality Management and the Reform of Public Administration in Several States in South-Eastern Europe. Comparative Analysis. Theoretical and Applied Economics, XVIII, 65-98.
[53] Allan, J.P. and Scruggs, L. (2004) Political Partisanships and Welfare State Reform in Advanced Industrial Societies. American Journal of Political Science, 48, 496-512.
https://doi.org/10.1111/j.0092-5853.2004.00083.x
[54] Anderson, K.M. (2001) The Politics of Retrenchment in a Social Democratic Wel-fare State. Comparative Political Studies, 34, 1063-1091.
https://doi.org/10.1177/0010414001034009005
[55] Kastlunger, B., Muehlbacher, S., Kirchler, E. and Mittone, L. (2011) What Goes Around Comes Around? Experimental Evidence for the Effects of Rewards on Tax Compliance. Public Finance Review, 39, 150-167.
https://doi.org/10.1177/1091142110376518
[56] Van Dijke, M. and Verboon, P. (2010) Trust in Authorities as a Boundary Condi-tion to Procedural Fairness Effects on Tax Compliance. Journal of Economic Psy-chology, 31, 80-91. https://doi.org/10.1016/j.joep.2009.10.005
[57] Fehr, E. and Schmidt, K.M. (1999) A Theory of Fairness, Competition and Cooper-ation. The Quarterly Journal of Economics, 114, 817-868.
https://doi.org/10.1162/003355399556151
[58] Barth, E., Cappelen, A.W. and Ogendal, T. (2013) Fair Tax Evasion. Nordic Journal of Political Economy, 38, 1-16. https://doi.org/10.2139/ssrn.2262192
[59] Alstadsaeter, A. and Jacob, M. (2013) The Effect of Awareness and Incentives on Tax Evasion. WP 13/14. Oxford University Centre of Business and Taxation. [60] Steindel, C. (2001) The Effect of Tax Changes on Consumer Spending. Vol. 7,
Fed-eral Reserve, New York. https://doi.org/10.2139/ssrn.711385
[61] Thoresen, T.O., Bo, E.E., Fjaerli, E. and Halvorsen, E. (2012) A Suggestion for Eva-luating the Redistributional Effects of Tax Changes: With an Application to the 2006 Norwegian Tax Reform. Public Finance Review, 40, 303-338.
https://doi.org/10.1177/1091142111432446
[62] Slemrod, J. (2007) Cheating Ourselves: The Economics of Tax Evasion. Journal of Economic Perspectives, 21, 25-48. https://doi.org/10.1257/jep.21.1.25
DOI: 10.4236/ojmsi.2018.63003 43 Open Journal of Modelling and Simulation States and Europe. Journal of Economic Psychology, 27, 224-246.
https://doi.org/10.1016/j.joep.2005.09.002
[64] Bobek, D.D. and Hatfield, R.C. (2003) An Investigation of the Theory of Planned Behavior and the Role of Moral Obligation in Tax Compliance. Behavioral Research in Accounting, 15, 13-38. https://doi.org/10.2308/bria.2003.15.1.13
[65] Greek Tax Code (2013) Tax Procedures and Other Provisions. Law, 4174/2013. [66] Greek Tax Code (1997) Administrative and Criminal Penalties in Tax Laws and
Other Provisions. Law, 2523/1997. The National Printing House, Athens. [67] Ball, C. (2009) What Is Transparency? Public Integrity, 11, 293-308.
https://doi.org/10.2753/PIN1099-9922110400
[68] Etzioni, A. (2010) Is Transparency the Best Disinfectant. The Journal of Political Philosophy, 18, 389-404. https://doi.org/10.1111/j.1467-9760.2010.00366.x
[69] Bertot, J.C., Jaeger, P.T. and Grimes, J.M. (2010) Using ICTs to Create a Culture of Transparency: E-Government and Social Media as Openness and Anti-Corruption Tools for Societies. Government Information Quarterly, 27, 264-271.
https://doi.org/10.1016/j.giq.2010.03.001
[70] Open Society Justice Initiative (2006) Transparency & Silence: A Survey of Access to Information Laws and Practices in 14 Countries. Open Society Institute, New York.
[71] Baltzersen, R.K. (2010) Radical Transparency: Open Access as a Key Concept in Wiki Pedagogy. Australian Journal of Educational Technology, 26, 791-809.
https://doi.org/10.14742/ajet.1043
[72] Ackert, L.F., Gillette, A.B., Martinez-Vazquez, J. and Rider, M. (2007) Voting on Tax Policy Design: A Test of the Selfish versus Social Preferences Hypotheses. Pub-lic Finance Review, 35, 263-284. https://doi.org/10.1177/1091142106293102
[73] Alt, J.E. and Lassen, D.D. (2006) Transparency, Political Polarization, and Political Budget Cycles in OECD Countries. American Journal of Political Science, 50, 530-550. https://doi.org/10.1111/j.1540-5907.2006.00200.x
[74] Brouwer, R., Powe, N., Turner, K.R., Bateman, I.J. and Langford, I.H. (1999) Public Attitudes to Contingent Valuation and Public Consultation. Environmental Values, 8, 325-347. https://doi.org/10.3197/096327199129341851
[75] Buehn, A. and Schneider, F. (2012) Shadow Economies around the World: Novel
Insights, Accepted Knowledge, and New Estimates. International Tax and Public Finance, 19, 139-171. https://doi.org/10.1007/s10797-011-9187-7
[76] Armstrong, E. (2005) Integrity, Transparency, and Accountability in Public Ad-ministration: Recent Trends, Regional and International Developments and Emerging Issues. United Nations, New York.
[77] Brace, N., Kemp, R. and Snelgar, R. (2012) SPSS for Psychologists. Palgrave Mac-millan, London.
[78] Varotsis, N. (2015) Socio Psychological Dimensions of Economic Behavior: Tax Planning Simulation Models. (Doctoral Dissertation). Retrieved from Pande-mos-Digital Library, Panteion University Athens.
[79] Fox, J. (2002) Bootstrapping Regression Models. Appendix to an R and S-PLUS Companion to Applied Regression. The Comprehensive R Archive Network. Pack-ages. R Statistics. http://cran.r-project.org/
DOI: 10.4236/ojmsi.2018.63003 44 Open Journal of Modelling and Simulation [81] Finance Ministry (2012) Medium Term Fiscal Strategy. The National Printing
House, Athens.
[82] Dhami, S. and Al-Nowaihi, A. (2007) Why Do People Pay Taxes? Prospect Theory versus Expected Utility Theory. Journal of Economic Behavior & Organization, 64, 171-192. https://doi.org/10.1016/j.jebo.2006.08.006
[83] Slemrod, J. (1990) Optimal Taxation and Optimal Tax Systems. Journal of Eco-nomic Perspectives, 4, 157-178. https://doi.org/10.1257/jep.4.1.157
[84] Toder, E., Nunns, J. and Rosenberg, J. (2012) Reducing the Deficit by Increasing In-dividual Income Tax Rates. Tax Policy Center, Washington.
[85] Varotsis, N., Katerelos, I. and Ladias, C.A. (2017) Systemdynamik einer steuerre-form: Der fall Griechenland. Zeitschrift für die Regionale Wissenschaft, VIII, 29-44. [86] Akerlof, G.A. (1978) The Economics of “Tagging” as Applied to the Optimal
In-come Tax, Welfare Programs, and Manpower Planning. The American Economic
Review, 68, 8-19.
[87] McKee, M., Siladke, C.A. and Vossler, C.A. (2018) Behavioral Dynamics of Tax Compliance when Taxpayer Assistance Services Are Available. International Tax and Public Finance, 25, 722-756. https://doi.org/10.1007/s10797-017-9466-z
[88] Poterba, J.M., Hall, R.E. and Hubbard, G.R. (1987) Tax Policy and Corporate Sav-ing. Brookings Papers on Economic Activity, 1987, 455-515.