A report produced as part of the EPSRC SOLUTIONS project -
the sustainability of land use and transport in outer
The cover pictures are of Bradley Stoke, Bristol, and Vauban, Freiburg,
Germany. They represent two extremes of car dependence. Around Bradley
Stoke the businesses are 95% car dependent, and people living there use
the car for 80% of ‘local’ trips. By comparison the residents of Vauban use
the car for 10% of trips, and 70% are by foot or bike. The Bristol suburb is
designed as a series of single use campus-style development pods, linked
by main roads. The Freiburg suburb, on re-used land, is designed as a
mixed use low-car, green environment around a public transport spine. The
physical differences mesh with the divergent values and lifestyle choices
of the inhabitants, reinforcing them, building unhealthy conditions into
the very fabric of the town in one case, while facilitating healthy and
sustainable behavioural choices in the other.
A study tour of Freiburg, funded by the Director of Health South West, was
organized as part of the SOLUTIONS local design work.
Text: Hugh Barton
Research by: Hugh Barton, Marcus Grant, Louis Rice and Michael Horswell
Layout: Jamie Roxburgh
WHO Collaborating centre for Healthy Urban Environments
University of the West of England, Bristol.
Contents
Preface
3
1. Research aims and process
5
Policy context
Research aims
The research process
2.
Local
study
areas
8
3. The SOLUTIONS household survey
11
4.
Neighbourhood
design
archetypes
13
Pods: use segregated, car-orientated development sites
Cells: neighbourhood units
Clusters: a group of interlocked neighbourhoods
Linear township: linked neighbourhoods along a main street
5. Designing a new settlement
18
Northstowe, Cambridgeshire
Conclusion
6. Major urban extensions
23
Newcastle Great Park
Cambridge East
Conclusion
7. Urban fringe development
30
Backworth and Shiremoor, Newcastle
Cambridge Southern Fringe
Broxbourne, Herts
8. The evaluation of established suburbs
37
Current trends in South Harrow and West Barking
Application of the archetypes
Newcastle West End
Conclusion
9. Comparing the archetypes
41
Pods
Cells
Clusters
Linear townships
List of figures
Figure 1 The local design research process p.6
Figure 2 The Cambridge study areas p.8
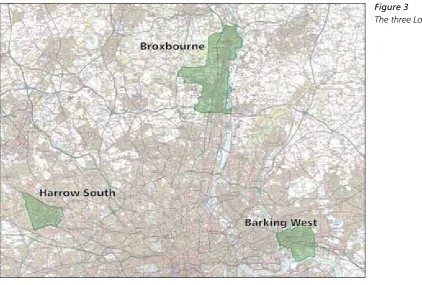
Figure 3 The three London study areas p.9
Figure 4 The Tyne and Wear study areas p.9
Figure 5 Trip distance bands by facility type p.11
Figure 6 Modal split by distance band for all trips p.11
Figure 7 Modal split in each study area in rank order of active travel p.12
Figure 8 Scatter diagram of neighbourhood density against percentage of active travel p.12
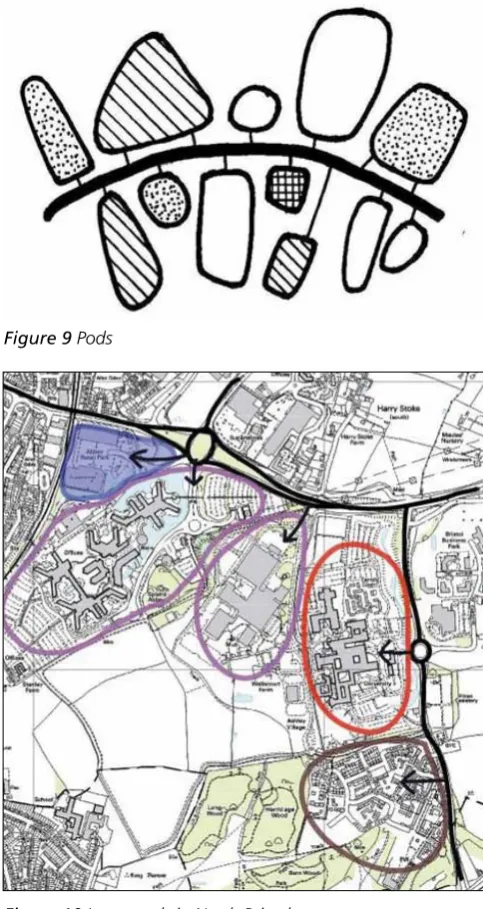
Figure 9 Pods p.13
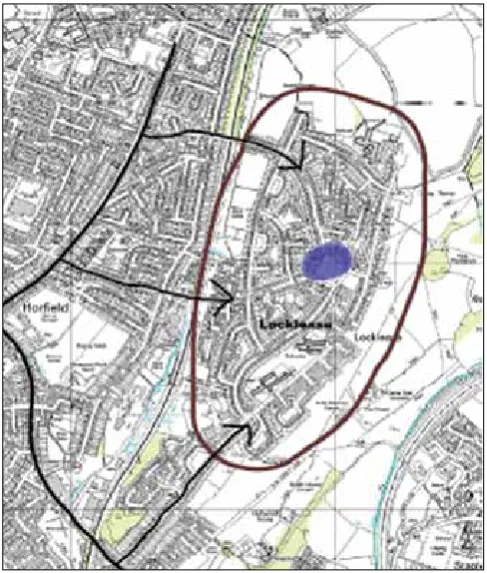
Figure 10 Large pods in North Bristol p.13
Figure 11 Cells p.14
Figure 12 Mid century neighbourhood cell in north Bristol p.14
Figure 13 Clusters p.15
Figure 14 Cluster of overlapping neighbourhoods in north Bristol p.15
Figure 15 Linear p.15
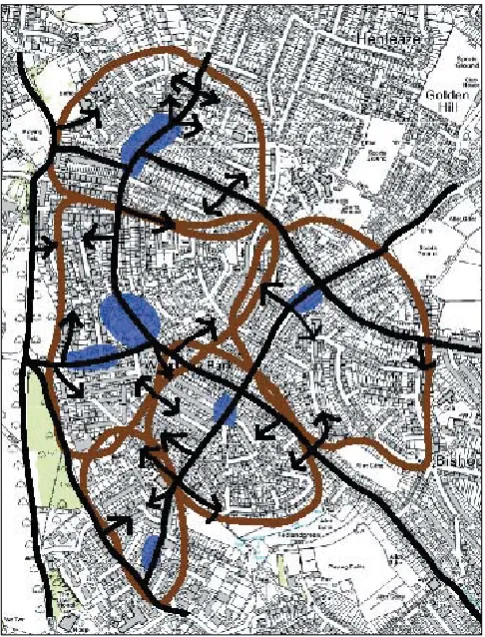
Figure 16 Linear township along a main radial, with
neighbourhoods either side of the high street, in north Bristol p.16
Figure 17 Analysis of local urban form in Hays, West London (Green corridors, blue linear townships, red-pink pods analized through the route network pattern) p.16
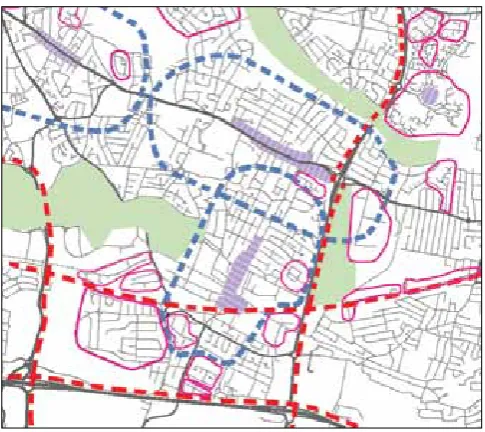
Figure 18 The study area and local form analysis Cambridge Southern Fringe p.17
Figure 19 Northstowe with surrounding villages and Cambridge to the south-east p.18
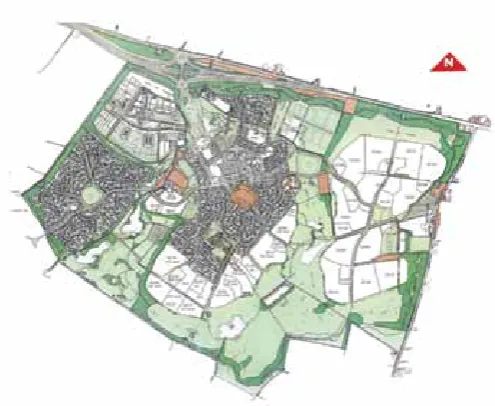
Figure 20 Cambourne masterplan p.19
Figure 21 Northstowe: the ‘Pods’ scenario p.19
Figure 22 Northstowe: ‘Cells’ scenario p.20
Figure 23 Northstowe: ’Linear’ scenario p.20
Figure 24 Northstowe ‘Cluster’ scenario p.20
Figure 25 Newcastle Great Park – baseline environmental assets p.23
Figure 26 Great Park: current planning proposals – equivalent to a PODS scenario p.24
Figure 27 Great Park linear scenario (above). p.25
Figure 28 Newcastle major growth: alternative location – string of neighbourhood cells (below). p.25
Figure 29 Basic context map of the Cambridge East study area p.26
Figure 30 Cambridge East pods scenario (legend applies to all scenarios) p.27
Figure 31 Cambridge East cells scenario p.27
Figure 32 Cambridge East cluster scenario p.28
Figure 33 Cambridge East Linear scenario p.28
Figure 34 Backworth and Shiremoor study area p.30
Figure 35 Retrofit at Backworth – diagrammatic representation of the current ‘pods’ approach in part of the study area, and the alternative principle of pedestrian connectivity p.31
Figure 36 Cambridge Southern Fringe – development areas: the pattern reinforces the existing structure of development while safeguarding green corridors p.31
Figure 37 Cambridge Southern Fringe: pods and cells options: spot the difference! The apparently small variations result in different outcomes p.32
Figure 38 The Broxbourne study area, with the M25 in the south p.34
Figure 39 The quality of bus access in broxbourne p.34
Figure 40 2031 trend map p.35
Figure 41 A new cell neighbourhood and town centre for Broxbourne p.36
Figure 42 The quality of bus access in South Harrow p.37
Figure 43 Intensification in Harrow p.38
Figure 44 Proposed development at Barking Reach p.39
Figure 45 Scenario applying the compact city principle to Barking West p.40
List of Tables
Table 1 Study areas and their locational settings p.10
Table 2 Comparative performance of Northstowe scenarios, once the town is complete p.21
Table 3 Evaluation of the three options presented above p.26
Table 4 Evaluation of alternative Cambridge East scenarios p.29
Reshaping suburbs
for
local and global health
Preface
According to one estimate 86% of England’s population live in suburban areas (Civic Trust 2002). Yet until recently the planning of suburbs was a largely forgotten agenda. Suburbs were assumed to look after themselves. The government has not had an explicit policy for suburban or exurban areas. Rather it has relied on the application of general policies of urban compaction, mixed use, higher densities and brownfield development. However at the same time many urban edge areas have actually experienced something quite different: a continuation of the late twentieth century model of lower density, single use, campus style developments, especially in relation to commercial activity.
The outcome has been increased car-dependence, reduced levels of healthy active travel, and the effective exclusion of many non-car-users from the opportunities and facilities that the car owning majority take for granted. Despite the rhetoric of “sustainable communities”, therefore, there has been little if any progress towards sustainability in outer city areas. Part of this failure relates to a lack of awareness of how best to shape suburban areas as they evolve. With the notable exception of some contemporary designs for new urban extensions, there has been a conspicuous gap in practice and research as to what local urban forms work best.
This paper reports on research which attempted to fill that gap. The research examined a range of suburban, urban fringe and exurban localities in three different city regions: London, Cambridge and Newcastle. Localities selected were identified by local authority partners as having potential for growth over the next 25 years. The localities were analysed in terms of their spatial form, the levels of accessibility afforded to residents, and the behaviour of residents in using and accessing local facilities. Then alternative neighbourhood designs were devised and applied to the localities. The designs were inspired by different urban design philosophies and practice. The research evaluated these options for their likely feasibility and sustainability. The social aspect of sustainability is a particular theme, i.e. the degree to which different designs are likely to provide for local needs, are socially inclusive, and promote health and well-being.
The work reported here was part of the SOLUTIONS research project, which was concerned with the Sustainability Of Land Use and Transport in Outer NeighbourhoodS. This was funded by EPSRC as part of the ‘sustainable urban environment’ (SUE) programme. It ran from 2005-2009 and involved a consortium of universities including Cambridge,
Leeds, Newcastle and UCL. The main focus of the
SOLUTIONS research concerned analysis of strategic land use and transport options for greater compaction or dispersal. The same three city regions were studied at this broader level and the interrelationship between planning at the strategic and the local levels was an important component of the research.
This report concentrates on the results of the ‘local design’ element of SOLUTIONS, undertaken by the University of the West of England, and focuses on suburban neighbourhood form. It compares traditional neighbourhood forms with modern cul-de-sac layouts and linear alternatives. The conclusions are salutary: the optimum neighbourhood form in terms of both feasibility and sustainability depends strongly on context. Traditional neighbourhood designs were sometimes appropriate. Modern cul-de-sac, campus style developments were never appropriate. Linear forms often performed best.
The research also demonstrates that in most cases, current policy has sacrificed good, healthy, sustainable neighbourhood planning on the altar of pragmatism.
Hugh Barton
Director of the WHO Collaborating Centre for Healthy Urban Environments
1.
Research aims and
process
This report deals with the outer city at a
neighbourhood level. It offers a perspective on the future of suburbs. Its central purpose is to explore the appropriate shape and structure of neighbourhoods so as to achieve healthy, inclusive and sustainable suburban environments.
Policy context
The government does not have an explicit policy for suburbs (Kochan 2007). Planning Policy Statements take a broad brush approach, advocating mixed use, higher density compact development without examining what this might mean at a more local level. The Urban Task Force went further in its 1999 report, advocating high density levels and close knit neighbourhood clusters for outer urban as well as inner urban development. The Task Force picture is in tune with the general principles (though not the precise specification) of the urban village movement in Britain, and the new urbanism movement in the United States. Both stress the concept of compact walkable neighbourhoods with mixed housing, permeable grid-based networks, a core of local facilities and good public transport connections. The same principles, but generally at lower dwelling densities, underpinned the earlier British new town model of ‘neighbourhood units’. All contrast markedly with what has actually happened in the last thirty years. British outer suburbs and exurbs are characterised by hierarchical road networks designed for ease of car use, land use segregation, cul-de-sac housing layouts (until very recently) and campus-style commercial and institutional development. This pattern can be observed around European and American cities as well and commonly termed ‘urban sprawl’ (European Environment Agency 2006).
It is well attested that this pattern of suburban and exurban dispersal leads to increased car dependence (Halcrow Group et al 2009; Furguson and Woods 2010). Attendant on that dependence are lower levels of active travel and the disenfranchisement of people without access to a car. But the claims of the alternative forms to be more sustainable and inclusive are not all proven (Bramley 2006). There is an assumption behind government policy that higher residential densities and permeable street networks will create
sustainable communities. There is an assumption behind the Urban Task Force compact model that it will not only improve local accessibility and social interaction, but that it is a practical way forward. There is little analysis of how, in practice, suburban areas can evolve spatially so that greater sustainability is achieved. In other words there is a research gap.
Research aims
1. Suburban retrofit
The first aim was to assess whether suburban and exurban localities that mostly exhibit unsustainable patterns of behaviour could be ‘retrofitted’ for sustainability. The intention was to choose areas where further expansion was planned so that there was a real opportunity for the development of new, more effective, spatial forms. The emphasis within the broad sustainability agenda was on accessibility: the ability of households to access local facilities by foot and public transport systems and reduce their car dependence.
2. Neighbourhood form
The second aim was to contribute to theories of neighbourhood form. The research would identify basic spatial form alternatives, such as those emerging from new town plans and proposals from the Urban Task Force (1999) that could then be used as starting points for the redesign of suburban and exurban localities. The research would assess the degree to which, in real situations, these model forms could deliver a step change in key sustainability criteria.
3. Strategic policy
The third aim was to provide a local perspective on the main strategic studies of SOLUTIONS. The strategic modelling of the three city regions undertaken by partner universities provided a low level of spatial articulation – particularly in the cases of London and the Greater South East and Tyne and Wear. The local studies, while not predictive in the same way, could give insight into the local interpretation of broad strategy and evaluate feasibility and aspects of sustainability performance, drawing on discussions with local partners and stakeholders as well as design analysis. This strategic/ local analysis is not included in the report. It may be seen in chapter 7 of the final SOLUTIONS report on the website.
The research process
The local design research process is illustrated in Figure 1. It was a exploratory and design-led process, applying basic neighbourhood design archetypes (emerging from the literature) to local study areas, and assessing their effectiveness. The support and involvement of the local planning authority was critical to the choice of area, the baseline data and subsequent assessment. Another important input to the baseline situation was the
LPA data
Local Planning Authority consultation/support
LPA and stakeholder workshops
Recommendations for practice Select local study areas in
each strategic case study region
Baseline analysis of each study area
Design spatial framework scenarios based on the archetypes - achieving best
fi t with reality
Compare effectiveness and feasibility of the
scenarios
Draw conclusions Develop and refi ne
theoretical local urban form archetypes
Household survey of use of, and access to local facilities
Accessibility / walkability analysis using GIS
The archetypes cannot normally be directly transferred to actual suburban situations. They have to be adapted and adjusted to reality as possible scenarios of development. The process of deriving the optimum scenarios in each study area is a creative one – essentially experimental. In some instances a number of plans were devised and then rejected or adapted by the designer before submission to more formal evaluation. In some cases the degree of distortion means that particular archetypes could not be applied.
The scenarios were assessed by a combination of
quantitative and qualitative measures, involving the design process, GIS analysis and stakeholder workshops.
• Spatial feasibility was assessed through the design process: is it possible to devise a workable scenario based on the particular archetype? How well does it fit with the land available, the transport networks and the configuration of existing activities?
• Sustainability was assessed primarily from the viewpoint of local accessibility: is the scenario likely to support local facilities and what proportion of households will be living within convenient walking distance of them? The facilities include public transport services, schools, local/district centres and open space. Accessibility was assessed through GIS using a simple threshold approach. Accepted walkable distances were adopted from Shaping Neighbourhoods (Barton et al., 2003), for example 400m
to a bus stop and 800m to a local shopping centre. • Market feasibility and political acceptability were assessed
through stakeholder workshops: is the market likely to respond positively to the opportunities presented by the scenario? Will local public and political interests respond positively or negatively to the scenario? Two main stakeholder workshops were run in each area, one early in the process, when baseline data was available and possible scenarios being considered; the other late in the process, when competing scenarios could be evaluated.
The three city regions were studied in sequence, and performed different roles in the research. Cambridge, which was tackled first, provided the opportunity for refining and testing all the neighbourhood forms in a range of situations. Some consistent findings emerged in relation to the
strengths and weaknesses of the designs. The London study areas were much larger in order to fit with the requirements of the SOLUTIONS strategic modelling. Because all three areas were substantially built up already, they provided insights into current trends, future plans and options in a constrained situation. The Newcastle study areas then allowed various provisional conclusions from Cambridge and London to be tested further.
The content of the report
The report is structured to reflect the conclusions in relation to different settings (new settlement, urban extensions etc) rather than the sequence in which the work was done. It starts by setting out the rationale and character of the local study areas. It then reports briefly on the findings of the parallel empirical research which illuminates household behaviour in each study area (section 3). Then after
presenting the neighbourhood design archetypes, the report examines their application in the series of different locational settings represented by the study areas: new settlements, urban extensions, the urban fringe and established suburbs. The new settlement setting is examined first because it is generally the least physically constrained location and allows the neighbourhood typology to be systematically explored. The subsequent settings are progressively more constrained by the patterns of existing development, so that the possibility of applying urban form theory is limited.
2.
Local study areas
The quality of the research depended in part on working closely with local authority partners who could provide data, insight and practical knowledge, also assisting by drawing in other local stakeholders to project workshops. The partners worked with the research team to identify study areas which could both be illuminating for the research and potentially of benefit to the local authority in its future policy making. The involvement of local partners was valuable in giving greater realism and a practical perspective to the research. But it also proved problematic in some cases because of local political sensibilities. Several partners that were involved early in the process later withdrew as they perceived the research could open up policy debates which might compromise the prevailing policy stance. This was particularly the case in relation to the London case studies.
The actual choice of study areas was therefore a matter of negotiation. Nine case study areas were selected – three in each of the three city regions. Selection was based on a number of criteria:
• variety in terms of location (commuter settlement, urban fringe, established suburb) and socio-economic characteristics
• opportunity for significant new development and/or restructuring of the development pattern
• a range of planning contexts, from plan-led to development-led
• the wishes of local authority partners
• coincidence with individual land use and/or transport zones in the LUTM used by SOLUTIONS.
The study areas are briefly described below. They vary greatly in scale across the three city regions in order to accord with LUTM zone size (thus potentially allowing statistical comparisons) and reflect context – from 5-10,000 population, or roughly equivalent to one neighbourhood, in Cambridge, to 60-80,000 in London. This variation has necessitated different approaches being adopted in the case study cities.
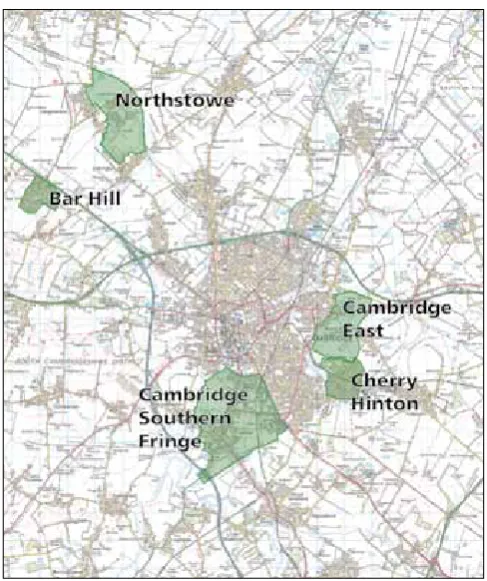
Cambridge
• Northstowe – proposed new town of 20-25,000 people to the north-west of Cambridge, within easy commuting distance, designed to take the pressure off the rapidly growing city – mainly occupying a former airfield, and adjacent to two existing villages. Proxy survey area: Bar Hill (an existing exurb with a local centre).
• Cambridge Southern Fringe – mixed age development along two southern radials, based around Trumpington village and Addenbrookes hospital – very varied population – some facilities locally and the shortest average trip distance of any survey area.
• Cambridge East – proposed major urban extension, close in to the city, on existing airport site – plans for a new cultural quarter – proxy survey area just to the south: Cherry Hinton – with the highest share of non-motorised trips of any survey area.
London
• West Barking – established suburb of mixed age, mainly early to mid twentieth century, including Barking town centre – the poorest area studied, with the highest proportion of social housing and the lowest car
ownership – under-going planned regeneration as part of the Thames Gateway.
• Broxbourne – linked ‘exurban’ settlements to the north of London of varied age including late twentieth century, strung out along the A10, cutting through the green belt – socially mixed population with very high car ownership and the highest car dependence of any study area – current plans relatively short-term and based on infill. • South Harrow – archetypical, well-established suburb –
[image:10.595.296.540.201.492.2]early development around tube stations and later (mid century) low density semi-detatched filling in all around – mixed population, some very affluent, with strong Asian minority – plan largely based on pockets of higher density renewal.
Tyne and Wear
• Newcastle Great Park – major urban extension to the north of the city, straddling the A1 trunk road, partially built – relatively rich with high car ownership.
• Backworth and Shiremoor – urban fringe area with sporadic pattern of development including old mining villages, council estates and more recent
private-ownership estates – mixed population, relatively deprived but quite high car ownership.
• Scotswood – partly nineteenth century terraces, partly early twentieth century suburb – very substantial areas demolished, some rebuilding to a long term regeneration plan – poor population, high deprivation.
Overview
[image:11.595.57.480.82.367.2]The original hope was to study one established suburb, one urban extension and one new settlement in each city region and this is reflected in the choice of the three Cambridge study areas (see Table 1). In the event it was not possible to achieve this – for the reasons explained above – in the other city regions. Scotswood was a late choice and is excluded from the analysis here for two reasons: it can only marginally be classified as ‘suburban’ rather than ‘inner urban’; and we do not have data about resident behaviour that is available in the other areas. Nevertheless across the remaining eight areas there are striking contrasts and parallels, and together they present a good test of alternative design strategies.
Figure 3
The three London study areas
Figure 4
The Tyne and Wear [image:11.595.54.472.575.802.2]Locational settings City regions
London Cambridge Tyne and Wear
New settlement Northstowe
Major urban extension Cambridge East Newcastle Great Park
Urban fringe Broxbourne Cambridge Southern
Fringe
Backworth and Shiremoor
Established suburb West Barking
Harrow South
Scotswood
Figure 6 Modal split by distance band for all trips
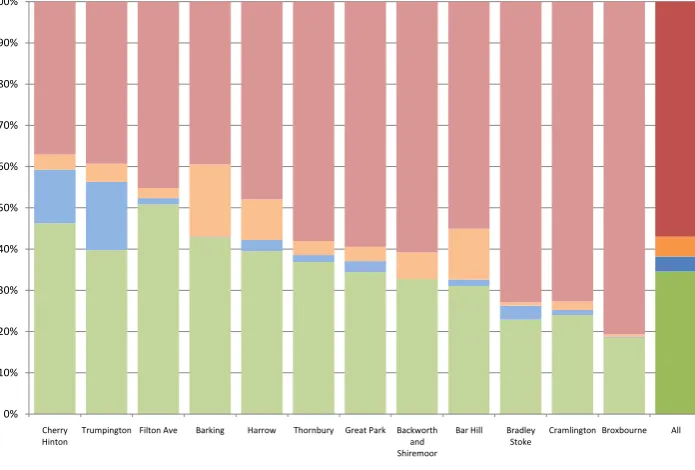
Figures 5 and 6 sum the results across all twelve survey areas. This is not entirely a fair picture. An important finding is that the behaviour of residents in the different suburbs and exurbs varies very significantly (see figure 7). There is no standard pattern of car dependence. The level of personal motorised transport use varies from 36% to 82%, while conversely active travel varies from 62% of trips to 18%. Four of the original 12, Cherry Hinton, Trumpington, Filton Avenue and Barking, stand out as having higher levels of walking and cycling than the norm. Analysis of the data – both socio-economic and spatial – reveals some of the reasons. The first two are in Cambridge city, where facilities (including one superstore apiece) are reasonably close and there is a distinctive culture of cycling, not reflected in the other areas. Filton Avenue in Bristol has no such culture, but the most convenient disposition of facilities of the set. Barking study area is unusual in having quite long trip lengths but high levels of walking. This reflects on one hand the relative poverty of the area, and lower car ownership, and on the other, poor levels of local facilities. Many people in Barking have no choice but to walk well over a mile to get to vital facilities.
At the other end of the spectrum is Broxbourne. The surveyed area in Broxbourne is an area of suburban sprawl (a legitimate term in this case), lacking focus and poorly related to the main urban area. It shares with two of the other areas surveyed (Bradley Stoke and Cramlington) a layout based on the assumption of full motorization.
The factors which stand out as critical in determining the level of active travel and car use are distance to facilities and levels of car ownership. The latter accounts for much of the variation between households, but – because high car ownership is now widespread even by those on modest incomes – it does not generally account for the variations
3.
The SOLUTIONS household
survey
All the eight remaining local design study areas are paralleled by household surveys, the results of which are reported on the SOLUTIONS website under the title Active travel patterns and neighbourhood accessibility. Except for the two Cambridge study areas noted above (where nearby localities provide an insight into possible behaviour in proposed settlements) the survey provides direct insight into local behaviour. It also included four other neighbourhoods, one a new town to the north of Newcastle, the other three an older suburb, an urban extension and a commuter town in the Bristol area.
The survey captured responses from 1600 households at a response rate of about 30%. Comparing the results with those from the National Travel Survey, the survey covered 45 % of total household trips, and shows a good match with the NTS where the two surveys coincide in terms of trip purpose. The survey areas vary widely in spatial characteristics and in social mix, giving a fair representation of current suburban/exurban behaviour.
One general finding of this research is the alarming degree to which most of the suburbs and exurbs surveyed are not offering adequate local services locally, and are therefore highly car dependent. The first chart shows the proportion of trips made for different purposes that are within 800 metres (circa two thirds of trips on foot) and 1600 metres (circa one third of trips on foot). The second chart shows the proportion of active travel trips by distance band for all purposes studied. The implications of this paucity of local facilities for levels of active travel, for social exclusion and for emissions are evident and re-emphasize the need for suburban sustainability retrofit.
245 630 1186 197 50 103 2411 620 525 1332 298 169 165 3109 1642 464 2900 853 384 357 6600 0% 10% 20% 30% 40% 50% 60% 70% 80% 90% 100%
Food - Superstore Food - Other Other services Indoor recreation Outdoor recreation School Overall split 0 - 800 800 - 1600 > 1600
0% 10% 20% 30% 40% 50% 60% 70% 80% 90% 100%
0 - 400 400 - 800 800 - 1200 1200 - 1600 1600 - 2000 2000 - 2400 2400 - 2800 2800 - 3200 3200 - 4000
Walk Cycle Public transport Personal motorised
between places (the exception is Barking West, as noted above). By–an-large people in all areas rely on their closest facility, so the actual location of facilities (superstores, other food shops, convenience services, schools) in relation to homes is very important. Together these trips account for 94% of the trips reported. There is a different pattern for recreation and leisure trips (the remaining 6%) – both to facilities like pubs, clubs and restaurants, and playing fields, parks, woods. In these cases facilities tend to have specialised characteristics and often people do not choose the closest.
Across different neighbourhoods and different social groups there is a surprising degree of consistency of behaviour in relation to the distance people are prepared to walk, and their choice of mode according to distance. For example respondents in two suburbs of Bristol, one with very high car use and the other relatively low, the difference in modal choice is not because one community is willing to walk much further than the other, but because the number of facilities within easy walking distance is very different.
It is also note-worthy that the variation in facility provision is not due primarily to the factor most commonly highlighted in the literature – i.e. density. Figure 8 relates gross density of the residential area surveyed (excluding extraneous zones) with the level of active travel, and demonstrates the weak relationship. The age of the area, urban form and street pattern are much more significant. Neighbourhoods that have an integrated and interlinked form, and a permeable street pattern, perform the ‘best’. Those based on
segregated site development and tree, or cul-de-sac layouts, perform the ‘worst’. This conclusion is consistent with (and goes further than) other recent studies in America (Lee and Moudon 2008).
Figure 8 Scatter diagram of neighbourhood density against percentage of active travel
There are clear lessons from the empirical study. Local urban form is important. If neighbourhoods can be planned so that facilities are viable locally and accessible by foot – within certain distance thresholds – then there will be more active travel, a more socially inclusive environment and greater opportunity for people to cut car use and carbon emissions. The potential contribution of local trip making is not marginal – 45% of trips were captured by the survey, and that did not include all trips that could be local (for example visiting other people’s homes). This belief, underpinned by the results of the household survey, is central to the evaluation of alternative long-term designs for the study areas.
0% 10% 20% 30% 40% 50% 60% 70% 80% 90% 100%
Cherry
Hinton Trumpington Filton Ave Barking Harrow Thornbury Great Park Backworth and Shiremoor
Bar Hill Bradley
Stoke Cramlington Broxbourne All
[image:14.595.52.400.91.326.2]Walk Cycle Public transport Personal motorised
Figure 7 Modal split in each study area in rank order of active travel
0.00% 10.00% 20.00% 30.00% 40.00% 50.00% 60.00% 70.00%
10 20 30 40 50 60 70 80
%
o
f tr
ip
s
wal
ke
d o
r c
yc
le
d
Population density (people per hectare)
Population Density : % of active travel (trips)
strong role. Attributes such as size, density, use, access and building type, are market led. Socially driven agendas such as provision of public open space, community facilities, quality of the public realm are only addressed where regulation dictates or local planning places constraints.
“Cells”: neighbourhood units, locally self-sufficient
The cell archetype is very different in that it stems from community design principles rather than engineering or market principles. The “neighbourhood unit” was the term used in the mid-twentieth century, especially by the British new towns movement, to signify a distinct, bounded,
Figure 9 Pods
4.
Neighbourhood design
archetypes
Four basic archetypes, representing contrasting neighbourhood forms, have been selected from study of current and traditional practice in the UK. They are derived from distinctions drawn by Barton in Sustainable Communities (2000) and amplified by Barton, Grant and Guise in Shaping Neighbourhoods (2003). Three are promoted by various advocates as good models of neighbourhood form: the neighbourhood unit or cell, the high density neighbourhood cluster, and the linear township. One is based on prevailing practice in the late twentieth century: car-oriented campus and cul-de-sac development, which we have called “pods”. In order to clarify their distinct characteristics, the archetypes are described in this section in their pure form. Later, when they are applied to real situations, some distortion of the pure form is often inevitable.
The archetypes once applied give rise to a series of development scenarios. Each archetype can be used to describe existing forms as well as proposed forms, and derives from a different development or design philosophy.
“PODS”: use-segregated, car-oriented, campus and cul-de-sac developments
This pattern of use-segregated dispersal is typical of many outer city areas developed in the last 40 years. Particular sites are developed independently for different purposes, with no attempt at neighbourhood planning. They are campus-style developments, of very varied sizes, with buildings typically surrounded by car parks and landscaping. Each pod is separately accessed by cul-de-sac or loop-road off the main road system, so that there is no or limited direct connection between them. They may be business parks, retail parks, schools universities, hospitals, or industrial estates.
Residential areas may also be pods – limited access estates, lacking local facilities, gated if affluent.
This form is the most versatile, in that it can be found in the widest range of scales and sizes. Single pods can be anything from 1ha, say a small residential development of 20 houses, to 500ha, a large business park campus. Since the pods are designed as independent developments, they can be found as one-offs, e.g. infill development, or spread over a wide edge-of-city area, offering many of the activities of a town, but without the spatial integration or pedestrian accessibility that makes a town function.
[image:15.595.310.552.213.668.2]The structure of land ownership and the hierarchy of road systems tend to shape the pattern of pod development (see Figure 10). Within that context market forces play a very
residential area with a local centre (the ‘nucleus’ of the cell). The size range, as illustrated in new and expanded towns is 4-10,000 people, and is defined by walkable distance. Many outer city estates, especially mid century council estates, adopted this model. It can also be equated with village communities, and like a traditional village it should be centred on some local shops, a school, pub, church and community centre. It still provides the common image of a “neighbourhood”.
Figure 11 Cells
Cell neighbourhoods come in a variety of forms. The normal image is of a ‘closed cell’ (Barton, 2000), with main roads, industrial areas, open space and playing fields defining a distinct boundary, giving it a separate identity from adjacent areas. Such neighbourhoods may sit astride a main distributor road (‘on-line’) or lie to one side, with limited access (‘off-line’). The latter are distinguished from simple pods by their mixed-use character.
The on-line neighbourhoods are more integrated than the off-line with the rest of the town, with the potential for more direct bus services and a local centre able to benefit from passing trade. In many actual situations an on-line cell is not physically separated from surrounding localities: permeability is greater, so although there is a clear core area its edge is fuzzy. This may be called an ‘open cell’. It can be equated with the ‘transit oriented developments’ (TODS) of American planning, where a main public transport stop provides the focus for a cluster of local facilities and medium density housing within the low density suburban sprawl.
The cell neighbourhood is more restricted in size range than pods, and normally much bigger. Its scale is given on the one hand by the need to support local services, and on the other by the distance that is walkable.
The design parameters vary according to context. For example a neighbourhood based on a secondary school will be larger (say 8,000 people) than one only supporting a primary school (say 4,000 people). The accessibility standard used by designers (the distance from edge to centre) conventionally varies from 400 to 800 metres. Density,
[image:16.595.296.540.166.453.2]too, can vary. Early designs for last century, aspiring to the ‘garden city’ image, were low density. Better accessibility and environmental sustainability can be achieved when density is graded with higher densities towards the centre.
Figure 12 Mid century neighbourhood cell in north Bristol
“Clusters”: a group of interlocking neighbourhoods
Figure 13 Clusters
This archetype does not currently exist in outer city areas. It is evident in some inner cities (see Figure 14), though always in a rather distorted form, and frequently suffering from declining population. The idealised pattern of 6 tributary cells and a hub would make seven cells of 4000 totalling 28,000. Density is graded with higher densities towards the centre of each open cell. The district cell has the highest densities, matching those of the local centres at its periphery but grading even higher towards the core. In the interstices between the cells, lower density uses such as schools and green open space are sited.
“Linear Townships”: linked neighbourhoods along a high street spine
The linear form is evident in many older suburban areas where development occurred along main radials well served by tram or bus. In this archetype the neighbourhoods may merge into each other and rather than being centred on a local centre, they are bounded by the ‘uniting seam’ of the high street. Some older high streets have declined because of falling hinterland population, congested streets and lack of parking, though others (such as those studied in South Harrow) are thriving.
The historic linear form has been adapted and re-defined in some new/expanded town designs – for example Peterborough – and advocated as a sustainable model because it aims to maximise public transport efficiency and the coherence of the green network (e.g. Tjallingii, 1995; Barton, 2000). The form is based on the supposition that for many purposes city (rather than local) trips are critical, and the structure of the town reflects that.
Figure 15 Linear
Density is graded with increasing densities towards a central public transport corridor and around transport interchange nodes (see Figure 7.16). Mixed use is found in these higher densities. Facilities are located on the central road corridor with some freedom of position. The lowest density is represented by a linear accessible open space should run alongside the township. This open land could also contain a parallel non-congested road bypassing the main central road but giving intermediate access to it. The central road will have the local traffic slowed down by the good access to shops and facilities.
As an urban continuum the form could contain populations of between 20,000 to 40,000, covering some 1 to 3 km. The linear form is not continuously even but characteristically displays a series of fuzzy neighbourhoods – the boundaries of which are dynamic in time. The diagram shows a ‘single strand’ of development but can also be developed as ‘double strand’ along two parallel transport routes. There are high levels of permeability (particularly for non-motorised movement) between neighbourhoods.
[image:17.595.57.300.450.769.2]Figure 16 Linear township along a main radial, with neighbourhoods either side of the high street, in north Bristol
Applying the archetypes
The typology described above enables the planner to analyse the form of settlements at meso level: i.e. above the level of streets and blocks but below the scale of overall urban form. Abstracting to this level is important in order to understand the internal structure of the town and city. It is of course inevitable that some areas do not fall neatly into one of the four archetypes. Especially in suburbia there are areas of ‘sprawl’ that lack focus or shape. Equally there are areas which do not conform to the archetype but hint at it. There are many failed linear districts, for example, with a strong radial spine route but lacking the facilities that the local population in theory justifies. Having identified such a failed township it is then a question of why has it failed, and how could its apparent potential be realised.
The map of Hayes (London) in Figure 17 illustrates the application of the typology at a broad scale. The dominant features are the linked linear townships that have grown up along main roads – either historic radial arterial roads or streets giving access to an important station. To some extent these linear townships are paralleled by linked green spaces to their rear. There are no nucleated clusters of neighbourhoods, nor are there any planned neighbourhood cells. But there are many examples of pods – normally more recent development. Some are simply long cul-de-sacs, and
may be part of a larger form. Others are whole industrial or residential estates with limited access points.
Once the basic forms are recognised, they can be used to trigger forward plans. In Hays the strength and importance of the linear townships is such that they need to be
sustained and enhanced - despite their focus on main traffic arteries which compromise environmental quality. The parallel green spaces could be evaluated for the opportunity to intensify and grow into real neighbourhoods, and thus extend the proportion of the population with good levels of accessibility to facilities. There are other areas, often of more recent development, and including some pods, which look like potential cells. They were not designed as such, and currently lack adequate local facilities, but have the kind of layout and size that might make evolution into a cell feasible, given some renewal and new development. The isolation of the pods could be gradually reduced as development opportunities present themselves.
The Hays example covers a wide area. The map and diagrams of the Southern fringe of Cambridge in Figure 18 illustrate the application of the archetype analysis at a more local level. The main neighbourhood, Trumpington, is an on-line cell made up of a series of pods (mostly residential). The rest of the area is dominated by pods – including the huge hospital of Addenbrookes (to the right). It is clear that a key part of any planning strategy would be to increase permeability/connectivity, thereby shortening trip lengths and increasing potential pedestrian catchment for facilities.
Figure 18 The study area and local form analysis Cambridge Southern Fringe
(Note the Trumpington neighbourhood cell with internal pods,
and the huge pod of Addenbrookes Hospital to the east). KeyHollow red - residential pods
Filled red - commercial and institutional pods Blue - retail centre
5.
Designing a new
settlement
NORTHSTOWe
We now turn from principle to application. This section, focusing on the design of a new settlement, is intended to illustrate and clarify the nature of the archetypes, while at the same time shedding light on the question of the sustainability of a new town. The archetypes, in application, become scenarios for possible development patterns. Northstowe is ideal for this because it is the simplest case study – on a relatively straightforward, level site which can allow the archetypes to be expressed with minimum distortion. The typical advantages and disadvantages of each can therefore emerge clearly.
Northstowe, Cambridgeshire is particularly appropriate because it has been held up as a test bed for the idea of eco-towns. Lessons which emerge may well have application beyond the specific case. Northstowe is a new settlement to be built largely on open land. It allows further clarification of the nature of the archetypes. It is nine kilometres to the North East of Cambridge, adjacent to the existing villages of Longstanton and Oakington. The main justification for the location is the potential to reuse a brownfield site (an airfield) and to serve the settlement by a new guided busway on an old railway line linking to Cambridge. The site has a capacity of up to 10,000 dwellings. English Partnerships and Gallaher submitted an outline planning application
in December 2007 for 9,500 new homes, a town centre, employment areas and schools to create a community of up to 24,000 people. Detailed planning applications were submitted for road links and improvements. The Cambridgeshire guided busway has since won grant and commenced construction.
In order to find a settlement which might give insight into future travel behaviour in Northstowe, we had to look beyond the adjacent villages. The household survey included the Cambridgeshire ‘exurb’ of Bar Hill, as a rough proxy. Bar Hill exhibited an unusual pattern of travel to ‘local’ facilities. Convenience trips were dominated by the huge local superstore: food trips were relatively short, as were primary school trips. However, many trips had to be much longer than average in order to reach facilities – mainly in Cambridge. The modal split was overall low for active travel (33%), high for public transport (19%) and average for private vehicle use (47%). The conclusion is that Bar Hill currently is not large enough to support a full range of local facilities, forcing longer distance travel. Bus services do, however, capture a quite large proportion of the longer trips because of the focus on one key destination: Cambridge city centre. This pattern of trips at Bar Hill could well indicate the future trip pattern at a partially completed Northstowe.
The new settlement of Cambourne (see Figure 7.20), also in the Cambridge hinterland, provides further insight. In some ways Cambourne is comparable to, and a direct precursor of, Northstowe. Research into the attitudes and behaviour of residents and local stakeholders are revealing (Platt, 2007). Most consider the settlement is overall a success, liked for the quality of its environment and its social milieu. But in relation to sustainability it has failed in several ways. First: the intended balance of jobs and people has not so far materialised; only 21% of people consulted thought the settlement was economically thriving. Second: the dominant pattern of out commuting has resulted in high car dependence (81%) by comparison both with Cambridge itself (42%) and with the rest of South Cambridgeshire District (78%). Third: the lack of a secondary school means reliance on bussing and reduction in local integration. Fourth: the lack of one strong centre compromises the ability of the settlement to offer town-level services.
Figure 20 Cambourne masterplan
Cambourne was designed as three linked ‘villages’ or neighbourhood cells, attractive in themselves. But the population of each cell is not sufficient to support many services. Even when combined it takes many years for key catchment thresholds to be reached, and meanwhile residents adopt habits of travel out of settlement, with consequent high car dependence.
The evidence from both Bar Hill and Cambourne is that new settlements do not easily establish themselves as towns, with a full range of facilities and work opportunities, restricting the options for residents. Longer distances are likely to be car based and overall car use high unless good and convenient bus services can be established. If we are to believe that Northstowe will be different from this, then the reasons will need to be compelling.
Applying the archetypes to Northstowe
Each of the archetypes was applied to the site in as consistent a way as feasible. The process of design was experimental – searching for good solutions that maximised the benefits while minimizing the disbenefits of the archetype. A number of features were held constant, so that the comparison between archetypes depended as far as possible on form.
• All scenarios protected valued environmental assets and ensured as good residential access to greenspace as the archetype allows.
• Public transport services were held constant. A high quality guided bus service (as planned in reality) was assumed through the length of the site.
• Commercial and retail facilities were optimally located in relation to the form and dominant transport modes. • One secondary schools was located in a convenient
central position for bus and bike access, normally adjacent to greenspace.
• Primary schools were provided in proportion to population (one per 4,000 people) and distributed as evenly as possible, always close to greenspace.
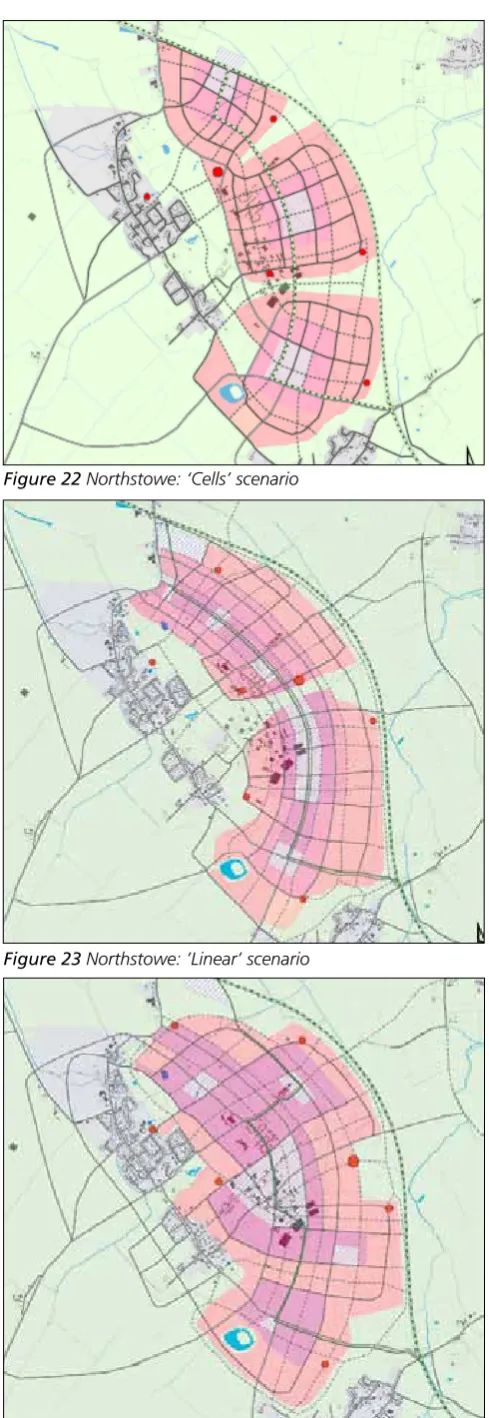
[image:21.595.47.295.56.259.2]The pods archetype is market-led, so the whole new town area was allocated for development except for green buffers around the existing villages (figure 21). Each pod was treated as separate development parcel, with a specific land use. Pods varied in size according to context, and density was left to the market (a moderate average density was assumed for calculation purposes). Retail and business pods were located at either end of the development to catch trade from neighbouring settlements and be more accessible to the main road system. Being car-oriented they were low density. Social facilities, including the secondary school, were located centrally, as a planning requirement. Each pod was provided with direct vehicle access off the main distributor roads. The planning authority also required an extra pedestrian connection between adjacent pods to increase permeability.
Figure 21 Northstowe: the ‘Pods’ scenario (key applies to all)
Cell, cluster and linear forms all create intentional neighbourhoods (figures 22, 23, 24). A number of design features are shared between them. The local centres and
town centre are all compact, mixed use and pedestrian-friendly. They include retail, business, social and leisure uses, plus higher density housing – flats over other uses. Residential densities are graded from high in the core areas to moderate on the fringe, so as to maximise pedestrian accessibility while providing housing choice. The residential areas include other uses such as primary schools, playgrounds surgeries workshops, small parks. The densities quoted are therefore gross not net.
The street networks are based in all three cases on a 100 metre grid, adjusted to suit the situation. Every second or third street is a distributer road (i.e. a through traffic route). The other streets are all traffic calmed, designed for cycling and pedestrian priority and having the character of home-zones.
The key differences are in terms of shape. Each cell is designed to fall within the 5,000-10,000 population range, and with maximum radius of 800m along the streets. As the diagram illustrates, there are three distinct neighbourhood cells in the Northstowe design. The cluster is designed with a town centre and six sub-centres, two of which are within the old village of Longstanton, integrating them into the town. The cluster has a maximum radius, along the street network, of 1,500 metres. The rationale of the linear design is public transport accessibility: there is a maximum depth (along the streets) of 600 metres, and some freedom of location for businesses and facilities to locate anywhere along the high street (figure 23).
Comparing feasibility
[image:22.595.296.541.75.785.2]The pods model can be adapted to fit the Northstowe site without problem. The form is flexible and can react to changing market pressures over a period of years. Stakeholders considered that this scenario would have a fair chance of attracting car-based retail and business park activity. But it was also clear that it ran counter to current policy guidelines. The neighbourhood cells model was also relatively straightforward to apply: three linked cells along the guided busway, maintaining the separation (locally desired) from the existing villages. They could be constructed sequentially. The only major reservation concerned the viability of retail centres in each cell, with limited catchment population. The linear township overcomes this problem by developing the site as one settlement rather than three. The site lends itself to this linear model, and the official proposals are not dissimilar. Stakeholders considered the linear option to be feasible and acceptable. The cluster model is more problematic. It solves the catchment problems by integrating neighbourhoods into a nucleated town with a strong mixed use heart. But the form requires absorption of the adjacent village of Longstanton into the design. In the abstract this makes good sense, but stakeholders considered it was unacceptable because of the loss of village identity.
Figure 22 Northstowe: ‘Cells’ scenario
Figure 23 Northstowe: ’Linear’ scenario
Comparing sustainability
The sustainability performance was estimated. The scale of change proposed is large. The existing population of 2,900 increases to between 17,000 (the pods scenario) and 24,000 (the cluster scenario) with the other midway between and similar to official plans. The difference is accounted for different densities, reflecting different transport priorities. The cluster option is thus about 40% more efficient in its use of land; other things being equal it could provide for a longer period of development. There is also a large differential in terms of accessibility. This is to be expected when the archetypes can be more-or-less fully realised, as at Northstowe. The cluster scenario was the best for retail access; linear was by far the best for public transport; linear and cluster both performed reasonably well for school access; cells and linear were best for open space access. Overall the linear option was clearly preferable in terms of accessibility, and therefore also in terms of social inclusion and physical activity. The pods option, despite being designed with some pedestrian permeability, performed worst on every count. While accessibility, given certain assumptions, is a matter of metrics, viability of services is more a matter of judgement. While linear gives the best chance of supporting good quality public transport, the viability of local retail services might be best in the cluster model (it gives the highest pedestrian catchments). But the separation of services into a number of smaller centres in both the cells and cluster could be a recipe for failure according to stakeholders. It is quite likely that the main cluster centre would pre-empt the growth of the sub-centres, thereby undermining the logic of the design. The pods version, while scoring badly in terms of local pedestrian accessibility, is designed with the catchment of neighbourhood villages in mind, and might therefore be the most commercially successful.
Location
The question of location raises a more fundamental issue relating to the function of the new settlement. With a prospective population of 20-25,000 it is intended to be a town with a good degree of autonomy, offering services and jobs to its people. The problem, as noted in relation to Cambourne, is that the population grows to that level over many years, and initially critical catchment thresholds are not achievable. A cursory acquaintance with the geography of towns, however, leads to the realisation that successful towns are at the hub of the transport networks, have a hinterland of tributary villages, and the potential to attract commercial and institutional investment, thus jobs, on a scale commensurate with population.
Northstowe as currently conceived does not appear to match the pre-requisites for a sustainable town: it is three kilometres from the main road system; while it does have one high quality public transport link, this will only cater for a minority of longer distance trips; it is poorly connected some of the surrounding villages. If it is to be a town not an exurb with high car dependence it will need a special attraction (such as a part of Cambridge University). The surrounding villages could also help: those within easy cycling distance have a population of 20,000 (2001 Census). If well connected so as to experience the gravitational attraction of the new town, they could provide a head-start for many services.
Grading the scheme against sustainability criteria
EXCELLENT The criterion is fully satisfied
GOOD The criterion is generally satisfied
NEGOTIABLE Success depends on further work and negotiation
PROBLEMATICAL Not likely to be satisfactorily fulfilled without major
reassessment UNACCEPTABLE The criterion cannot be
satisfied
CRITeRIA PODS CeLLS CLUSTeR LINeAR
Efficiency in use of open land
Accessibility to local services
Accessibility to schools
Access to public transport
Access to open space
Level of active travel
Local transport carbon emissions
Likely retail viability
Political acceptability
Market feasibility (overall)
Conclusions
• The location and land allocation of Northstowe tend to undermine the aspiration to make it into a town • the potential of nearby villages to help seed and grow
town-level services depends on the quality of street connection, including safe bike routes and bus services • current travel patterns of settlements at Bar Hill and
Cambourne suggest Northstowe will experience high car dependence and high out commuting
• indications from the earlier Cambridge Futures LUT modelling suggest the guided busway will only be able to capture a small proportion of that tidal commuting • in relation to the specific site, its shape has effectively
pre-determined the most efficient neighbourhood for which in this case is linear. The merits or otherwise of the four forms are summarised in the chart below (see Table 3)
• both the linear and the cluster models (or some hybrid) can work effectively as new town forms, given the appropriate context. The cells archetype has certain strengths but is more problematic overall because of the focus on ‘neighbourhood’ not ‘town’.
6.
Major urban extensions
The SOLUTIONS research examined two areas where major urban extensions have been planned by the local authorities: Newcastle Great Park and Cambridge East. Newcastle Great Park is already being developed in an edge of city location. It is a relatively straightforward scheme along conventional lines. Cambridge East remains on the drawing board, pending closure of the airport, and is close in to the city. The surveys of existing residents (or nearby residents in the Cambridge case) reveal very different patterns of behaviour. The Newcastle residents are among the most car dependent, while those in Cambridge were among the least car dependent. Each is examined below in turn, highlighting some of the key design choices and their implications.
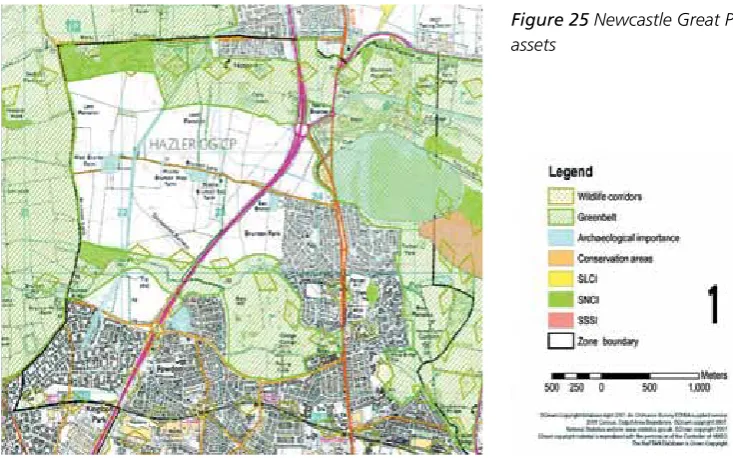
NeWCASTLe GReAT PARK
“Newcastle Great Park” is a major urban extension of about 5 square kilometres, to the North of Newcastle. Significant development has already occurred but the majority of the land is still green fields. The site straddles the A1 trunk road, with the core of the site to the West. It is about 2.5 km from the nearest Metro station at Kingston Parl. The whole area benefits from closeness to Newcastle Airport, making it a desirable location for commerce and housing.
Like Northstowe, Great Park offered the opportunity of fresh thinking about neighbourhood design. SOLUTIONS used it as a context for testing the alternative scenarios, also taking further the issue of location and site choice. The main existing developments within the Great Park were incorporated in all designs. However, the researchers allowed themselves some flexibility at the margins in order to articulate the archetypes more fully.
Designing the scenarios
Official plans for whole site were (at the time of the research) not available as an integrated masterplan. The approach of the local authority was more about pragmatic incrementalism. The emerging pattern of development is at much higher average densities than the older suburbs, but continues the tradition of use-segregated car-based campus development, with limited permeability between sites. One benefit is the ease of managing the development process, parcel by parcel, pod by pod (see Figure 7.28). The original intentions were to construct a high quality public transport route to serve the new development; this good intention has so far been frustrated by implementation problems. For the research exercise we assumed a modest bus service commensurate with the population easily accessible to it.
[image:25.595.56.423.572.801.2]The research explored all the other three scenarios, but here looks just at the most successful. The linear scenario (figure 27) is much more complex than the current strategy. It requires the careful integration of new development with the old, including the improvement of the potential public transport spine down to the Metro station at Kingston Park. Kingston Park becomes the main hub of activity, where residents transfer onto the regional rail system, implying eventually the comprehensive redevelopment of the retail sheds near the station into a pedestrian-friendly district centre. Optimisation of the linear form would also mean redefining the boundaries of the Great Park development area so as to reflect the logic of the form better. The linear scenario uses land considerably more efficiently than the current plan, without sacrificing access to open space, and therefore could cater for a higher eventual population.
© Crown copyright / database right 2007. An Ordnance Survey / EDINA supplied service. 2001 Census Output Area boundaries. © Crown copyright 2007. National Statistics website: www.statistics.gov.uk. © Crown copyright 2007. Crown copyright material is reproduced with the permission of the Controller of HMSO. The NaPTAN Database is Crown copyright.
GREATPARK TREND
1:25,000 0 250 500 1,000 1,500Meters
Legend BusStops Metrostops PriSchools SecSchools SegBusStops MetroLine NewBusRoute NewSegBusRoute
[image:26.595.44.457.84.339.2]LandUse Industrial Open Green Space Residential High Density Residential Medium Density Residential Low Density Mixed Use High Density Retail Only Demolition Leisure Use Zone Boundary
Figure 26 Great Park: current planning proposals – equivalent to a PODS scenario
Comparative performance
The comparison between the official plan (akin to the pods archetype) and the linear scenario reinforces the lessons of the Northstowe case study. The contrast in terms of accessibility and social inclusion is stark. The majority of households in the pods option would be beyond the accessibility thresholds for public transport, schools and retail centres. The effect would be to perpetuate the pattern of high car dependency and low levels of active travel.
Conversely the linear option (figure 27) succeeds in achieving excellent accessibility to public transport, schools and local centres. If the behaviour of future residents mirrored those surveyed in terms of their modal choice in respect of distance, then much higher levels of active travel and much greater social inclusion would be achieved. However, this assumes that the development could be completed in a reasonable timescale. Current rates of growth of Great Park do not give grounds for confidence, and it might well be that the linear plan is still-born, failing to realise its potential.
The main disadvantage of the linear – as with other scenarios – for Newcastle Great Park is reliance on major capital investment in the public transport link. Even with such a link residents would have to transfer onto the sub-regional rail system in order to reach major centres. This journey break would be associated with a time penalty, compromising public transport competitiveness. So the question arises as to why the Great Park area was selected for a major urban extension in the first place. In principle there is a better alternative. The Metro between Kingston Park and the Airport has three stations with development potential, and a parallel dual carriageway, presenting an
apparently superior opportunity. The scheme illustrated is a linked series of neighbourhood cells, creating the “beads on a string” model (figure 28).
The string of cells in the alternative development zone along the Metro also performs well in theory. It has the huge advantage of being tied directly into the existing sub regional rail network; it therefore has much better opportunity of achieving its goals. Presuming the stations were the trigger for local facility provision, then pedestrian access would be good; distances by car and van to other parts of the conurbation are comparable to the Great Park, but longer trips by public transport would not require change from bus to train, thus would be much more attractive
Table 3 (overpage) summarizes the evaluation of the three options.
Decisions on the location and disposition of land released for Newcastle Great Park were not, evidently, taken on the basis of optimum urban form or sustainable development (see Table 4). The reasons perhaps had more to do with minimum environmental constraint, political and land
© Crown copyright / database right 2007. An Ordnance Survey / EDINA supplied service. 2001 Census Output Area boundaries. © Crown copyright 2007.
National Statistics website: www.statistics.gov.uk. © Crown copyright 2007. Crown copyright material is reproduced with the permission of the Controller of HMSO. The NaPTAN Database is Crown copyright.
GREATPARK PLUS+
CELLS WEST
1:35,000
0 250500 1,000 1,500 2,000 2,500Meters
Legend BusStops Metrostops PriSchools SecSchools SegBusStops MetroLine NewBusRoute NewSegBusRoute LandUse Industrial Open Green Space Residential High Density Residential Medium Density Residential Low Density
Mixed Use High Density Retail Only Demolition Leisure Use Zone Boundary
ownership factors. The result is a scheme which is in its early stages very car dependent. There is no reason to believe this will change as development proceeds. Newcastle Great Park is likely to compound problems of physical inactivity, social exclusion and high levels of greenhouse emissions, and fail to give opportunity for the sustainable lifestyles which are an objective of the planning system.
© Crown copyright / database right 2007. An Ordnance Survey / EDINA supplied service. 2001 Census Output Area boundaries. © Crown copyright 2007.
National Statistics website: www.statistics.gov.uk. © Crown copyright 2007. Crown copyright material is reproduced with the permission of the Controller of HMSO. The NaPTAN Database is Crown copyright.
GREATPARK PLUS+
LINEAR EAST
1:35,000
0 250500 1,000 1,500 2,000 2,500Meters
Legend BusStops Metrostops PriSchools SecSchools SegBusStops MetroLine NewBusRoute NewSegBusRoute LandUse Industrial Open Green Space Residential High Density Residential Medium Density Residential Low Density
[image:27.595.59.536.84.309.2]Mixed Use High Density Retail Only Demolition Leisure Use Zone Boundary
Figure 27 Great Park linear scenario (above).
Figure 28 Newcastle major growth: alternative location – string of neighbourhood cells (below).
© Crown copyright / database right 2007. An Ordnance Survey / EDINA supplied service. 2001 Census Output Area boundaries. © Crown copyright 2007.
National Statistics website: www.statistics.gov.uk. © Crown copyright 2007. Crown copyright material is reproduced with the permission of the Controller of HMSO. The NaPTAN Database is Crown copyright.
GREATPARK PLUS+
CELLS WEST
1:35,000
0 250500 1,000 1,500 2,000 2,500Meters
Legend BusStops Metrostops PriSchools SecSchools SegBusStops MetroLine NewBusRoute NewSegBusRoute LandUse Industrial Open Green Space Residential High Density Residential Medium Density Residential Low Density
Mixed Use High Density Retail Only Demolition Leisure Use Zone Boundary
© Crown copyright / database right 2007. An Ordnance Survey / EDINA supplied service. 2001 Census Output Area boundaries. © Crown copyright 2007.
National Statistics website: www.statistics.gov.uk. © Crown copyright 2007. Crown copyright material is reproduced with the permission of the Controller of HMSO. The NaPTAN Database is Crown copyright.
GREATPARK PLUS+
CELLS WEST
1:35,000
0 250500 1,000 1,500 2,000 2,500Meters
Legend BusStops Metrostops PriSchools SecSchools SegBusStops MetroLine NewBusRoute NewSegBusRoute LandUse Industrial Open Green Space Residential High Density Residential Medium Density Residential Low Density
[image:27.595.57.540.333.649.2]CRITeRIA Newcastle Great Park Metro Stations
PODS LINeAR CeLLS
Efficiency in use of open land
Accessibility to local services
Accessibility to schools
Access to public transport
Access to open space
Level of active travel
Local transport carbon emissions
Stakeholders assessment of desirability
Political acceptability
[image:28.595.296.540.322.657.2]Market feasibility
Table 3 Evaluation of the three options presented above (key same as table 3).
CAMBRIDGe eAST
The second example of a major urban extension is more in-town than out-of-town. Unlike Newcastle Great Park the development of Cambridge East remains uncertain. The current user of most of the site is Cambridge Airport, and there is as yet no firm plan for its relocation. The aspiration of the City is for a high density compact development including a major cultural centre, served by high quality public transport routes.
The area of the Cambridge East site is nearly 4 square kilometres. It lies within the 5 km threshold distance of the city centre, which can be used to define a nucleated town (Barton et al., 1995). Major roads surround it, and there are existing suburbs immediately to the West and South, both of which are rather isolated from the main built up area and have modest levels of local facilities.
The contribution of this case study is to illustrate the range of workable options that can exist when the development area is sufficiently large and well-related to existing development. It also illustrates the exploratory nature of the design process – showing how stakeholder involvement helped to improve the interpretation of the archetypes.