warwick.ac.uk/lib-publications
A Thesis Submitted for the Degree of PhD at the University of Warwick
Permanent WRAP URL:
http://wrap.warwick.ac.uk/95224/ Copyright and reuse:
This thesis is made available online and is protected by original copyright. Please scroll down to view the document itself.
Please refer to the repository record for this item for information to help you to cite it. Our policy information is available from the repository home page.
Post-mortem analysis of lithium-ion cells after
accelerated lifetime testing
by
Limhi Somerville
An innovation report submitted in partial fulfilment of
requirements for the degree of
Doctor of Engineering (EngD)
August 2017
i
Abstract
Lithium-ion cells are the most commonly used method of energy storage for portable electronics. However, the capacity and power reduces with time and is dependent on usage conditions. This is a challenge for electric vehicle battery packs that are expected to last for up to eight years. Vehicle manufacturers need to understand the causes of this phenomena to accurately predict the vehicles achievable range over its entire lifetime. For automotive manufacturers to tackle this challenge they must know what operating conditions impact cell capacity and power. And, once this has been established, how these operating conditions impact cell capacity and power. Answers to these questions would provide critical information for manufactures; allowing them to mitigate or plan for their impact.
In this work, electrical testing was performed across seven cell conditions for between six and thirty months to determine changes in capacity and resistance. Due to the different facility requirements at least one of the following cell chemistries were used for each test, Nickel manganese cobalt (NMC), Nickel Cobalt Aluminium (NCA) and lithium cobalt dioxide (LiCoO2) / all with graphite negative electrodes. State of charge, temperature, current rate during charge, the quantity of the state of charge window utilised and vibration all impacted electrical performance. Cell orientation and external pressure had no effect on cell lifetime.
Cell capacity and resistance change over its lifetime is a function of the parasitic chemical reactions occurring within the cell. Understanding how these operating conditions impact cell performance requires a study of the fundamental materials that are at fault. Therefore, materials characterisation of the negative electrode surface film (identified as the primary source of changes to cell capacity and resistance) was performed.
Consistency of analytical methods to study this surface film is dependent on the processes of preparation. Those used within literature to open cells, and process the internal cell electrodes led to erroneous results through modification of the surface films chemical properties. A new method is introduced of opening 18650-type cells that is simpler, costs less and stops surface film damage and contamination. In addition, washing electrode surfaces with solvents, which is routinely done within literature, was found to affect the surface film. This work shows that washing can remove surface film and selectively solvate parts of it. It is therefore recommended that washing is not performed.
After cell opening, samples were then analysed to determine material changes. A method is introduced to determine the relative surface film thickness (which relates to cell resistance) with x-ray photoelectron spectroscopy that is an improvement on the current method within literature. A wet chemistry method is also shown to selectively remove LiPF6 salt. This makes it possible to use high performance liquid chromatography to study the polymeric species without it reacting with hydrofluoric acid.
Using these methods, a relationship is identified between current rate during charge and surface film thickness at the negative electrode up to rates of 4-C. At rates of 6-C and greater the surface film altered chemically. Cell vibration was found to cause the selectively formed film to be replaced with electrolyte reduction products, increasing cell resistance. Subjecting cells to different temperatures and states of charge (SoC) caused different films to form at each temperature. Coupled with electrical performance data, this could be reduced to two. One at 10oC and one at 45oC. SoC was also found to accelerate film formation but not chemically alter it at these two temperatures. Problems with the USABC test for a percentage change in state of charge for lithium-ion cells was identified, but these problems stopped surface film analysis.
ii
Acknowledgements
Any project that is as vast as this requires the acknowledgement of so many people. It goes without saying that doctoral work is the collaboration of a student with their supervisors. I am grateful to Paul Jennings for supervising and facilitating both my ideas and everything that was done in this work. Andrew McGordon for supervising and especially reading, then editing and providing feedback on everything, again and again. I am also grateful to Christopher Lyness who gave a lot of technical electrochemistry instruction and helped me to get a running start as well as supporting my work throughout. These three have listened and prompted for many years and have made all the difference to my confidence and the work.
A lot of this work, and much of its quality, would not have been possible without Argonne National Laboratory (ANL) but especially Ira Bloom who never (appeared) tired of my many questions, Javier Bareño with whom I spent many days receiving instruction, asking numerous questions and receiving detailed responses, and Nancy Dietz-Rago for many technical and non-technical discussion, microscopy help and surface science information. These three taught me a great deal during my time there for which I cannot repay. My thanks also go to Dr Bloom’s entire team but especially Panos and John for their help with electrical characterisation and walking me through test methods and procedures. The ANL placement and subsequent collaboration would not have been possible without Nick Mallinson, who spent many hours orchestrating and working behind the scenes. In addition to Nigel Taylor and Nick Green from Jaguar Land Rover who not only organised money but also legalities.
I am also grateful to the entire team at The University of Warwick and Jaguar Land Rover. James T, Anup, James M, James H, Mark, Dhammika, Kotub, Gael, Julie, Ravi, Shane, Paul B, Yue and others who performed testing, purchased equipment, helped me to learn something or told me when to be quiet. This would not have been possible or as much fun without so many people who worked hard and put in a lot of time and talent.
iii
Declaration
I declare that the work described in this report was undertaken by myself (unless otherwise
acknowledged in the text) and that none of the work has been previously submitted for any
iv
Contents
1. Introduction ... 1
2. Ageing of lithium-ion cells ... 6
2.1. Lithium-ion cells ... 7
2.2. Causes of lifetime reduction ... 10
2.2.1. Definition of ageing ... 10
2.2.2. Causes of cell ageing ... 11
3. Internal chemical mechanisms responsible for ageing ... 14
3.1. Definitions within this work ... 14
3.1.1. State of charge (SoC) ... 14
3.1.2. Percentage change in state of charge (% SoC) ... 14
3.1.3. Temperature (T) ... 15
3.1.4. Current (I) rate ... 15
3.1.5. Pressure, orientation and vibration ... 16
3.2. Chemical mechanisms responsible for cell ageing ... 17
3.2.1. State of charge ... 17
3.2.2. Increased Temperature (T) ... 20
3.2.3. Low Temperature ... 21
3.2.4. Current rate during charge ... 21
3.2.5. Vibration... 22
3.2.6. Orientation ... 23
3.2.7. External pressure ... 24
3.2.8. Discussion ... 24
3.3. The negative electrode Surface film ... 27
v
3.3.2. Chemical composition of the surface film ... 28
3.4. Techniques to study the chemical composition of the surface film ... 33
3.5. Determining surface film thickness with XPS ... 36
3.6. Study of the polymeric species present in the surface film with HPLC ... 37
3.8. Obtaining access to the negative electrode surface film ... 39
3.8.1. Cell opening ... 39
3.8.2. Pouch cells ... 39
3.8.3. Cylindrical (18650) cells ... 39
3.9. Preparing samples for analysis ... 42
3.10. Conclusion ... 43
4. Research methodology ... 44
5. Electrical data ... 48
5.1. Cell selection and electrical performance bench-marking ... 49
5.2. Temperature ... 53
5.3. State of charge ... 55
5.4. Increased current rate during charge ... 57
5.5. Percentage change in State of charge ... 59
5.6. Vibration... 62
5.7. Pressure ... 63
5.8. Orientation ... 64
vi
6. Preparation for post-mortem analysis ... 70
6.1. Cell opening ... 71
6.1.1. Discussion ... 74
6.1.2. Conclusion ... 74
6.2. Sample preparation ... 76
6.2.1. Results and discussion ... 76
6.3. Conclusions ... 86
7. Analysis of surface film ... 87
7.1. XPS analysis for differentiating between surface film and electrolyte deposits and for measuring surface film thickness ... 88
7.1.1. Hypotheses ... 88
7.1.2. Discussion ... 89
7.1.3. Conclusion ... 92
7.2. Selectively removing LiPF6 from surface film samples... 93
7.2.1. New method ... 93
7.2.2. Method verification ... 94
7.2.3. Discussion and conclusions ... 95
7.3. Conclusions ... 97
8. Post-mortem analysis of lithium-ion cells ... 99
8.1. Increased current rate during charge ... 101
8.1.1. Visual changes ... 101
8.1.2. Microstructural changes ... 102
vii
8.1.4. Discussion ... 108
8.2. Percentage change in state of charge... 115
8.3. Vibration... 122
8.3.1. Surface film (Negative electrode post-sputter) ... 122
8.3.2. Electrolyte decomposition products (Negative electrode pre-sputter) ... 126
8.3.3. Discussion ... 128
8.4. Change in temperature and SoC ... 131
8.4.1. Introduction ... 131
8.4.2. Surface film chemical composition ... 132
8.4.3. Discussion and conclusions ... 139
9. Discussion ... 141
9.1. Post-mortem analysis ... 142
9.1.1. Opening and sample processing ... 142
9.1.2. Analysis of the surface film ... 144
9.2. Accelerated ageing tests ... 146
9.2.1. Increased current rate during charge ... 146
9.2.2. Vibration... 148
9.2.3. Temperature / SoC ... 149
9.2.4. Percentage change in SoC ... 150
9.3. Collective impact for JLR ... 152
9.4. Next steps / future work ... 154
10. Conclusions... 155
viii
List of symbols and units
% Percentage
% ∆ SoC Percentage change in State of charge £ Great British Pound Sterling
∆ Delta (change)
© Copyright
µm Micron
Ah Ampere-hour
Ar+ Argon ion
B.P. Boiling point
C Carbon
C Concentration
C=C Alkene bond
C=O Carbonyl functional group
Ca Calcium
CaCO3 Calcium carbonate CaF2 Calcium difluoride Ccell Cell terminal voltage
C-H Alkane bond
C-Li Lithium carbide
CO2 Carbon dioxide
D Diffusion coefficient
Da Dalton
E Represented by state of charge
e- Electron
eV Electron volt
F Fluorine
F- Fluoride ion
ix
I Current
J Diffusion flux
K Kelvin
kPa Kilopascal
Li+ Lithium ion
LiCoO2 Lithium cobalt dioxide LiPF6 Lithium hexafluorophosphate Mg.l-1 Milligrams per litre
Min.ml-1 Minutes per millilitre
mol.cm-2.s-1 Mols per centimetre squared per second
mV Millivolt
Ni Nickel
nm Nanometre
oC Degrees celsius
O-C=O Ester functional group
P Phosphorous
p.s.i Pounds per square inch
R Resistance
R2 Coefficient of determination s.d. Standard deviation
Si Silicon
Si-O Silicon oxide
T Temperature
V ‘Voltage’, ‘potential of the electrode’ or ‘vanadium’ Vocv Open circuit voltage
x Distance
x
List of abbreviations
18650 Cylindrical cell format (18mm in circumference and 65.0mm in length) ANL Argonne National Laboratory
BMS Battery management system CC Current collector
DCM Dichloromethane DMC Dimethyl carbonate EC Ethlyene carbonate
EDAX Energy dispersive x-ray microanalysis EIS Electrochemical impedance spectroscopy EngD Engineering doctorate
EOL End of life
GBP Great British Pound
GC-MS Gas chromatography – mass spectrometry GPC Gel permeation chromatography
HF Hydrofluoric acid
HPLC High performance liquid chromatography IC Ion chromatography
ICS Ion chromatography system
IR Infra-red
JLR Jaguar Land Rover LiF Lithium fluoride
MCMB Mesocarbon microbeads
NASA National Aeronautics and Space Administration NIST National institute of standards and technology NMC Nickel manganese cobalt
xi RTP Room temperature and pressure S# Submission number
SBR Styrene butadiene rubber SEI Solid electrolyte interphase SEM Scanning electron microscope SoC State of charge
UK United Kingdom
USABC United States Advance Battery Consortium VC Vinylene carbonate
xii
List of figures
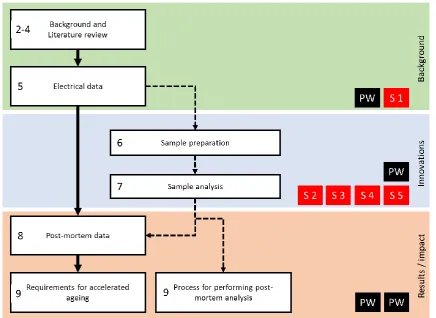
FIGURE 1.OUTLINE OF THE ENGINEERING DOCTORATE PORTFOLIO, NUMBERS TO THE LEFT OF WHITE TOPIC BOXES REPRESENT
CHAPTERS WITHIN THIS INNOVATION REPORT.RED BOXES LABELLED S1-5 REPRESENT THE FIVE PORTFOLIO SUBMISSIONS; THE
BLACK PW BOXES REPRESENT PUBLISHED WORK. ... 5
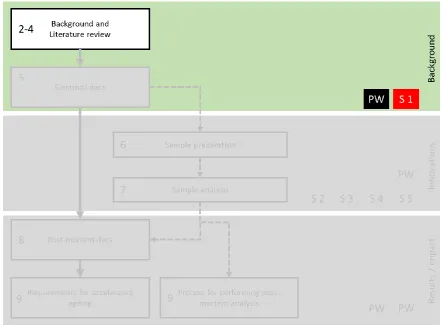
FIGURE 2.OUTLINE OF THE ENGINEERING DOCTORATE PORTFOLIO, HIGHLIGHTED FOR CHAPTERS 2-4.RED BOX LABELLED S1
REPRESENT THE FIRST PORTFOLIO SUBMISSION; THE BLACK PW BOX REPRESENTS PUBLISHED WORK. ... 6
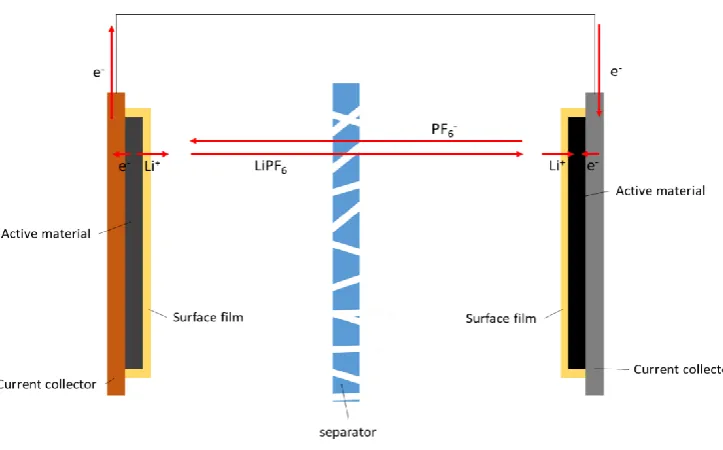
FIGURE 3.GRAPHIC SHOWING THE MAIN COMPONENTS AND PROCESSES OF A LITHIUM-ION CELL DURING RELEASE OF ENERGY.
ELECTRONS ARE REPRESENTED BY E- WHEREAS LITHIUM CATIONS ARE PRESENTED BY LI+; ALL PROCESSES FOR NORMAL CELL
OPERATION ARE REPRESENTED BY RED ARROWS. ... 8
FIGURE 4.THE DIFFERENCE BETWEEN SOC AND %ΔSOC IS SHOWN THROUGH THREE DIFFERENT BOXES ON A STATE OF CHARGE SCALE
BAR.A HAS A GREATER %ΔSOC THAN B WHILST B AND C ARE EQUAL IN %ΔSOC VALUES BUT THE SOC VALUES DIFFER. ... 15
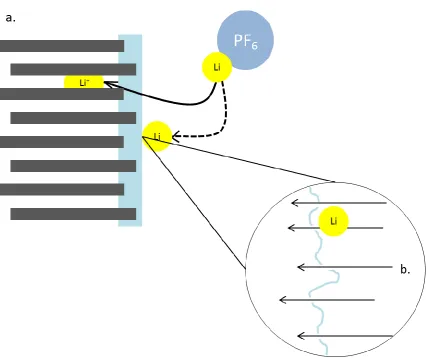
FIGURE 5.PART A.SCHEMATIC SHOWING THE TRADITIONAL INTERCALATION OF LI INTO THE NEGATIVE ELECTRODE (SOLID BLACK
ARROW) AND THE ALTERNATE PATH THAT OCCURS DURING LITHIUM PLATING (DOTTED ARROW). THE LIGHT BLUE RECTANGLE
REPRESENTS LITHIUM PLATING WHILST THE DARK GREY RECTANGLES REPRESENT A CARBON OR GRAPHITE NEGATIVE ELECTRODE
PARTICLE. PART B.THIS IS A SCHEMATIC SHOWING POSSIBLE INTERCALATION PATHS BLOCKED BY LITHIUM PLATING. ... 18
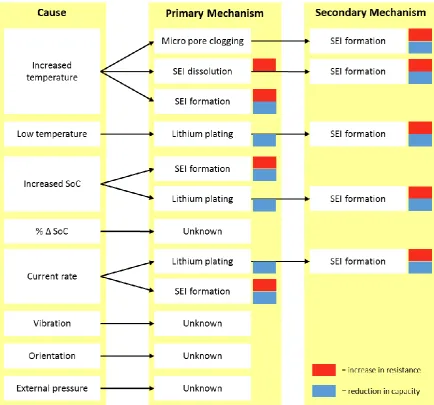
FIGURE 6.THE SEVEN (+1 FOR LOW TEMPERATURE, AS A SUBSET OF TEMPERATURE) POSSIBLE CAUSES OF LITHIUM-ION CELL AGEING
RELATED TO THE INTERNAL MECHANISMS RESPONSIBLE FOR INCREASE IN CELL RESISTANCE AND A REDUCTION IN CAPACITY .... 25
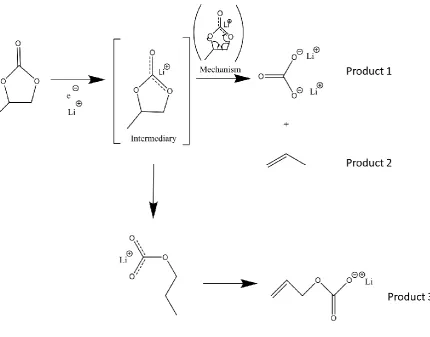
FIGURE 7.TWO POSSIBLE REDUCTION MECHANISMS WHEN PROPYLENE CARBONATE IS THE REAGENT, AS PROPOSED BY AURBACH ET
AL.[104] ... 30
FIGURE 8.CHEMICAL COMPOSITION OF THE TYPICAL CLASSES OF MATERIALS WITHIN THE SURFACE FILM, ELECTROLYTE AND GAS.RED
RECTANGULAR OUTLINED BOXES INDICATE ORGANIC FUNCTIONAL GROUPS.GREEN BOXES INDICATE INORGANIC CONTAINING
COMPOUNDS, BLUE BOXES INDICATE THE INDIVIDUAL ELEMENTS BEING STUDIED AND ORANGE BOXES INDICATE POLYMERIC
SPECIES BY CIRCLING THE ‘N’ ANNOTATION OF THE MOLECULE.THE SYMBOLS (L),(G) AND (S) REFER TO THE PHASES OF LIQUID,
GAS AND SOLID RESPECTIVELY. ... 32
FIGURE 9.GRAPHIC OF THE ELECTRODE SURFACE DURING CELL USE ... 33
FIGURE 10.IMAGE OF A DREMEL MULTI-TOOL WITH CERAMIC CUTTING BLADE ATTACHED (A).IMAGES OF FAILED ATTEMPTS TO OPEN
18650 LITHIUM-ION CELLS WITHOUT SHORT CIRCUIT.B IS THE BEST ATTEMPT WITH A HACKSAW BLADE.C IS THE BEST ATTEMPT
xiii
FIGURE 11.OUTLINE OF THE ENGINEERING DOCTORATE PORTFOLIO, CHAPTERS WITHIN THIS INNOVATION REPORT ARE SHOWN AS
NUMBERS TO THE LEFT OF WHITE TOPIC BOXES.THE GREEN COLOURED BOX REFERS TO THE SECTION OF THE PORTFOLIO THAT
THIS CHAPTER RELATES TO ‘BACKGROUND’. ... 48
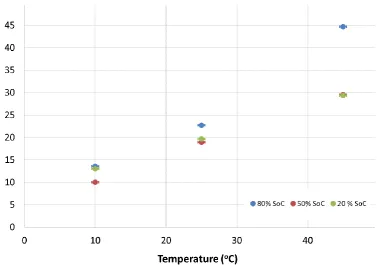
FIGURE 12.IMPACT OF TEMPERATURE ON CELL CAPACITY ... 54
FIGURE 13.IMPACT OF TEMPERATURE ON CELL RESISTANCE ... 54
FIGURE 14.IMPACT OF ‘STATE OF CHARGE’ ON CELL CAPACITY AT THREE DIFFERENT TEMPERATURES (45OC,25OC AND 10OC) ... 56
FIGURE 15.IMPACT OF STATE OF CHARGE ON CELL RESISTANCE AT THREE DIFFERENT TEMPERATURES (45OC,25OC AND 10OC) ... 56
FIGURE 16.IMPACT OF CHARGING RATE ON CELL CAPACITY, A LINEAR TREND LINE HAS BEEN APPLIED TO THE DATA POINTS WITH AN R2 VALUE OF 99.6% ... 57
FIGURE 17.IMPACT OF CHARGING RATE ON CELL RESISTANCE ... 58
FIGURE 18.IMPACT OF ‘PERCENTAGE CHANGE IN STATE OF CHARGE’ ON CELL CAPACITY ... 60
FIGURE 19.IMPACT OF ‘PERCENTAGE CHANGE IN STATE OF CHARGE’ ON CELL RESISTANCE ... 61
FIGURE 20.IMPACT OF VIBRATION ON CELL RESISTANCE AND CAPACITY ... 63
FIGURE 21.IMPACT OF PRESSURE ON CELL RESISTANCE AND CAPACITY ... 64
FIGURE 22.IMPACT OF ORIENTATION ON CELL RESISTANCE AND CAPACITY ... 65
FIGURE 23.OUTLINE OF THE ENGINEERING DOCTORATE PORTFOLIO, CHAPTERS WITHIN THIS INNOVATION REPORT ARE SHOWN AS NUMBERS TO THE LEFT OF WHITE TOPIC BOXES.RED BOXES LABELLED S1-5 REPRESENT THE FIVE PORTFOLIO SUBMISSIONS, THE BLACK PW BOXES REPRESENT PUBLISHED WORK. ... 70
FIGURE 24.EIGHT IMAGES CHRONOLOGICALLY MAPPING THE OPENING OF AN 18650 CYLINDRICAL CELL TO REMOVE THE INNER ELECTRODE ROLL ... 72
FIGURE 25.MICROGRAPHS OF NEGATIVE ELECTRODES CUT FROM THE OUTSIDE NEAREST THE 18650-TYPE CELL CAN WALL.IMAGE A WAS OPENED WITH A DREMEL MULTI-SAW WHILST B WAS OPENED USING THE NEW METHOD OUTLINED IN FIGURE 24. ... 73
FIGURE 26.MICROGRAPHS OF NEGATIVE ELECTRODES FROM CELLS CONTAINING VARYING CONCENTRATIONS (0-6 VOL.%) OF VINYLENE CARBONATE ADDED TO THE ELECTROLYTE.DIFFERENT ARROWS REPRESENT DIFFERENT APPEARANCES IN THE SURFACE FILM OF UNWASHED SAMPLES ... 77
xiv
FIGURE 28.ATR-FTIR SPECTRA OF ETHYLENE CARBONATE (EC) AND A GRAPHITE ELECTRODE SAMPLE FROM A LITHIUM-ION CELL WITH
NO VINYLENE CARBONATE (VC) ADDED TO THE ELECTROLYTE. ... 81
FIGURE 29.PLOT OF TEMPERATURE (T) VS PRESSURE (P) FOR ETHYLENE CARBONATE VAPORISATION, DATA TAKEN FROM CHERNYAK ET
AL. WORK. ... 82
FIGURE 30.XPS OF BINDING ENERGY FOR F1S CORE ELECTRONS OF BOTH WASHED (WITH DMC) AND UNWASHED SAMPLES.0 MIN
REPRESENTS UN-SPUTTERED ELECTRODES WHEREAS 1 MIN REPRESENTS THE SAMPLE AFTER SPUTTERING WITH AR+IONS FOR
ONE MINUTE. ... 85
FIGURE 31.OUTLINE OF THE ENGINEERING DOCTORATE PORTFOLIO, CHAPTERS WITHIN THIS INNOVATION REPORT ARE SHOWN AS
NUMBERS TO THE LEFT OF WHITE TOPIC BOXES.RED BOXES LABELLED S1-5 REPRESENT THE FIVE PORTFOLIO SUBMISSIONS, THE
BLACK PW BOXES REPRESENT PUBLISHED WORK. ... 87
FIGURE 32.PICTORIAL REPRESENTATION OF AN ELECTRODE AFTER SPUTTERING OF THE ELECTRODE SURFACE HAS OCCURRED. ... 89
FIGURE 33.ILLUSTRATION OF THE METHOD TO PASSIVATE LIPF6 AND SELECTIVELY REMOVE SAMPLE SPECIES PRIOR TO ANALYSIS WITH
GC-MS AND HPLC ... 94
FIGURE 34.SCREEN PRINTS OF THE ION CHROMATOGRAPHY TAKEN OF DISTILLED WATER AND THE ELECTRODE WASHING SAMPLE AFTER
PROCESSING WITH THE METHOD ILLUSTRATED IN FIGURE 32. ... 95
FIGURE 35.OUTLINE OF THE ENGINEERING DOCTORATE PORTFOLIO, CHAPTERS WITHIN THIS INNOVATION REPORT ARE SHOWN AS
NUMBERS TO THE LEFT OF WHITE TOPIC BOXES. ... 100
FIGURE 36.GRAPHIC OF GRAPHITE ELECTRODES FROM COMMERCIAL 18650-TYPE LITHIUM-ION CELLS THAT HAVE BEEN SUBJECTED TO
DIFFERENT RATES OF CHARGE (0.7-,2-,4-, AND 6-C).THE PHOTOGRAPH (INSET) SHOWS ONE SIDE OF THE 6-C ELECTRODE.
... 102
FIGURE 37.MICROGRAPHS OF GRAPHITE ELECTRODES FROM COMMERCIALLY AVAILABLE 18650 CELLS THAT WERE SUBJECTED TO
DIFFERENT RATES OF CHARGE (0.7-,2-,4-, AND 6-C).THE “MIDDLE” AND “OUTSIDE” LABELS REFER TO MICROGRAPHS TAKEN
FURTHEST FROM THE TOP CAP AND BOTTOM OF THE 18650 SIZE CELL (MIDDLE) AND THOSE TAKEN CLOSEST TO THEM
(OUTSIDE). ... 103
FIGURE 38.HIGH-PERFORMANCE LIQUID CHROMATOGRAPHY OF ELECTRODE SURFACE FILM REMOVED FROM CELLS THAT HAVE BEEN
SUBJECTED TO DIFFERENT RATES OF CHARGE (0.7-,2-,4-, AND 6-C).THE INSET IS THE INTEGRATION OF THE TOTAL COUNTS
xv
FIGURE 39.C1S XPS SPECTRA OF GRAPHITE ELECTRODES AFTER SPUTTERING FROM COMMERCIAL 18650 CELLS SUBJECTED TO
DIFFERENT RATES OF CHARGE (0.7-,2-,4-, AND 6-C). ... 106
FIGURE 40.C1S XPS SPECTRA OF A GRAPHITE ELECTRODE FROM A CELL SUBJECTED TO A CHARGE RATE OF 2-C.THE MIDDLE REFERS
TO THE ELECTRODE FURTHEST FROM THE TOP AND BOTTOM OF THE 18650-SIZE CELL, WHEREAS THE OUTSIDE REFERS TO THE
ELECTRODE CLOSEST TO THE TOP OR BOTTOM OF THE ELECTRODE ROLL. ... 107
FIGURE 41.PHOTOGRAPHS OF GRAPHITE ELECTRODES CUT FROM COMMERCIAL CYLINDRICAL CELLS FROM THE OUTSIDE (A) AND
MIDDLE (B AND C) OF THE ELECTRODE ROLL AND STORED AT 30OC(A AND B) AND 55OC(C) IN TYPICAL ELECTROLYTE ORGANIC
SOLVENT. ... 110
FIGURE 42.(A)THE PEAK AREAS PLOTTED AS A PERCENTAGE OF TOTAL C1S ENVIRONMENTS TAKEN FROM AND (B) THE SUM OF ALL
NON C-C ENVIRONMENTS (SURFACE FILM) COMPARED TO ALL C-C ENVIRONMENTS. ... 112
FIGURE 43.CELL RESISTANCE RELATIVE TO THE TOTAL QUANTITY OF SURFACE FILM FOR LITHIUM-ION CELLS SUBJECTED TO VARIED
RATES OF CHARGE.R2 VALUE OF FITTING LINE (RED) IS >0.98%... 113
FIGURE 44.PHOTOGRAPHS OF ELECTRODES SUBJECTED TO DIFFERENT CHARGING RATES (0.7- TO 6-C) THROUGH 100% OF THE STATE
OF CHARGE WINDOW (0-100%∆SOC) AND 40% OF THE STATE OF CHARGE WINDOW (40-80%∆SOC) ... 116
FIGURE 45.MICROGRAPHS OF COPPER CURRENT COLLECTORS FROM CELLS SUBJECTED TO DIFFERENT CHARGING RATES (0.7- TO 6-C)
THROUGH 100% OF THE STATE OF CHARGE WINDOW (0-100%∆SOC) AND 40% OF THE STATE OF CHARGE WINDOW
(40-80%∆SOC) ... 117
FIGURE 46.MICROGRAPHS OF COPPER CURRENT COLLECTORS FROM CELLS CHARGED THROUGH 100% OF THE STATE OF CHARGE
WINDOW (0-100%∆SOC) AND 40% OF THE STATE OF CHARGE WINDOW (40-80%∆SOC) AND OF A CU CURRENT
COLLECTOR AFTER PITTING DAMAGE ... 119
FIGURE 47.MICROGRAPHS OF COPPER CURRENT COLLECTORS FROM A CELL CHARGED AT A RATE OF 6-C THROUGH 40% OF THE STATE
OF CHARGE WINDOW (40-80%SOC) FROM THE MIDDLE OF THE ELECTRODE ROLL AND THE OUTSIDE ... 120
FIGURE 48.PROFILE OF THE CHARGE DISCHARGE CYCLE STANDARD TESTING PROCEDURE FROM THE USABC FOR TESTING OF DAMAGE
INDUCED BY A PERCENTAGE CHANGE IN A CELLS STATE OF CHARGE UTILISED DURING CHARGING. ... 121
FIGURE 49.XPS SPECTRA OF THE NEGATIVE ELECTRODE FOR C1S FROM FOUR CELLS (3,15,17 AND 18) AFTER SPUTTERING WITH
AR+ IONS.THE CHEMICAL ENVIRONMENTS (C-LI ETC.) ARE SHOWN BY TAGS IN CELL 18 AND ARE IDENTICAL IN POSITION AND
xvi
FIGURE 50.XPS SPECTRA OF THE NEGATIVE ELECTRODE FOR P2P,F1S AND O1S FROM FOUR CELLS (3,15,17 AND 18) AFTER
SPUTTERING WITH AR+ IONS.THE CHEMICAL ENVIRONMENTS ARE REPRESENTED BY TAGS (E.G.LIF) AND LINES WHICH INDICATE
THE RELATIVE BINDING ENERGY ALIGNMENT. ... 124
FIGURE 51.XPS SPECTRA OF THE NEGATIVE ELECTRODE FOR C1S FROM FOUR CELLS (3,15,17 AND 18) BEFORE SPUTTERING.THE
CHEMICAL ENVIRONMENTS (C-O ETC.) ARE SHOWN BY TAGS IN CELL 18 AND ARE IDENTICAL TO THOSE SHOWN IN THE OTHER
CELLS ... 126
FIGURE 52.XPS SPECTRA OF THE NEGATIVE ELECTRODE FOR P2P,F1S AND O1S FROM FOUR CELLS (3,15,17 AND 18) BEFORE
SPUTTERING.THE CHEMICAL ENVIRONMENTS ARE REPRESENTED BY TAGS (E.G.LIF) AND LINES WHICH INDICATE THE RELATIVE
BINDING ENERGY ALIGNMENT ... 127
FIGURE 53.C1S X-RAY PHOTOELECTRON SPECTRA FROM THE NEGATIVE ELECTRODE OF CELLS SUBJECTED TO DIFFERENT
TEMPERATURES AND STATES OF CHARGE DURING STORAGE FOR A PERIOD OF 30 MONTHS.IDENTICAL PEAK COLOURS
REPRESENT THE SAME CHEMICAL ENVIRONMENT BASED ON PEAK BINDING ENERGY AND WIDTH VALUES ... 134
FIGURE 54.O1S X-RAY PHOTOELECTRON SPECTRA FROM THE NEGATIVE ELECTRODE OF CELLS SUBJECTED TO DIFFERENT
TEMPERATURES AND STATES OF CHARGE DURING STORAGE FOR A PERIOD OF 30 MONTHS.IDENTICAL PEAK COLOURS
REPRESENT THE SAME CHEMICAL ENVIRONMENT BASED ON PEAK BINDING ENERGY AND WIDTH VALUES. ... 136
FIGURE 55.F1S X-RAY PHOTOELECTRON SPECTRA FROM THE NEGATIVE ELECTRODE OF CELLS SUBJECTED TO DIFFERENT TEMPERATURES
AND STATES OF CHARGE DURING STORAGE FOR A PERIOD OF 30 MONTHS.IDENTICAL PEAK COLOURS REPRESENT THE SAME
CHEMICAL ENVIRONMENT BASED ON PEAK BINDING ENERGY AND WIDTH VALUES. ... 138
FIGURE 56.OUTLINE OF THE ENGINEERING DOCTORATE PORTFOLIO, CHAPTERS WITHIN THIS INNOVATION REPORT ARE SHOWN AS
xvii
List of tables
TABLE 1.COMMON COMPONENTS LIKELY TO BE PRESENT IN ELECTROLYTE USING SKELETAL BOND FORMULA REPRESENTATION WITH
SOLID LINES REPRESENTING BONDS IN THE PLANE OF THE PAPER, WEDGED LINES REPRESENTING BONDS THAT ARE BEHIND THE
PAPER AND DASHED LINES FOR THOSE MOVING OUT FROM THE PAPER. ... 29
TABLE 2.MATERIAL TYPE, NOMINAL CAPACITY AND VOLTAGE FOR CELLS USED IN THESE TESTS,NMC REPRESENTS NIXMNYCOZ.THE
TABLE IS POPULATED WITH INFORMATION FROM CELL SUPPLIER DATA SHEETS. ... 50
TABLE 3.TABLE SHOWING NUMBER OF CELLS, MANUFACTURERS, TIME AND COST TO PERFORM ELECTRICAL TESTING OF COMMERCIAL
LITHIUM-ION CELLS, THE LOCATION RELATES TO THE LOCATION OF TESTING PERFORMED; BEING EITHER WARWICK UNIVERSITY
(WMG) OR ARGONNE NATIONAL LABORATORY (ANL). ... 51
TABLE 4.PERCENTAGE CHANGES IN CAPACITY AND RESISTANCE FOR CELLS CYCLED UNDER DIFFERENT CONDITIONS, COLOUR INDICATES
THOSE VALUES THAT ARE TOO LOW TO RELATE TO AGEING (RED) AND HIGH ENOUGH TO SUGGEST CHANGES IN CELL CONDITIONS
ARE RESPONSIBLE (GREEN) VALUES. ... 67
TABLE 5.RELATIVE PERCENTAGES OF CHEMICAL ENVIRONMENTS FROM CHOSEN PEAKS AND ELEMENTAL ENVIRONMENTS IN SURFACE
FILM ... 125
TABLE 6.RELATIVE PERCENTAGES OF CHEMICAL ENVIRONMENTS FROM CHOSEN PEAKS AND ELEMENTAL ENVIRONMENTS IN
1
1.
Introduction
European regulation 443/2009 states that the fleet average exhaust emissions of carbon dioxide
(CO2) for all passenger vehicles sold within the European union must be 95g.km-1 by 2021 [1].
The fleet average exhaust emissions of CO2 for Jaguar Land Rover (JLR) in 2015 was 182g.km -1[2], if unchanged, companies with CO
2 emissions like JLR will be subject to fines on their vehicles and therefore they need to reduce their exhaust CO2 emissions.
JLR and other automotive manufacturers have chosen to reduce CO2 emissions by introducing
a range of hybrid and all-electric vehicles [3]. The JLR programme uses lithium-ion cells [4].
These cells are identical in operating principles to those used in most hand-held electronic
systems and laptop computers [5].
Lithium-ion technology is used for energy storage in laptop computers and mobile phones,
however these are only expected to last for two to three years [6]. During this time, the capacity
and power that the cells provide diminishes and the device requires more frequent charging or
uses more energy to perform the same tasks [7]. Most mobile phone users replace their handsets
within this two-year period. However, automotive manufacturers are expected to have vehicle
batteries that last for up to eight years [8]. Please note that battery end of life (EOL) is when it
equals 80% of initial capacity or a 50% increase in internal resistance – this is an internal
standard from JLR (sponsoring company).
If electric vehicles do not meet this lifetime then original equipment manufacturers (OEM),
like JLR, may have to replace them at cost. The price of a battery pack (consisting of multiple
lithium-ion cells) for an all-electric vehicle may be as high as £10,000 each [9] so replacement
is not a sound business strategy. This means that vehicle manufacturers need to find a way of
2
When JLR initially commissioned this doctoral study, they had no documentation of whether
a vehicle containing a lithium-ion battery pack could reach this lifetime requirement. The initial
aim of this doctorate was to determine how long a battery would last and provide some evidence
in the form of real-world testing and mathematical modelling to predict the expected lifetime.
Lifetime performance decline of lithium-ion cells is affected by the conditions of its use [6]. It
is possible to use a battery management system (BMS) to control the operating conditions of
the battery (e.g. temperature). This would mean that those conditions which prolong cell
lifetime are preferentially chosen over those that degrade it [10]. Ultimately, it may be possible
to militate against the detrimental conditions that reduce cell capacity and power if it is
understood what causes it to happen. To make this calculation, manufacturers need to know
which conditions impact cell performance and by how much.
The most accurate method of predicting lithium-ion cell lifetime is to take the cell from a
supplier and then use it in real-world conditions for the warranty period of eight years.
However, when considered within the constraints of a company’s supplier sourcing, vehicle
production, and manufacturing processes this type of testing is not practical due to the infinite
number of potential driving conditions. For example, the protocol for driving in Hong Kong
[11] contains different operating conditions to those for UK urban areas [12]. And this is before
we have considered the impact of driver style and usage. Lithium-ion cells also come in many
shapes and sizes, the same cell chemistry made by two different manufacturers may give
markedly different lifetime performance [13]. If an automotive company wishes to change
suppliers, use new cells from the same supplier or use a new type of cell chemistry the cell
lifetime may have to be predicted again, requiring additional testing before implementation in
a vehicle [14]. Vehicle manufacturers cannot wait this long and therefore need to predict
3
Currently, accelerated lifetime prediction is performed by increasing the frequency and / or
intensity of laboratory tests [15]. Spotnitz refers to accelerated testing for simulating capacity
fade of commercial lithium-ion cells [16]. The example they introduce is ‘time temperature superposition’ where doubling the temperature can halve the testing time. Bloom et al.
performed this type of testing for accelerated calendar and cycle life ageing and found an
Arrhenius relationship (time)1/2 for temperature between cells stored at different states of
charge [17] they intimate that it may be due to electrolyte interface layer growth (a surface film
that forms on the negative electrode). Bloom et al. then relate that this relationship is not
consistent for cells cycled at 3% of the state of charge (SoC) window compared to 6% – as
shown by a non-linear change in cell capacity. Suggesting that a change in the operating
condition induces a different internal mechanism of degradation to occur.
Ultimately, capacity and resistance measured through the cell terminals are external
representations of multiple internal reactions. The conclusions of Bloom et al. [17] work are
based on the assumption that no chemical changes occurred to the surface films composition
for SoC reactions sped up by temperature. Accelerated ageing hinges on the concept that the
acceleration can be performed without changing the chemical reactions that occur [16].
However, Bloom et al. [17] electrical work alone does not provide sufficient evidence that this
is true. It is possible that different reactions still occur as temperature increases but performance
decline still follows a (time)1/2 kinetic rate. This becomes more complicated at more extreme
conditions, or if multiple different conditions and cell materials are included.
Automotive companies stake reputation and considerable money on determining how long
their battery pack lasts. There is a business case for accurately accelerating the ageing for
lithium-ion cells by ensuring that the conditions which accelerate ageing do so by increasing
4
chemical reactions do occur then the lifetime of the cell may diverge from the predicted values.
This type of divergence has the potential to be very costly to OEM’s in the long term due to
warranty costs.
It is possible to use post-mortem analysis to study what chemical changes occur within the
lithium-ion cell. This works by studying specific components of the cell for changes in the
material properties [18-21]. It may be possible to use post-mortem type analysis to lithium-ion
cells to determine the chemical reaction mechanisms with a decline in capacity and increase in
resistance [22]. Such results may validate or refute accelerated ageing methods, identify the
causes of cell ageing, and suggest those conditions that require further investigation.
The aim of this work is to investigate how post-mortem analysis can be used to detect material
changes in commercial lithium-ion cells after accelerated lifetime testing.
Figure 1 show the outline of this work, and shows the general flow of the document and
portfolio. The majority of the work within this portfolio deals with the process of post-mortem
analysis and is highlighted within the ‘Innovations’ section. However, the majority of the work
that is of interest to a commercial entity is contained in ‘Background’ and ‘results / impact’. In reality, the ‘Results / impact’ section are affected by the improvements made within the
‘innovations’ section. This is reflected by the majority of submissions to the portfolio being
within the ‘Innovations’ section but the majority of published work being in the ‘results /
impact’ section. Specific portfolio submissions are referred to within the portfolio when their
5
italicised script within the main body of the text. It is advisable to read these chapters as they
[image:24.595.79.516.181.499.2]are mentioned in the text.
6
2.
Ageing of lithium-ion cells
This chapter addresses the causes of ageing (reduction in capacity, increase in resistance)
within lithium-ion cells and the induced chemical reactions. In order to understand ageing it is
important to comprehend some fundamental aspects of what lithium-ion cells are and how they
work. Therefore, this chapter begins with principles of lithium-ion cells and then presents the
current literature into what conditions cause a reduction in capacity and an increase in
resistance. Figure 2 shows this chapter’s position within the context of the wider portfolio.
[image:25.595.74.521.311.638.2]7
2.1.
Lithium-ion cells
Lithium-ion cells are secondary (rechargeable) cells that store energy chemically. Each cell is
comprised of many different chemicals with many interchangeable possibilities [23].
Commercially available cells from different manufacturers use varied and complex
compositions of materials that can be slightly or significantly different from one another [24].
These differences and variety of compositions introduce complications to understanding what
chemical mechanisms are occurring within the cell to cause resistance to increase and capacity
to decline.
N.B. Chapter Two of Submission One from this Portfolio covers the general composition of
lithium-ion cells and their chemistry in more detail.
Figure 3 is a graphic of a lithium-ion cell and shows the eight basic steps to release and store
energy. These steps are:
Transferring Li+ ions out of the negative electrode active material
Solvating Li+ into the electrolyte
Diffusing Li+/Li through the surface film of the negative electrode
Li+ Migrating through the electrolyte and separator
Li+ Diffusing through the positive electrode surface film
Li+ De-solvating out of the electrolyte
Intercalating (process of Li+ movement into the unit cell of the host lattice) into the
positive electrode active material
8
Movement of charge governs lithium-ion cells, whether by electrons (e-) or ions (Li+).
Electrical current is produced when there is a potential difference between two bodies that are
electrically and ionically connected [25]. Figure 3 shows that the individual cell electrodes are
connected ionically through the electrolyte and electrically through the external circuit. More
details on the charge transfer phenomenon and electrical current can be found here [26].
An electrochemical cell has two electrodes; one positive and one negative. These are spatially
separated but ionically connected by a salt bridge, which is the electrolyte mixture containing
lithium salt [27]. Lithium-ion cells work by transferring lithium ions (Li+) between the two
electrodes through the electrolyte. This movement allows the cell to store / release energy.
When lithium intercalates into the negative electrode the voltage of the cell increases.
Intercalation can be defined as the insertion of atoms into the crystal lattice of another material.
The voltage is a measure of the reserved energy per unit charge from redox (oxidation /
[image:27.595.115.477.78.303.2]reduction) reactions that occur at the electrode surfaces. Two different redox reactions occur,
Figure 3. Graphic showing the main components and processes of a lithium-ion cell during release of energy. Electrons are represented by e- whereas lithium cations are presented by Li+; all processes for
9
one at each electrode, but can be represented by a single reaction (1) that is commonly broken
down into two half-cell reactions. During discharge these are oxidation at the anode (2) and
reduction at the cathode (3). C represents carbon, Li represents lithium and MO represents
transition metal oxides; the letters w, x, y and z represent varied stoichiometric quantities.
When a cell is charged, Li+ migrate to the negative electrode; a potential difference is required
to force the movement of Li+ out of the cathode, because it is the lowest available energy state.
Once the Li+ are in the negative electrode the difference in electrode potential means they still
want to migrate to the positive electrode (lower energy).
Cx + LiwMOy ↔ LizCx + LizMOy (1)
Liw-z Cx ↔ ZLi+ + XC + e- (2)
Liw-zMOy + e- + ZLi+ ↔ LiwMOy (3)
This entire process is possible because once the Li+ reaches the electrode it gains an electron
from the electrode active material, and reduces to lithium (3). After this reduction, the lithium must diffuse through the bulk of the material and intercalate into the active material. Fick’s
first law, which is simplified for no changes in concentration, shows two key parameters that
impact this. These are the chemical composition of the material being diffused through and the
path length (4). Equation 4 holds where J is the diffusion flux (mol.cm-2 s-1), D is the diffusion
coefficient, C is the concentration and x is the distance travelled by the ion. D is proportional
to the velocitysquared of the material particles and is dependent on temperature, material
viscosity and particle size.
10
2.2.
Causes of lifetime reduction
The work contained in this section focuses on the causes of lifetime reduction (ageing) within
a lithium-ion cell as reported by academic literature. It connects the manner in which a cell is
treated with the internal chemical mechanisms it induces.
N.B. An earlier edition of this literature review is presented in submission one of this doctoral
portfolio. The application of this work and proof of its use to modelling of lithium-ion cells is
shown in the work of Uddin et al. [28].
2.2.1. Definition of ageing
For the purposes of this work ‘ageing’ is a permanent reduction in capacity, or an increase in
the resistance, of lithium-ion cells.
Capacity is a measure of the available lithium and the available sites in the active material that
lithium can be stored in. The second is resistance (6), because the cell (Vcell) (cell terminal
voltage under load) assuming the current (I) is a constant, is dependent on the resistance (R)
and the voltage of the cell under no load (Vocv), which relates to the potential difference
between electrodes.
11
2.2.2. Causes of cell ageing
The causes of ageing reported within literature are:
Temperature [10,29-34]
State of charge [35-38,34,39,40]
Percentage change in state of charge [41,42]
Number of cycles [34]
Rate of intercalation (current rate) [43,44,41,45,36,46,30,47-49]
Charge procedure [48]
Time [40]
Depth of discharge [50] (% ∆ SoC)
External mechanical conditions [51,52]
Choice of materials [50]
Not all of these are relevant to the vehicle user case for this work because the requirements of
an automotive manufacturer are different. Whilst correct choice of materials for cells is crucial
it is beyond the scope of this work. This is because this work assumes that manufacturers of
lithium-ion cells have addressed this issue. This assumption and its validity is a major
advantage over using laboratory cells. Although laboratory cells provide more information on
specific chemical mechanism interpretation, because the chemistry parameters are better
known, they are open to significant error through poor manufacturing processes – it is difficult
to create repeatable results from laboratory made cells. This is the reason that Dahn et al. use
small commercial pouch cells for their tests [53,54].
Time and number of cycles is commonly cited as a cause of cell ageing. However, accelerated
ageing is potentially able to reduce the time taken to age by replicating conditions more
12
intensity of a different factor in the same period of time or number of cycles is able to age a
cell at a faster rate; then the measurement medium itself (time, number of cycles) cannot be the
origin of the failure. A study of anything but the origin of failure may lead to incorrect
interpretation of results. Therefore the number of cycles is excluded as a cause of cell ageing.
From a commercial point of view, vehicle manufacturers cannot apply a limit on the time a
battery is stored for or how many times a vehicle can be used in a day. Because few people
would buy a vehicle with such limitations. This also applies to current rate during discharge;
vehicle manufacturers use supplier imposed limits on discharge for cells. However, the precise
frequency and type of acceleration during discharge over a cell lifetime, within this supplier
imposed limit, is beyond the control of vehicle manufacturers and therefore it has also not been
studied.
Charge procedure is also an example of a cause that is easy to misinterpret. It is reported as a
cause of capacity fade [48,55,56]. Zhang [48] changed the charging protocol from constant
current or voltage during charge to a multi-stage variation. They reduced the current initially
(<10% SoC) and at the end of charging, (>90% SoC); this reduced capacity fade. Nevertheless, ‘charging protocol’ is the amalgamation of a specific current rate and SoC of the cell. It is
possible that current, SoC or total coulombs alone caused the ageing. This is because ‘charge procedure’ as a term is not the root cause of the problem but rather an amalgamation of specific
cell usage conditions. Without investigating them separately it is not possible to de-convolute
the capacity and power values to determine a root cause and therefore, this work only
investigates the isolated causes of cell ageing.
There are also some conditions that need to be investigated as requirements from JLR.
Vehicles, are subject to vibration during use [57], and the cells are also held within a vehicle
13
will be held at a specific orientation and the question has been raised by JLR whether this
would impact performance due to cell design – because no other root cause sufficiently
addresses these problems they are also being investigated.
The following have been identified as possible independent variables that do not depend on
any other factors:
State of charge
Percentage change in state of charge
Temperature
Current rate
Vibration
External pressure
Orientation
Therefore, one or more of these seven conditions outlined above is responsible for reducing
capacity or increasing resistance of the cells within a vehicle battery pack. The innovation
within this work is on connecting these causes with material changes within the cell; to
14
3.
Internal chemical mechanisms responsible for ageing
The purpose of this chapter is to determine from literature what internal mechanisms are
occurring under each of the seven conditions. And, how they can be studied using post-mortem
analysis.
3.1.
Definitions within this work
3.1.1. State of charge (SoC)
SoC can be defined as the percentage of available stored energy compared to total possible
energy [59]. Electrically, it can be defined by a standard capacity test [60]. For commercial
lithium-ion cells 100% SoC is approximately 4.2V whilst 0% SoC is approximately 2.5V.
Variations can occur with differing chemistries so the actual value should be tailored for each
individual cell. Electrochemically, SoC can be defined by the percentage of the negative
electrode that has been intercalated with lithium ions. At 100% SoC the negative electrode is
theoretically fully intercalated.
3.1.2. Percentage change in state of charge (% SoC)
A % ∆ SoC can also be referred to as ‘change in depth of discharge’ or ‘SoC swing’[61].
Occurring within the SoC window, % SoC defines how much of the SoC window is used
irrespective of the SoC. This concept is illustrated in Figure 4, A, has a different % ∆ SoC to
15
Electrically % SoC is the total number of coulombs for a charge-discharge cycle and may
occur at any voltage. Electrochemically it defines the total number of lithium ions that
intercalate into the electrode and is also a measure of the total work done on a system.
3.1.3. Temperature (T)
Temperature is also a root cause of cell ageing. As far back as 1889 Arrhenius kinetics showed
the dependence of chemical reactions on T [62]. Nernst Heat Theorem states, ‘in a perfectly
crystalline substance, exchange of entropy accompanying transformations [chemical reactions]
approaches zero asymptotically as temperature approaches zero [Kelvin]’[63]. Therefore,
temperature is essential for any reaction to occur and is also a determining factor in its rate.
3.1.4. Current (I) rate
Although % SoC defines the total number of coulombs in a charge-discharge cycle, the
current rate determines how fast the lithium ions and electrons move. The rate of e- movement
16
in the external circuit and subsequent Li+ ion intercalation may affect ageing of li-ion cells.
For this reason, the current rate is separate from T, % SoC and SoC.
3.1.5. Pressure, orientation and vibration
Irrespective of chemically induced ageing or test conditions, external mechanical stresses
including vibration [51] orientation [64] and external pressure [52] may cause ageing within
lithium ion cells. Because none of these are dependent on I, SoC, % SoC or T and are all
experienced within a vehicle. they will also be investigated for their impact on cell capacity
17
3.2.
Chemical mechanisms responsible for cell ageing
This section describes the dominant ageing mechanisms responsible for a reduction in capacity
and power, according to literature. Each of the seven causes is investigated individually and
possible mechanisms for degradation are highlighted within their own sub-sections. In some
cases the same mechanism can be accelerated by different causes, in these instances the
mechanisms are mentioned under each cause. The mechanistic pathway covered for each cause
is the one that literature has associated with it.
3.2.1. State of charge
As a cell is charged lithium-ions intercalate into the negative electrode from the positive
electrode via the electrolyte. This moves the negative electrode potential closer to zero at the
same time as the positive electrode’s potential increases. The actual value depends on potential
differences in materials and is the open circuit voltage of the cell. This voltage relates to the cells ‘state of charge’ value [65]. Therefore, a high state of charge relates to a higher quantity
of lithiumin the negative electrode.
3.2.1.1. Lithium plating
As the negative electrode approaches 0V, i.e. 100% SoC, it is closer to the potential at which
lithium deposits from the electrolyte onto the surface of the negative electrode (lithium plating)
[66]. For normal cell function, lithium intercalates from the salt in the electrolyte (LiPF6) to
the negative electrode. At lower electrode potentials intercalation is no longer the
thermodynamically favourable reaction and is replaced by Li+ reduction, forming lithium metal
which plates at the surface of the electrode. This decreases the amount of available lithium and
18
pathways for intercalation, as shown in part b. of Figure 5. The simplified schematic does not
show the complex nature of path blocking. It is often not just a sterically hindered phenomenon,
in many instances paths can be extended in length and not blocked. Capacity is reduced by loss
of lithium inventory through being used up by reactions [68]. Resistance increases from an
increased path length for the Li+ ions and blocked pores on the electrode surface.
Figure 5. Part a. Schematic showing the traditional intercalation of Li into the negative electrode (solid black arrow) and the alternate path that occurs during lithium plating (dotted arrow). The light blue rectangle represents lithium plating whilst the dark grey rectangles represent a carbon or graphite negative electrode particle. Part b. This is a schematic showing possible intercalation paths blocked by Lithium plating.
Lithium plating is shown in the work of Burns et al. [69]. Their work detects the impact of
lithium plating on electrical performance with high precision coulometry and uses photographs
[image:37.595.75.502.245.603.2]19
in comparing how much lithium is present if anything but a binary test is performed. Harris et
al. [66] detect lithium-plating by creating a custom cell and cycling it. However, this is also not
quantitative and it would be simpler to just open the cell and look at it. Klamor et al. have
shown detection of lithium plating with 7Li nuclear magnetic resonance (NMR) [70] which is
able to quantify lithium plating.
However, quantification of the lithium on the surface may not tell the entire story. Agubra et
al. performed testing on cells with lithium plating and showed that the plated lithium can
re-oxidise at 100mV [71] and re-intercalate into the electrodes. This means that lithium plating is
reversible and may not necessarily always lead to capacity loss. In addition, Zhang et al.
propose that lithium plating can form at the interface between the graphite and the surface film
[48]. These complications make determining how to detect lithium through the surface film
less useful. A possible solution to this predicament is shown by Sinha et al. who propose that
plated lithium reacts with electrolyte to thicken a resistive film at the negative electrode surface
[67]. Therefore, if plated lithium detection with NMR is unlikely to be able to be connected
back to a change in electrical performance. However, once the lithium reacts to form surface
film, then it is not reversible. Therefore, the mechanism of lithium plating that permanently
impacts cell performance could be analysed by a change in the surface film that forms on the
negative electrode.
3.2.1.2. Electrolyte reduction
Increased SoC increases the likelihood of electrolyte reduction at the negative electrode [72]
which then forms a film. The rate of surface film formation is increased by higher SoC (lower
20
3.2.2. Increased Temperature (T)
3.2.2.1. Surface film formation
Amatucci et al. [74]report that lithium-ion cells cycled at high temperatures see a decrease in
capacity and an increase in internal resistance. Their study focused on carbon negative and
transition metal oxide positive electrodes. This general composition makes up the majority of
lithium-ion cell chemistries commercially so it is especially relevant to this work [72]. Surface
film formation (electrolyte reduction) at the negative electrode is cited as the primary cause of
capacity fade and resistance increase within their work. This was found to decrease capacity
by consumption of Li+ cations but also to increase resistance through reduction in surface area
available for intercalation and an increase in path length for the Li+ ions [75].
Although the initial surface film formation at the negative electrode occurs during cycling,
Andersson et al. [76] report that irreversible reactions thickening the surface film occurs at
higher temperatures.
3.2.2.2. Surface film dissolution
Amatucci et al. noted that at higher temperatures (70oC) the surface film dissolves and
decomposes. Decomposed surface film of the form LiOH, ROLi and LiF would not be useable
lithium inventory and would become a precipitate in the electrolyte solvent or else comprise
surface film [77]. This decomposition then allows for electron tunnelling through a, now,
thinner surface film layer and further reduction of the electrolyte happens. The result is further
capacity loss through re-forming of the surface film layer. However, because 70oC is a higher
temperature than expected during normal cell use it should not occur during normal cell
21
around 55oC. The temperature chosen within these studies should be lower than this to allow
for such nuances.
3.2.3. Low Temperature
3.2.3.1. Lithium plating
Lin et al. [78] and Smart and Ratnakumar [68] tested MCMB-LiCoO2 cells at low temperatures,
-40 to 25 oC. Using a Li reference electrode placed between the anode and cathode they
determined that interfacial resistance and thus lithium plating was the primary cause of capacity
fade. The mechanism they propose is that Li concentration increases at the negative electrode
due to intercalation not being energetically favourable at low temperatures (e.g. -20 oC) during
charge. Because the concentration of Li has increased at the surface of the electrode, reaction
of lithium with the electrolyte, which is thermodynamically favourable at these temperatures
then occurs and thickens the surface film.
3.2.4. Current rate during charge
3.2.4.1. Lithium plating
Lithium plating has been discussed previously with respect to SoC in section 3.2.1.1 and with
respect to low temperature in section 3.2.3.1. In addition to both SoC and low temperature
multiple sources [65,68,48] have shown that increased current during charge speeds up the rate
of lithium plating at the negative electrode. It is likely that each of these causes will have a
contributory impact to the rate of lithium plating and the mechanisms induced are likely to
combine. For example, Figure 5 shows a pore blocking mechanism that lithium plating induces.
This could be accelerated even further at low temperatures and increased current rates. The
reason that lithium plating occurs at high currents is due to its electrochemical potential and
22
of the cell is affected by current rate is shown by equation (6), which is ohms law for a cell.
Where V (potential of the electrode) is determined by E, which is represented by SoC, the
current rate (I) and the cells internal resistance. As the current rate increases the potential of
the electrode reduces. Therefore, as current rate increases the potential of the electrode will
reach the potential at which lithium begins plating at a lower SoC.
V = E – IR (6)
3.2.5. Vibration
Vibration has been referred to as a possible cause of ageing [79]. These authors have only
referred to it in passing. For example, Svens et al. [80] refer to it as a factor of ageing in
performing laboratory tests that replicate real life but no further information is given or implied.
Testing for the possible ageing associated with vibration is a niche market because consumers
throw away cells after only a few years use. They are often disposed of before vibration has an
effect. For this reason, some authors have referred to the expensive and costly nature of creating
reproducible data on ageing mechanisms associated with vibration [80]. Therefore, vibration
remains essentially untouched in terms of its impact on lifetime of lithium-ion cells. The author
has been unable to find any examples of the impact of vibration on the negative electrode, or
any electrode for that matter. However, electric-vehicles may be subjected to harsh vibration
profiles and the impact of vibration on materials in general is well established [81].
3.2.5.1. Electrode flaking
The only literature on electrical performance was a five minute vibration test using a varied
23
needed to conclusively determine whether vibration has an impact on the lifetime of
lithium-ion cells.
Research has been done into impact of vibration on lead –acid batteries and this mechanism
may extrapolate to lithium-ion cells. For lead-acid batteries as the electrode flakes and erodes
due to temperature, vibration can increase the rate at which these flakes then break off [82],
presumably through mechanical damage or interaction of the flakes with the separator. For
lithium-ion cells this would increase the rate of subsequent surface film formation and thus
reduce capacity.
3.2.6. Orientation
NASA performed an orientation test on a single seven amp hour cell with 100% SoC at room
temperature [83]. It prematurely failed after 630 cycles, although with destructive analysis no
ageing mechanism was discernible. Further tests on different cells showed no ageing associated
with 100% %SoC at 398 and 413 K after 1000 cycles. Whereas, for cells float charged
(maintained at the same voltage) at 4.1 V, orientation made no difference at 25oC but failed
after 115 days at 45oC. All four of the vertical cells were kept in inverted orientation but with
no control cells [64]. Essentially, no useful information was obtainable from their test because
of premature cell failures that did not align with a specific orientation. Three years later the
supplier of the cells for the Mars Rover missions ‘YARDNEY’ stated in its data sheets that its
cells can operate in any orientation including zero gravity [84]. There has not been much
investigation into the impact of orientation on cell capacity or resistance. Further work is
24
3.2.7. External pressure
High external pressure such as when a cell is placed within a module or pack caused consistent
capacity fade when compared to unconstrained or lightly constrained cells [85]. Loss of
cycleable lithium was shown by localised deformation in the separator and surface film of the
anode with post-test analysis of the cells using scanning electron microscopy (SEM). No other
studies have been performed to investigate external pressure affects ageing so further work is
required.
3.2.8. Discussion
The chemical changes that each of the seven mechanisms induce are summarised in Figure 6.
Joining the results of primary and secondary mechanisms shows that creation of surface film
at the negative electrode is the ultimate cause of ageing within the cell under these conditions – and is even a product of increased lithium plating.
It is not clear whether vibration, orientation or pressure impact cell performance at all, although
in keeping with the other lifetime impacting factors if vibration does impact the cells, it may
25
This literature review shows that post-mortem analysis should be centred on investigation of
the negative electrode surface films composition. If this assumption is accurate, then
accelerating the condition will impact cell performance without chemically altering the surface
film. If this is the case and the chemical nature of the surface film does not change, then it is
[image:44.595.85.520.107.512.2]crucial that analysis be performed to determine the surface film’s thickness. This is because, as Fick’s law shows (4), diffusion into the bulk of the material is dependent on temperature, path
26
length (thickness) and the diffusion coefficient (chemical structure of the surface film).
Therefore, the chemical structure of the surface film and its thickness are key parameters in
connecting the post-mortem results to electrical performance.
Surface film at the negative electrode is cited as the primary mechanism of cell ageing by
multiple authors [86-90]. This conclusion is supported in a highly cited review of degradation
mechanisms for lithium-ion cells by Vetter et al. that ageing is caused by reactions at the
electrode surface [6].
However, the positive electrode has been shown to contribute to the ageing of lithium-ion cells.
Wright et al. performed a study on over 300 commercial cells tested at three different national
laboratories within the United States of America. They concluded that oxidation of the
electrolyte at high SoC at the positive electrode was the cause of decreased cell performance
[91]. However, this assertion appears to be based purely on a paper by Guyomard and Tarascon
[92] that studied the electrical performance of cells with voltages that exceed the 4.2V reached
in commercial cells. The majority of the work that Wright et al. perform is also on cells at
greater than 40oC. This suggests a potential maximum temperature that the cells can be stored
at, within this study, of around 40-50oC, because the change in resistance occurs within this
juncture.
This work is seeking to understand, measure and predict ageing of commercial lithium-ion
cells. The majority of literature focuses on a surface film that forms at the negative electrode
and assumes that the positive electrode contribution is negligible. This assumption is also made
for this work, which is especially appropriate considering the temperatures that will be
27
3.3.
The negative electrode Surface film
This section begins by investigating the origins and current understanding about the negative
electrode surface film and concludes with which analytical techniques can be used to study it.
3.3.1. Introduction to the negative electrode surface film
In 1979 Peled proposed that whilst the transfer of Li+ ions was occurring parasitic reactions
also occur. The product of these parasitic reactions, forms at the interface of the electrolyte and
active material [93]. His work was performed on alkali and alkaline based earth metals in
non-aqueous battery systems; he called this surface film a solid electrolyte interphase (SEI). There
is some confusion in using this term because some surface films do not form an interphase
between the electrolyte and the surface film. These terms are used interchangeably within this
work. Fong et al. showed this mechanism was also true for lithiated graphite within
lithium-ion cells [94]. And that formatlithium-ion of this film was coupled with a sharp reductlithium-ion in capacity and increase in resistance within the first few cycles of the cell’s life. This occurs because the
abundant electrons that provide current to the external electrical circuit are freely available to
the electrolyte. As the Li+ intercalate into the active material the electrodes are at the correct
potential for reaction with the electrolyte. These electrons migrate through the electrically
conducting active material from the site of lithium de-intercalation and react with the solvent.
However, this performance decline is not as severe after the first few formation cycles [95].
The reason is that the formation of this surface film passivates the electrode to further similar
parasitic reactions [96]. Therefore, this passivating film must be at least partly electrically
insulating, because the cell does not continue to lose capacity and increase in resistance at the
same rate. But it is also ionically conductive, to allow intercalation to still take place. This