University of Warwick institutional repository: http://go.warwick.ac.uk/wrap
A Thesis Submitted for the Degree of PhD at the University of Warwick
http://go.warwick.ac.uk/wrap/55722
This thesis is made available online and is protected by original copyright. Please scroll down to view the document itself.
A geometrical-based approach to recognise structure
of complex interiors
by
Shazmin Aniza Abdul Shukor
A thesis submitted to in partial fulfilment of the requirements for the degree of Doctor of Philosophy in Engineering
i
Table of Contents
1 Introduction 1
1.1 Background, motivation and context of the research ... 2
1.2 Research questions, aim, objectives and contributions ... 7
1.2.1 Research questions ... 7
1.2.2 Aim ... 7
1.2.3 Objectives ... 7
1.2.4 Contributions ... 8
1.3 Publications ... 9
1.4 Thesis outline ... 10
2 Review of 3D Modelling Methods from Laser Scanner Data 12 2.1 Laser scanner for data collection ... 14
2.2 Data preprocessing ... 17
2.2.1 Noise data removal ... 17
2.2.2 Data registration ... 20
2.3 Modelling the data ... 23
2.3.1 Surface reconstruction ... 24
ii
2.4 Data interpretation ... 32
2.5 Quantitative assessment for point cloud data ... 34
2.6 Current issues with laser scanner data modelling ... 36
3 Survey Methodology: Making Statistical Inferences 42 3.1 Survey preparation ... 44
3.1.1 Designing the questionnaire ... 44
3.1.2 Finding the respondents ... 45
3.2 The respondents ... 46
3.3 Results and discussions ... 48
3.4 Summary ... 52
4 Hardware: Collecting 3D Data of Building Interior 54 4.1 Ways to collect 3D interior data ... 56
4.1.1 Fusing similar and different sensors ... 57
4.1.2 Using 3D laser scanners to collect 3D data ... 67
4.2 Building interior data collection ... 75
4.2.1 Methodology ... 76
4.2.2 Results and discussions ... 77
4.3 Summary ... 85
5 PreSuRe Algorithm: 3D Modelling and Mapping of Complex Interiors 88 5.1 Overview of PreSuRe pipeline ... 90
iii
5.2.1 Noise data removal ... 92
5.2.2 Data registration ... 100
5.3 Data surfacing ... 106
5.4 Data modelling ... 113
5.5 Data assessment ... 121
5.6 Results and discussions ... 124
5.7 Contributions ... 130
6 PreSuRe Algorithm: Verification and Validation 132 6.1 Data preprocessing ... 133
6.2 Data surfacing ... 135
6.3 Data modelling ... 138
6.4 Discussions ... 141
6.5 Summary ... 146
7 Interior Scene Understanding: Applications 147 7.1 3D as-built drawings ... 148
7.2 Autonomous vehicle navigation ... 154
7.3 Historical building conservation ... 157
7.4 Facility management ... 159
7.5 Contributions ... 162
8 Conclusions 164 8.1 Adapted SICK PLS 101 laser scanner ... 165
iv
8.3 Contributions ... 167
8.4 Limitations ... 169
8.5 Further work ... 171
References 173
Appendix A: Questionnaire for Survey Methodology 182
Appendix B: 3D Modelling Results of Testing Data 184
v
List of Figures
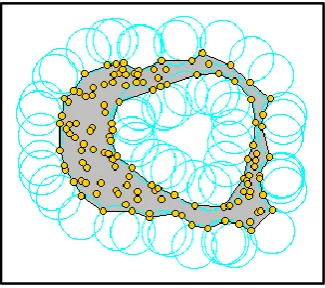
2.1 Alpha shape method, on 2D example, determines the shape of this points by rolling a predefined ball around them (Source: Computational Geometry Algorithms Library, 2012) ... 19
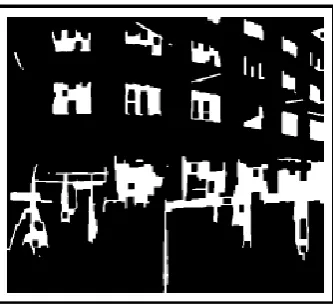
2.2 Binary image of a building to detect windows (Source: Ali et al., 2008).. 20 2.3 ICP is used to register new data (in maroon) into model data (in blue):
(a) original position of data before registration; (b) the registered data after 66 iterations (Source: Kroon, D.J., 2009) ... 22
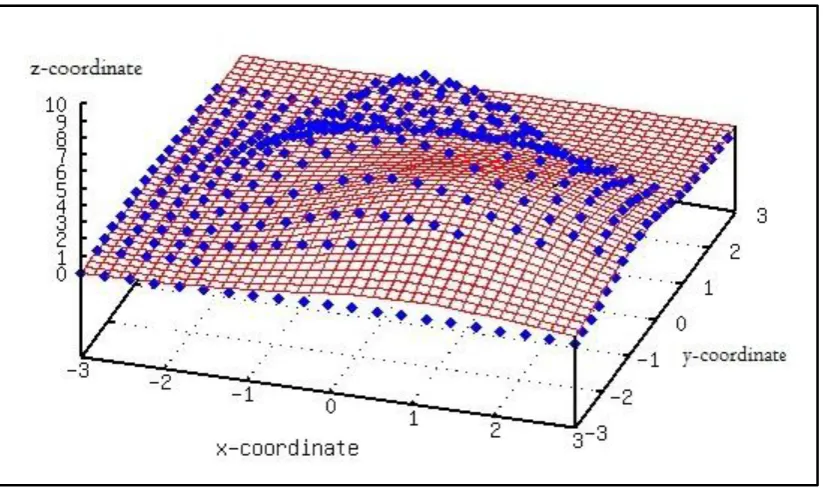
2.4 Fitting a surface onto a set of 3D points using least square (Source: OptimEFE, n.d.) ... 25
2.5 Voxel representation of a smooth teapot as on the right (Source: Mattausch, O., 2011) ... 26
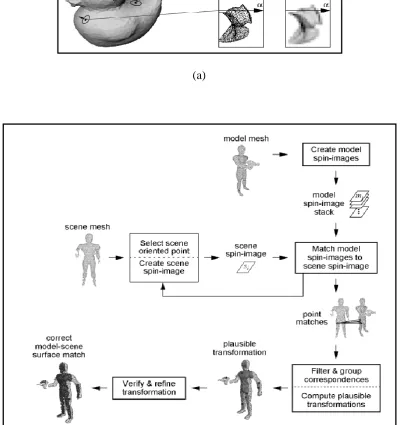
2.6 (a) Summary of how spin images are generated from various vertices; (b) the overall process of surface reconstruction (Source: Johnson & Hebert, 1999) ... 28
2.7 A summary of convex hull in 3D points: (a) the raw data; (b) the seed triangle which forms the basis of surface reconstruction; (c) a point in the right side of the seed triangle is recognized; (d) the point in (c) is used as the edge of a new triangle; (e) moving on to the next side where another point is recognized and be used to develop new triangle as shown in (f); (g) the final reconstruction representing all the points (Source: Lambert, 1998)... 29
2.8 Example of early surface reconstruction from laser scanner data. Notice that only outer surfaces were reconstructed, disregarding the occluded region (Source: (a) Han, et al., 2002, (b) Whitaker, et al., 1999) ... 31 2.9 Some examples of geometry estimation made by Castellani, et al., 2002,
where the blocks represent clutter with lines or curve going through them ... 31
vi
3.1 Survey respondents' background: (a) position held by respondents in this survey; (b) company or firm where the respondents work ... 47
3.2 List of disadvantages of existing, traditional method in producing building interior drawing ... 50
3.3 Current limitations of 3D modelling for building interior using laser scanner data ... 50
4.1 An example of early work in reconstructing surfaces behind occlusion, where in this case the interest surface is a partial or close-up view of a wall behind the chair: (a) the 3D point cloud data; (b) the resulting reconstruction (Source: Stulp, et al., 2001) ... 57 4.2 The idea behind a stereo vision system - two cameras located in parallel
with a distance (baseline), which resembles human's vision ... 58
4.3 The importance of camera's position to capture occluded surface behind the black box ... 60
4.4 Sample of result from Furukawa, et al. (2009): (a) the image of the interest kitchen interior; (b) the resulted reconstruction from the image in (a). Notice that the result is similar to the early work in surface reconstruction from laser scanner data as shown in Chapter 2 (refer to Figure 2.8) where only outer surfaces were reconstructed, disregarding the occluded region (Source: Furukawa, et al., 2009) ... 61 4.5 (a) Autodesk's suggested camera location (shown in blue cubes) to
gather interior images; (b) sample of images from various camera locations; (c) the 3D model produced by 123D Catch software using these images (Source: Autodesk 123D, 2012) ... 63
4.6 Users need to plan the accessibility of the target to create an ideal model: (a) it is advisable to get front and top view of the model at varying angles; (b) a sample of images taken from varying angles of an object from side and top views (Source: Autodesk 123D, 2012) ... 64
4.7 Station marker usage: (a) anchor station marker; (b) how to place an anchor station marker on the ground (Source: SCCS Survey, 2012); (c) station marker in the US (Source: Land Surveyor Directory and Surveying Guide, 2012) ... 65
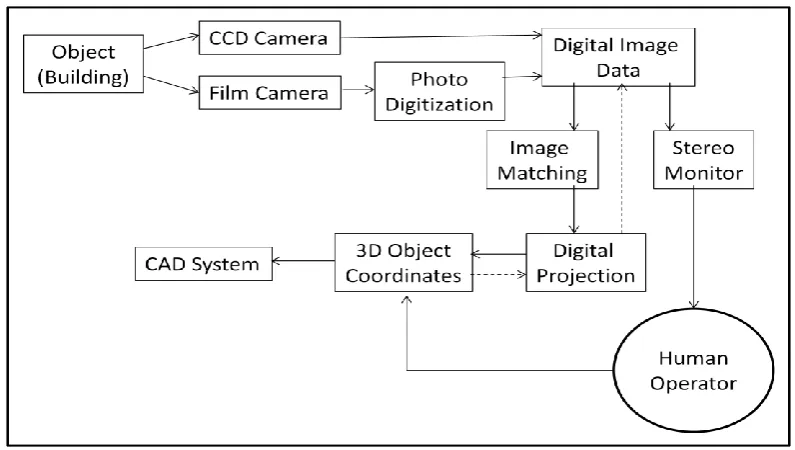
4.8 Digital photogrammetry process for building architecture application (Source: Albertz & Wiedermann, 1995) ... 66
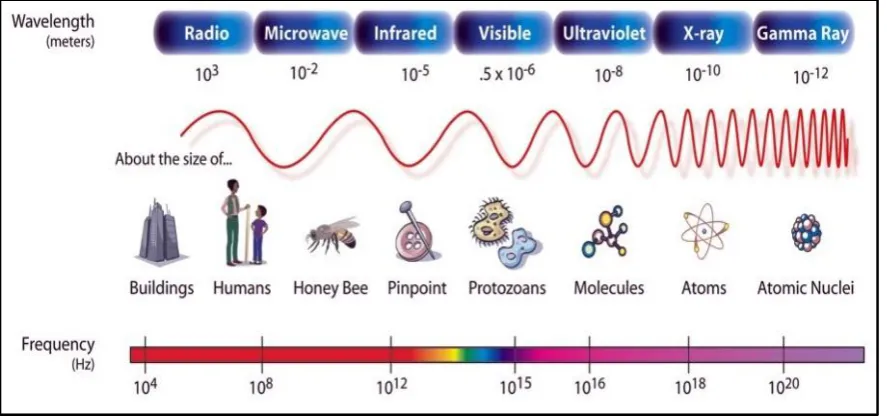
4.9 The electromagnetic spectrum. Since infrared has shorter wavelength than radio, it has higher resolution (Source: NASA, 2012) ... 68
vii
4.11 Top view of SICK PLS laser scanner, showing its scan area. It scans up to semicircular plane horizontally ... 70
4.12 (a) SICK PLS 101 laser scanner; (b) the servo motor mounted below the scanner allows it to scan up to a hemispherical area in a single operation. 71
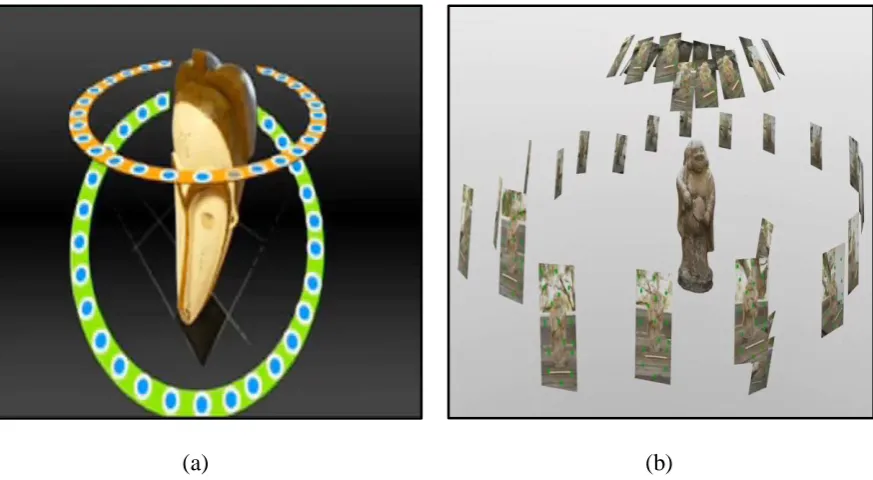
4.13 Scanning Stonehenge using 'butterfly-shape' and sphere shape target (Source: Greenhatch Group, Ltd., 2010)... 73
4.14 Example of 2D targets used to register 3D laser scanner data: (a) a picture of sphere used as a target in registering data of an ancient building; (b) a unique shape used as targets to register interior data; (c) the target template used in (b); (d) spheres were placed around object of interest; (e) result of (d) ... 74
4.15 Some examples of complex geometry structures of building interiors: (a) a sample of modern minimalist design for a home (Source: Juvandesign, 2012); (b) model of a complex interior in Spain (Source: HomeConceptDecoration.com, 2012) ... 75
4.16 (a) The chosen complex indoor environment, Room 4, used to generate 2 datasets for training and testing; (b) first and second hemispherical raw data of Dataset 4 from the above interior of 50,777 points... 79
4.17 (a) Room 5, which generate 2 datasets for training and testing; (b) and (c) First and second hemispherical raw data of Dataset 5 (50,364 points) from Room 5 ... 80
4.18 The initial data representing Room 3 when the laser scanner is placed against a wall. Red circle shows the furthest wall, while green represent the side wall ... 83
4.19 Layout of rooms with complex geometry structure used in this research: (a) and (b) Room 5 with a pillar nearby one corner; (c) layout of another interesting interior, where if the scanner is being placed at the 'X' mark, it will not able to collect data to represent the wall as in the red circle, with the blue-dashed line represent its line of sight; (d) the collected data with location of the laser scanner as in (c), where the red circle denotes the missing surface ... 85
5.1 Pipeline for the algorithm developed in this research ... 90
5.2 Example of histogram representing a grey-scale image shown above it ... 94
5.3 The vertical histogram used in Okorn, et al. (2010) to represent entities in interior (Source: Okorn, et al., 2010) ... 95
viii
5.5 Raw data of Room 3 as collected by the laser scanner, ready to be cleaned ... 97
5.6 Histogram of XY plane of the raw data, counting the number of points in each axis. By calculating and setting the margin as the average value, outliers can be removed ... 97
5.7 Result from the XY noise removal, note that there is still some noise data, hence second histogram is conducted ... 98
5.8 Second histogram of XZ plane is created. Noise is being removed using similar approach as the first histogram ... 98
5.9 Clean, ready to be reconstructed data ... 99
5.10 Result of applying a third histogram for YZ plane, it will only removed required data thus not needed ... 99
5.11 How a typical data registration method works, where the algorithm tries to register / match new data (in magenta) to existing model data (in blue). Note that it needs a large percentage of overlapping points: (a) shows an original view of the model with new data overlaid, (b) Resulting model after applying a data registration method, in this case the Finite ICP method (Kroon, 2009) ... 101
5.12 Data registration algorithm developed in this research ... 104
5.13 (a) Original data of Room 5, where the data in red can be assumed as A and blue for B; (b) result of data registration algorithm applied to B, with the angle of difference between the two sets of side wall points (as indicated by the black arrow in (a)) is calculated to rotate the other half data, B, (now shown in black) for registration ... 105
5.14 Reconstructing surfaces from noisy Stanford Bunny data using ball pivoting, (a) Original noisy data, (b) The reconstruction outcome (Source: Angelo, et al., 2011) ... 107
5.15 Ball pivoting algorithm in 2D: (a) the ball rotating / pivoting and connecting the points with edges; (b) holes will be created for low density points; (c) importance of selecting the correct ball radius - if it's too big then the ball can't reach the point at shallow end (Source: Benardini, et al., 1999) ... 108
5.16 (a) Radius ( = 0.1); (b) Radius ( = 0.5); (c) and (d) Radius ( = 0.05), where (d) shows the location of the mesh ... 110
ix
5.18 Result of assigning the surfaces according to the definition works with
partial room data ... 115
5.19 Results of applying histogram to recognize surfaces of interior ... 116
5.20 Results of applying: (a) RANSAC; (b) EM; (c) PCA; to Room 3 data for surface reconstruction ... 118
5.21 Relationship modelling used in this research to aid reconstructing the real interior (Source: Abdul Shukor, et al., 2011) ... 119
5.22 Reconstruction result of Room 1 data: (a) before relationship modelling; (b) after applying relationship modelling ... 120
5.23 Resulting surfaces from data surfacing method. Surfaces representing clutter (as in red circles) has been removed by the algorithm ... 124
5.24 Data preprocessing result of Dataset 2 ... 128
5.25 Data surfacing result of Dataset 2 ... 128
5.26 3D modelling and interpretation of Dataset 2 ... 129
6.1 Resulting clean data of Dataset 1 ... 133
6.2 Resulting clean data of Dataset 3 ... 134
6.3 Resulting clean data of Dataset 4 ... 134
6.4 Resulting clean data of Dataset 5 ... 135
6.5 Data surfacing result of Dataset 3 ... 136
6.6 Data surfacing result of Dataset 4 ... 136
6.7 Data surfacing result of Dataset 5 ... 137
6.8 3D modelling of Dataset 1 ... 138
6.9 3D modelling of Dataset 3 ... 139
6.10 3D modelling of Dataset 4 ... 139
6.11 3D modelling of Dataset 4 where ceiling is removed to show the interior model ... 140
6.12 3D modelling of Dataset 5 ... 140
x
6.14 The clean data of: (a) the first half; (b) the second half of the previous data, preprocessed using PreSuRe algorithm ... 143
7.1 Room 4: (a) 2D as-built drawing; (b) 3D model developed in this research; (c) ceiling can be removed to provide more visualization ... 149
7.2 Semantic information offered by PreSuRe algorithm, where the model is being modified automatically once the floor measurement is being changed. This semantic features can assist professionals in planning future renovations ... 152
7.3 The model developed in this research could also be used to show important measurement ... 153
7.4 Ceiling can also be removed to show to view model of the room ... 153
7.5 The raw data collected by the UAV, (a) in 3D, (b) in 2D ... 155
7.6 3D model of the above raw data reconstructed using the same method developed in this research ... 156
7.7 Author's impression on how to utilize the model developed in this research to provide education and visualization of historical building interior, plus preserving it at the same time ... 158
7.8 (a) Typical representation of space management's software features (based on estate management software called QuEMIS used by Space Management and Timetabling Unit, University of Warwick), people need to click the view to get access to the as-built drawing and more descriptions on that particular space, which leads to another platform or software package needed to be opened, as shown in (b) ... 161
xi
List of Tables
2.1 Comparison of 3D laser scanner ... 16
2.2 Issues in currently available methods in collecting and processing point cloud data, especially for interior ... 39
3.1 Summary of potential respondents for this survey ... 45
3.2 Details of respondents ... 48
3.3 Offered vs. required - summary of current software's limitation and the comparison with this research ... 53
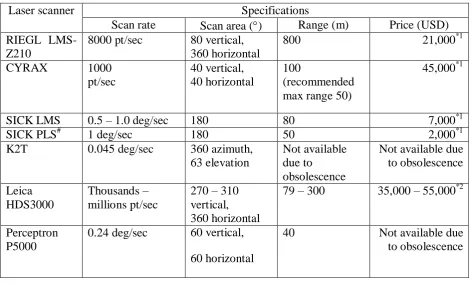
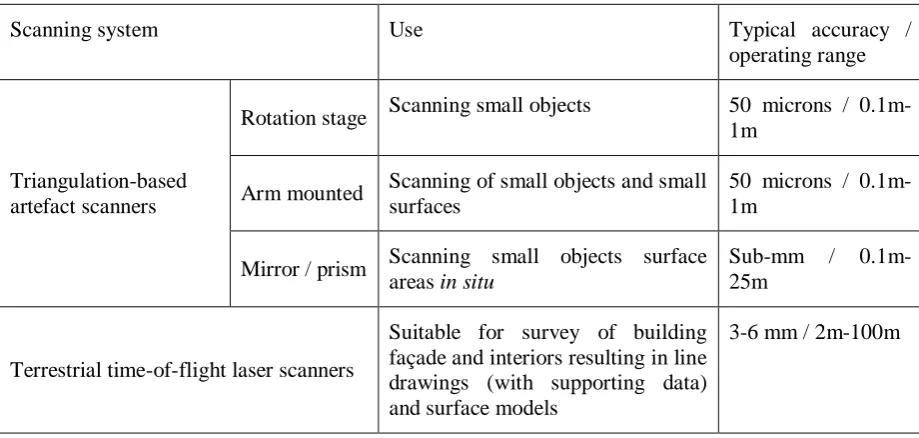
4.1 Laser scanners and their specifications (Source: Barber, et al. (2006) cited in Jones, ed. (2007), p.7) ... 55
4.2 Chronology of 3D interior modelling ... 58
4.3 Guidelines for 123D Catch users (Source: Autodesk 123D, 2012) ... 64
4.4 Specification of SICK PLS 101 laser scanner (Source: Abdul Shukor & Young, 2011a) ... 72
4.5 Data collected at the first stage using SICK PLS 101 laser scanner ... 78
4.6 Summary of potential location of laser scanner in collecting interior data .. 81
5.1 Summary of existing data registration methods ... 102
5.2 Summary of data reconstruction method tested to the interior data collected in this research ... 117
5.3 The training and testing datasets collected in this research to verify the algorithm ... 125
6.1 Percentage of noise data removed by PreSuRe algorithm ... 135
xii
6.3 Data assessment results of all modelling ... 144
xiii
List of Abbreviations
AEC Architecture, Engineering, Construction
BIM Building Information Modeling
CAD Computer Aided Design
CNC Computer Numerical Control
EM Expectation-Maximization
FM Facilities Management
ICP Iterative Closest Point
LADAR Laser Detection And Ranging
LIDAR Light Detection And Ranging
LoD Level of Detail
NASA National Aeronautics and Space Administration
PCA Principal Component Analysis
RADAR Radio Detection And Ranging
RANSAC RANdom SAmple Consensus
RP Rapid Prototyping
SLAM Simultaneous Localization And Mapping
SVM Support Vector Machine
xiv
Acknowledgements
Firstly, I would like to thank Allah s.w.t. for His blessings in making this possible. I would
also like to express my upmost gratitude to my supervisors, Dr. Emma J. Rushforth and Prof.
Ken Young for their constant guidance and support. Also not forgetting the Ministry of
Higher Education Malaysia and Universiti Malaysia Perlis for the financial support
throughout the study.
I would also like to thank the members of Warwick Manufacturing Group, University of
Warwick, in particular Stefan Winkvist, Shay O'Sullivan, Thomas Osgood and Conal Brown
for their technical help and guidance. I am also thankful for all the responses obtained from
related professionals and experts in completing the survey, as well as the contributors to the
open source resources used in this work.
I would also like to acknowledge my husband, Afdzan Rizal Abd Razak, my son, Ammar
Zaqwan and the rest of the family for their continued support.
Last but not least, I would like to thank everyone who has help me in one way or another,
xv
Declaration
I declare that all the work described in this report was undertaken by myself (unless
otherwise acknowledged in the text) and that none of the work has been previously submitted
for any academic degree. All sources of quoted information have been acknowledged by
xvi
Abstract
3D modelling of building interiors has gained a lot of interest recently, specifically since the
rise of Building Information Modeling (BIM). A number of methods have been developed in
the past, however most of them are limited to modelling non-complex interiors. 3D laser
scanners are the preferred sensor to collect the 3D data, however the cost of state-of-the-art
laser scanners are prohibitive to many. Other types of sensors could also be used to generate
the 3D data but they have limitations especially when dealing with clutter and occlusions.
This research has developed a platform to produce 3D modelling of building interiors while
adapting a low-cost, low-level laser scanner to generate the 3D interior data. The PreSuRe
algorithm developed here, which introduces a new pipeline in modelling building interiors,
combines both novel methods and adapts existing approaches to produce the 3D modelling of
various interiors, from sparse room to complex interiors with non-ideal geometrical structure,
highly cluttered and occluded. This approach has successfully reconstructed the structure of
interiors, with above 96% accuracy, even with high amount of noise data and clutter. The
time taken to produce the resulting model is almost real-time, compared to existing
techniques which may take hours to generate the reconstruction. The produced model is also
equipped with semantic information which differentiates the model from a regular 3D CAD
1
Chapter 1
Introduction
“For, usually and fitly, the presence of an introduction is held to imply that there is something of
consequence and importance to be introduced”
- Arthur Machen*
3D modelling of existing building interiors has gained a lot of interest since the late 1990s,
due to the increasing development of Building Information Modeling (BIM), as well as the
rapid development of 3D laser scanners. BIM is a process developed to assist prior to and
during construction stages of new buildings that combines visualization technologies (3D
modelling) with related information such as cost and timing. Due to its benefits, BIM is then
extended further for currently in-use interiors. To develop this 3D model, 3D measurement
systems such as the 3D laser scanner have been used to collect 3D data representing the
interiors. Despite this growth, developing 3D modelling of interior that is still in-use,
however, is challenging. Quoting Smith and Tardif (2009) in their book about BIM, although
BIM has been implemented widely in developing new buildings, adapting BIM in existing
*
2
buildings is 'continually improving'. This is due to several reasons such as the existence of
clutter, in terms of furniture and people as well as its complex interiors.
This research is being developed with these challenges in mind - with the intention that all the
professionals involved in the above mentioned applications could obtain some benefit from
the developed method. People from a variety of backgrounds - from architects, engineers, to
geospatial intelligence as well as computer graphics developers - all have shown a lot of
interest in working within the same field since knowing the potential of this area of work.
Nevertheless, there are still some restrictions from these methods developed by them that
could not be overlooked.
This chapter will discuss the context of this research, and the motivation behind the reason of
conducting this research. It will also mentioned the problem, aim and objectives of this
research, based on the description of current problems in this topic's area. Contributions from
this research will also be pointed out, together with their description on where to refer to for
more details on them, plus with a list of publications made throughout completing this
research. It will end with an outline of the overall thesis to show the flow of its structure.
1.1 Background, motivation and context of the research
Before going further into detail about this research, it is good to know about its background
first. Although 3D digital representation or 3D modelling in short, has benefited a lot of other
applications such as assisting industries in design, measurement and inspection of their
products, it has only been introduced to the Architectural, Engineering, Construction (AEC)
3
represent a building, especially building interiors, apart from archaeologists who try to
conserve and record important and historical building interiors, mainly through
photogrammetry, which will be discussed further in Chapter 4.
But when American architects and engineers introduced 3D modelling to aid building
construction, which is part of Building Information Modeling (BIM), experts and
professionals in AEC have now started to use 3D modelling in constructing new buildings.
By using BIM, architects and engineers use 3D modelling to illustrate how the building will
look like to the owner and contractors before the construction starts. Contractors will be using
the same model to build up the building, and later, building owners and managers can use the
same model as the as-built drawings for maintenance purposes. The continuous use of the
same 3D model in BIM, is being referred to as building lifecycle and is very functional as all
related people are only using and depending on the same 3D model to design, construct and
use the building, compared to the current method where different drawings and platforms are
used. Apart for AEC, 3D modelling of building interiors are getting more attention in mobile
robotics navigation as well as preserving historical buildings applications too.
However, in order to develop a 3D model for an indoor environment that is currently in use, a
suitable measurement system is needed to gather and collect the data representing this real
environment. But, as these buildings are often occupied and full of clutter, getting the
information about the spaces inside the buildings could be difficult. In the context of this
research, "clutter" represents other things apart from the one defining the closed-surfaces of
the room (wall, ceiling, floor), such as the furniture and other equipment like computers, bins,
4
shadows within the data signifying the surfaces due to clutter, which create incomplete and
missing data.
Although there are a lot of sensors that are currently available to collect necessary 3D data for
the modelling, not all of them are suitable to handle these clutter and occlusion issues. Earlier
work even used sensor fusion systems to collect these 3D data sets. The term "sensor fusion"
refers to a system which consists of similar or different sensors together or both, where in
here, the data that is collected by all the sensors needs to be fused or processed together to
obtain the 3D data. Sensors like cameras and 2D lasers are often fused together to enable the
system to collect data in 3D. But the most recent development is to use a 3D laser scanner to
collect the interior data. Being a rapid acquisition system that is capable of producing a high
density point cloud data with good accuracy, these elements are necessary when developing
such modelling as these are needed by the professionals to assist their work, thus making the
system more preferred to collect the interior data. However, the supplied 3D point cloud data
does come with redundant data called "noise data", which represents the point cloud that does
not resemble the overall image of the space, for example outliers that are outside of the room.
Another related issue is the correct modelling method that needs to be applied to the data
obtained in order to produce an accurate 3D model which represents the desired interior.
Existing methods that can be used to process point cloud data generated by the laser scanner
are sometimes limited to process synthetic items data. "Synthetic items data" is referring to
the data of man-made objects like toys and historical statuettes, that have been collected in a
controlled environment, where the surroundings (lighting, percentage of clutter and
occlusions, etc) is changeable according to the needs. All this information about methods to
5
to be used to collect the interior data, will be examined further in Chapter 3 and 4,
respectively.
Hence, we can see the importance of 3D modelling that represents building interiors, for the
above applications. Due to this importance, this research is being done to handle several
issues related with the development of 3D modelling of indoor environments. The context of
this research is within the scope of investigating the usage of point cloud data obtained from a
3D laser scanner to develop in-use building interior models. Here, the interior is a closed
space that usually exists in most buildings, for example office space (individual and open
plan office), class rooms, lecture halls, discussion or meeting rooms, etc. As most of the
spaces inside this type of building are within the scope of this definition of closed interior, it
should cover most of them, with exception for spaces like a large open space or a long
corridor where the wall may be outside the scanner's range. The algorithm developed from
this research will be used to reconstruct 3D digital representation models and mapping of the
closed space, whether they are "complex indoor environments" or just "sparse rooms". In this
research, "complex indoor environments" represents an interior with complex geometry
construction or composition of the building (for example, layered ceiling, existence of pillars)
as well as non-structural interior (such as cable skirting), together with the presence of
furniture and equipment that will create occlusions and clutter issues, while "sparse room" is
a cubic structure of a room (box-type) with less objects that would create slight clutter and
occlusion problems. The resulting 3D model will consist of some "mapping" features as well,
where it labels the important surfaces that exist in the interior. These features are important,
6
The resulting model should consist of a level of detail which suits any type of application that
might want to employ it and it has no preference for a particular application. Therefore the
reconstruction can be used to represent the closed space in general for architecture, property
management, historical building conservation as well as autonomous vehicle mapping
applications.
Based on the above explanation, this research is about developing an algorithm that is
suitable to process 3D point cloud data from a laser scanner that has been used to collect data
of a room that is currently in use. The algorithm will reconstruct existing surfaces within the
room and map the entity accordingly to aid visibility. This 3D map can act as a valuable
record for architects and civil engineers - which is very helpful for future structural
renovation or maintenance, as the current interior might differ from the initial design, that is
the drawing that was used to construct the building originally, may have altered. Furthermore,
old buildings may not have any blueprint or diagram to represent its interior conditions. From
a facility and building management point of view, this 3D map can be used to verify space
usage and efficiency. Apart from that, it can also serve for building conversion and
conservation. Mobile robots can use the map for navigation around the interior. As the future
will predict a lot of usage of domestic robots, these autonomous mobile robots will start to
inhabit a normal building and as such, 3D maps will be useful to help them to perform any
7
1.2 Research questions, aim, objectives and contributions
1.2.1 Research questions
What are the limitations of current approach in producing modelling of existing
building interiors that can be overcome?
Where can advances in knowledge be made?
How can this knowledge advancement be used to overcome some of these
limitations?
1.2.2 Aim
This research aims to produce a modelling solution to process 3D point cloud data obtained
from a low-cost, low-specification laser scanner, in order to resolve current limitations and
gaps for developing 3D models of building interiors using laser scanner data. Lower
specification for this research, is defined as having a resolution of less than the
state-of-the-art laser scanner (less than 5 points per degree).
1.2.3 Objectives
To carry out a wider investigation into current approaches used in developing 3D
modelling for indoor surroundings through literature and survey to validate the gaps
and current limitations
To provide a solution for the cost of state-of-the-art laser scanner by using a low-cost,
8
To develop a suitable algorithm to process the data obtained from the cost,
low-specification laser scanner by adapting current methods and combining them with
novel methods
Finally, this research must incorporate a proof of concept by the means of empirical
evaluations that leads to the justification of novel contributions to knowledge.
1.2.4 Contributions
Contributions this body of research makes are as follows:
A review of existing techniques in producing 3D models of building interiors using
laser scanner data, plus additional information on current advantages and limitations
from 19 experts (refer to Chapter 3). These experts are individuals identified during
research who use interior 3D models or could use the models such as architects,
surveyors, AEC engineers, facility managers and geospatial intelligence.
An alternative, low-cost solution to collect 3D data representing building interiors. As
compared in Chapter 2, the state-of-the-art laser scanner is costly and prohibitive to
some, having a low-cost laser scanner could provide an alternative to collect 3D data.
More information on the adapted laser scanner can be obtained in Chapters 2 and 4.
A new platform that can be used to model realistic environments with clutter and
occlusions which can have ideal (or sparse) as well as non-ideal geometrical structure,
without the limitation of being applied to a single sample interior only. By combining
a new algorithm as well as adapting existing methods, this platform can be extended
to model new environments. Data which represents these environments of a sparse
9
Chapter 4 and Chapter 5 to show the workability of the algorithm in different
environments.
A new, novel technique for point cloud data registration. As current methods require a
high percentage of overlapping points, furthermore most of them are for registering
newly acquired data into model data, a new method to register interior data within
point clouds has been developed. This method will be discussed further in Chapter 5.
A new pipeline of algorithm for surface reconstruction modelling of building interior
from point cloud data. The approach of algorithm developed in this research is unique
and different from others, and will be mentioned further in Chapter 5.
An automatic solution, based on prior knowledge, to model 3D interior data. This is
developed due to the needs of greater automation in interior 3D modelling. This is
also discussed in Chapter 5.
Implication of proposed framework in the domain of AEC (Architecture, Engineering,
Construction), archaeology visualization application and mobile robot navigation as
potential future users of this work, as mentioned in Chapter 7.
Semantic information features offered by this algorithm differs from an ordinary 3D
CAD drawing, which is essential in assisting future renovation work. More
information on these semantic features can be obtained in Chapter 7.
1.3 Publications
Throughout conducting this research, several publications have been made on parts of the
10
Abdul Shukor, S.A. & Young, K. (2011). A fast knowledge-based plane
reconstruction method from noisy 3D point cloud data. In: Hamza, M.H. & Zhang,
J.J., eds. IASTED (International Association of Science and Technology for
Development), 12th International Conference on Computer Graphics and Imaging.
Innsbruck, Austria 16-18 February 2011. IASTED, pp. 24-31.
Abdul Shukor, S.A., Young, K. & Rushforth, E.J. (2011). 3D modeling of indoor
surfaces with occlusion and clutter. In: IEEE (Institute of Electrical and Electronics
Engineers), International Conference on Mechatronics. Istanbul, Turkey 13-15 April
2011. IEEE, pp. 282-287.
Abdul Shukor, S.A., Rushforth, E.J. & Young, K.W. (2011). A method for 3D
modelling of building interior from laser scanner data. In ISPRS (International
Society for Photogrammetry and Remote Sensing), Working Group V/2 Conference.
York, UK 17-19 August 2011. ISPRS (Abstract).
1.4 Thesis outline
Chapter 2 will review recent methods available in processing 3D point cloud data obtained
from laser scanners, starting from collecting the data, the data preprocessing, modelling,
mapping and finally measuring the accuracy of the final model. Some issues with laser
scanner data modelling will also be highlighted. Then, Chapter 3 is designed to highlight the
overall method used to meet the aim of this research. Next, Chapter 4 will discuss the
hardware used and the method of collecting 3D data in this research. A short chronology
about collecting 3D data to develop 3D interior model is also included for reference, and this
chapter will discuss the method chosen to collect the interior data of various indoor
11
interpret and measure the data. Comparison of other available methods with the chosen
method used here will be highlighted to support the decision of using this particular method.
Chapter 6 will focusing on the verifications and validations of the resulting models produced
by this research. Some potential applications based on the results obtained are being
mentioned in Chapter 7, to give more understanding and idea on how experts could exploit
the modelling developed in this research. Finally, Chapter 8 will conclude the research, with
a summary on the overall work done with its limitations and what future work can be done
12
Chapter 2
Review of 3D Modelling Methods from Laser
Scanner Data
“You can have data without information,
but you cannot have information without data”
- Daniel Keys Moran*
Laser scanners have been used extensively since the late 1990s for gathering data to produce
3D modelling. At first, no specified application was being highlighted for the processing and
modelling of a laser scanner’s point cloud data. Gradually, point cloud production from laser
scanners was being used for texture reconstruction, surface reconstruction and modelling of
various objects from simple geometric shapes to historical monuments and statuettes. Some
advantages of 3D laser scanners are:
High point density
Rapid acquisition of 3D data
Good accuracy (varies with type)
*
13
Although 3D laser scanners provide a lot of benefits in collecting 3D data, this approach still
has challenges that need to be addressed. As the most natural conditions for 3D modelling
applications, like building interiors and exteriors, will involve a great deal of occlusions and
clutter, one must prepare a solution on how to reconstruct affected surfaces. 3D laser scanners
are also used to reconstruct surfaces and textures for synthetic items. In this research,
"synthetic item data" would be referred to as the data that has been collected in a controlled
environment. In other words, the surroundings where the laser scanner is used to collect the
data of any particular item can be changed, like lighting and percentage of clutter and
occlusions. This would include data representing simple objects like toys, blocks, and even
historical statuettes and carvings.
Apart from the occlusions and clutter issue, due to the 3D laser scanner capability of
producing high point density, some scans could generate millions of points. Therefore, a
suitable method must be arranged to handle them. Although commercial software packages
such as Revit (by Autodesk) and Pointools (by Pointools Ltd) are available to handle this
matter, many interactions from users are still needed which makes these processes 100%
manual. Plus, the cost of the software is still high. Object recognition process is also
important especially in 3D interior modelling as there are a lot of surfaces and structures that
exist within a normal scene and most applications require them to be identified as well. All
these entities could then be labelled and mapped together to produce a semantic map that
represents the interior scene.
Due to the lacking of suitable method to handle these issues in processing point cloud data
(i.e. clutter and occlusions, raw data handling, manual process of commercial software,
14
them. But, before revealing the method developed in this research, it is good practice to
recognize existing methods in handling this matter. Thus, this chapter will highlight some of
the available methods published by other researchers for point cloud data processing
generated by the 3D laser scanners, especially towards interior modelling. It starts by
reviewing some commercially available laser scanners that have been used by others, then
continues with the methods of data preprocessing. After that, methods used for point cloud
reconstruction will be discussed. Techniques used in producing the semantic mapping from
3D point cloud data are also highlighted. As it is important to measure the accuracy of the
result, quantitative assessment methods are also reviewed.
2.1 Laser scanner for data collection
Due to the fact that 3D laser scanners are getting much attention in gathering 3D data, there
are a number of alternatives available in the market. 3D laser scanners are now available at
different levels of specifications like range, measurement and accuracy at a variety of costs.
Early researches used a laser scanner by K2T Inc. (now Quantapoint, Inc.) to obtain 3D data
for a close-range or partial surface reconstruction. Johnson and Hebert (1999) used it for
synthetic item reconstruction (i.e. a rubber duck) while Stulp, et al. (2001) and Dell ‘Acqua
and Fisher (2002) use it to reconstructed a partial building interior with a single occlusion.
This laser scanner was first developed by a group of researchers from Carnegie Mellon
University also called K2T, before being changed to Quantapoint to imitate its business side
(Quantapoint, 2011). At the same period, some research was being conducted using
Perceptron, CYRAX and Riegl laser scanners. Whitaker, et al. (1997) and Castellani, et al.
15
respectively, whereas Gueorguiev, et al. (2000) and Allen, et al. (2001) used a CYRAX laser
scanner to solve urban environment modelling. Han, et al. (2002) used Riegl laser scanner for
both real scene and synthetic surface reconstruction.
More state-of-the-art laser scanners and mobile laser mapping systems are also being used to
generate a more dense and accurate 3D data in recent times. Arayici (2007) used a higher
specification of Riegl laser scanner to reconstruct building exteriors for built environment
purposes. Leica laser scanners are used for synthetic data reconstruction by Yapo, et al.
(2008), whilst Budroni and Boehm (2009) used it for reconstructing planar surfaces of a
hallway and Brilakis, et al. (2010) used it for construction site modelling. Pu and Vosselman
(2009) used StreetMapper mobile laser mapping system to reconstruct a model of Esslingen
city in the Netherlands. A mobile laser mapping system is typically a laser scanner system
mounted on top of a vehicle (car or van) which enables it to collect terrestrial data, usually for
a large-scale urban outdoor application like highways and city modelling. Meanwhile, recent
researchers from Carnegie Mellon University obtained their 3D data from a professional
surveyor who uses a state-of-the-art laser scanner (Okorn, et al., 2010) (Adan & Huber,
2010).
As seen in the table, most of the researchers mentioned here are all using state-of-the-art 3D
laser scanners, which are prohibitive to some (refer to Table 2.1). Due to this cost factor too,
some researchers were depending on the data provided by the professionals, which create
difficulties as they could not have access to more data to test their method. As mentioned in
Tang, et al. (2010) in their review paper, one of the gaps in current research methods in
creating 3D as-built models from laser scanner data is the lack of methods that are capable to
16
on one interior scene (Adan & Huber, 2010) (Budroni & Boehm, 2009) (Xiong & Huber,
2010) (Eich, et al., 2010) due to the difficulties in producing 3D interior datasets as it is
costly to have the state-of-the-art 3D laser scanner. The lack of ability for the techniques to
be applied to various different interior scenes will make them less robust and it is more
appreciative if one could develop a general platform that can be used to produce 3D
modelling of any interior scenery.Therefore, it is good to have a low-cost solution which can
collect sufficient 3D data to represent existing building interiors.
Laser scanner Specifications
Scan rate Scan area () Range (m) Price (USD)
RIEGL LMS-Z210
8000 pt/sec 80 vertical, 360 horizontal
800 21,000*1
CYRAX 1000
pt/sec
40 vertical, 40 horizontal
100
(recommended max range 50)
45,000*1
SICK LMS 0.5 – 1.0 deg/sec 180 80 7,000*1
SICK PLS# 1 deg/sec 180 50 2,000*1
K2T 0.045 deg/sec 360 azimuth,
63 elevation
Not available due to
obsolescence
Not available due to obsolescence
Leica HDS3000
Thousands – millions pt/sec
270 – 310 vertical, 360 horizontal
79 – 300 35,000 – 55,000*2
Perceptron P5000
0.24 deg/sec 60 vertical,
60 horizontal
40 Not available due
to obsolescence
*1
Approximate price as of November 2010, *2Approximate price as of July 2011
#
[image:36.595.66.539.290.577.2]Laser scanner used in this work. With added servo motor, the scan area is widen to 180° vertical and 180° horizontal
Table 2.1: Comparison of 3D laser scanner (Note: Prices obtained from available internet
17
2.2 Data preprocessing
Before the point cloud data can be reconstructed to reveal its surfaces, it needs to be
preprocessed first to ensure the data used represents the real conditions of the object of
interest (or room area in this research). In this research, two preprocessing stages are being
discussed - noise data removal and data registration - as both are the important steps in
preprocessing 3D point cloud data before further reconstruction processes can being
executed.
2.2.1 Noise data removal
Noise data needs to be filtered or removed before reconstruction can be made as they can
contribute towards inaccurate modelling. Not all data provided by the 3D laser scanner is
clean and ready to be reconstructed. SICK laser scanners for example, are known for
producing noisy data. This is probably due to their specification which appeals to lower cost
industrial-based applications.
To remove noise data, some researchers like Arayici (2007), Meadati (2009) and Brilakis, et
al. (2010) used available commercial software to filter the data. Software like Revit and
Polyworks are used especially by experts and professionals in 3D interior modelling
development to remove unwanted data before further processes can be done. Although to
have access to specific software to filter the noise data is an advantage, the cost of the
software is prohibitive to some and this requires manual handling, which is very prone to
erroneous removal of important data as one can remove important data when filtering the
18
In the meantime, some other researchers leaved out the process of removing noisy data. They
assume clean, ready-to-be-processed data as this data is provided by the professionals, as it is
prohibitive to have access to the state-of-the-art laser scanner due to cost. Among them are
Okorn, et al. (2010), Stamos, et al. (2006) and Budroni and Boehm (2009). This is clearly not
applicable towards all cases. One may claim that the data produced by the state-of-the-art
laser scanner is perfectly clean, but they might have noise data that needs to be removed prior
modelling.
Bajaj, et al. (1995) uses alpha shape (or -shape) to define outliers from the data. -shape is
a method where it uses a predefined ball with a squared radius of to determine the shape of
a set of points. The ball will travel along the points to reveal the shape and the resulting shape
revealed by -shape depends on the radius of the chosen . Quoting Computational
Geometry Algorithms Library (2012) about -shape analogy:
'Let's say we have a tub of ice cream making up the space and containing the points as
chocolate chips. Using a spherical-shape ice cream scoop, we carve out all parts of the ice
cream block we can reach without bumping into the chocolate chips, hence we were carving
out holes in the inside, resulting an object bounded by caps, arcs and points. A very small
value of (i.e. a very small scoop) will allow us to eat up all of the ice cream except the chocolate chips, whereas a huge value of (i.e. a very large scoop) will prevent us even from
moving the scoop between two pints since it's way too large.'
Figure 2.1 shows a sample of 2D alpha shape. Although alpha shape works in his research,
19
occlusion, as Bajaj, et al. (1995) only used this towards synthetic items data which did not
[image:39.595.217.380.154.298.2]have any clutter and occlusions issues.
Figure 2.1: Alpha shape method, on 2D example, determines the shape of this points by
rolling a predefined ball around them (Source: Computational Geometry Algorithms Library,
2012)
Meanwhile, Ali, et al. (2008) use binarization to remove noise data. Binarization is a process
where a greyscale threshold is defined and applied to convert a greyscale image into a binary
image, i.e. black and white image. From the binary image, the object of interest (in this case,
windows as in Figure 2.2) can be detected. This method, however, can only be applied if one
is using sensors that able to produce range or image data (i.e. camera or laser scanner that can
20
Figure 2.2: Binary image of a building to detect windows (Source: Ali et al., 2008)
Some works, like in Adan and Huber (2010) perform manual data filtering processes before
the modelling processes. The problem in manual data filtering techniques is the tendency to
delete some relevant data (i.e. data representing the room structure) and this will contribute
towards inaccurate modelling later on. Manual preprocessing is also a tedious, time
consuming process, as users need to select the data carefully and check the result regularly to
ensure correct removal of unwanted data.
2.2.2 Data registration
It is common when performing a surface reconstruction using laser scanner data to perform
data registration prior to modelling, especially when dealing with bigger scale visualizations
like buildings or life size monuments, as there will be more than one scan of data and they
need to be registered together. Some registration methods are being considered during the
data collection itself. This target-based registration method uses a 2D target with unique
shape like a sphere or 'butterfly-figure' which it is placed around or actually on the object or
environment of interest and this unique shape will be used as reference point in registering
the data together before processing. This method is preferred by professionals who use a
21
register the data together through this method. For example, FARO and Z+F laser scanners
have their own software called SCENE (FARO Technologies Inc., 2012) and LaserControl
(Zoller + Froehlich GmbH, 2012). to assist user in registering the point cloud data collected
by the respective hardware. As this type of data registration is conducted during the data
collection, it will be discussed further in Chapter 4 on data collection processes. Due to the
specialized target, this method can only be performed when one has access to the software
package.
Apart from the above target-based registration, point cloud data is usually being registered by
matching the input onto model data. This is usually being done when we have access to the
original model data and would like to match similar input data with noise into it. People who
have done this would usually like to test their registration method, by downloading the
original model data from the database (like the Happy Buddha or Bunny by Stanford
University). Then, noise will be introduced into the data (usually by inserting some Gaussian
noise) to get noisy data. This noisy data will be used as the input to be matched with the
original perfect model data to benchmark the developed registration method.
One of the well-known methods that use this principle is Iterative Closest Point (ICP). ICP
was developed by Besl and McKay in 1992 to register two sets of data points together by
minimizing the difference between the points. This is achieved by determining any
transformation of the input data (due to translation or rotation process compared to the model
data) and iteratively trying different transformations until the difference between the two set
of data has been minimized. Figure 2.3 shows how ICP is being used to register data into the
model. Among those who use ICP to register data together are Pu and Vosselman (2009) and
22
many are now modify the original ICP, or combining it with other algorithms or doing both
to produce several new methods. For example, Fitzgibbon (2001) combines ICP with
Levenberg-Marquardt algorithm (LM) which claims to be more robust and generate faster
results compared to the traditional ICP.
(a) (b)
Figure 2.3: ICP is used to register new data (in maroon) into model data (in blue): (a) original
position of data before registration; (b) the registered data after 66 iterations (Source: Kroon,
D.J., 2009)
Another method of data registration is feature-based. Here, similar features of two sets of data
points are being used to register them together, and usually this method requires less
overlapping points than ICP-based methods. Features that have been used are different in
each case, for example, Whitaker, et al. (1999) and Pathak, et al. (2009) use the plane created
from multiple data sets to register them together. As interior data points have planes
representing surfaces like floors, these planes are used as the feature to match multiple data
23
Rabbani, et al. (2007) developed a method to register point cloud data using features that
normally exist within industrial sites. Features of geometric models like cylinders and spheres
that are present in both data sets are being recognized and used to register the data together.
By using these features, few overlapping points are needed to register the data compared to
the ICP method which requires at least 25-30% of overlapping points (Rabbani, et al., 2007).
As some researchers used sensor fusion systems to collect data representing the object or
environment of interest, this data can be utilized to register point cloud data together. Sensor
fusion is a system which integrates two or more similar or different types of sensor and this
data needs to be fused or rather processed together to produce the end result. There are a
number of examples that use sensor fusion, and different types of input obtained from other
sensors can be used to assist registration of point cloud data. For example, El-Hakim, et al.
(1997) use a system which consists of a camera and a range sensor to collect interior data,
and the images obtained from the camera are used to register the point cloud data together.
While more recent research by the same author (El-Hakim, 2001) made use of information
obtained from a dead-reckoning sensor which captures the location of the autonomous
vehicle carrying a LIDAR, registers cloud data from the LIDAR data of historical sites.
2.3 Modelling the data
3D data modelling can be distributed into different sections, which depends on the type of
application. For example, some works have been done to reconstruct surfaces of single
objects like chairs, a lamp, facades, historical monuments and statues. These t ypes of
reconstruction need to consider the recreation of the surface texture as well, for example as
24
deals with building scene modelling and uses a low level of detail laser scanner, texture
reconstruction is therefore out of the scope of the research and would not be discussed here.
At the beginning, researchers are more interested in reconstructing the outer surfaces, without
considering any surfaces that are occluded by any objects in front of them. Results from
modelling an interior will be just like a 3D rendered picture – no effort is conducted to
perform reconstruction of planar surfaces with the entities separated. This is not suitable to be
applied further for the applications (will be discussed further in Chapter 6), as most of them
require separate handling of the surfaces' reconstruction to ease the overall functionality.
Therefore, this section will discuss the surface reconstruction and methods in handling
missing data due to clutter and occlusions separately as the later part is significant in
producing idealized results, as the resulting model can be of benefited to professionals to aid
their work.
2.3.1 Surface reconstruction
There are quite a number of methods available to reconstruct surfaces from 3D point cloud
data, where most of them are statistical-based and surfaces are recognized and recreated using
statistical models. Whitaker, et al. (1999) use weighted least square, while Hough transform
combined with moving least square method has been used by Wang and Oliveira (2002,
2003). Both least square methods are based on the original least square, where a set of points
are fitted approximately into either line, curve or surface. Figure 2.4 shows how least square
is being used to fit surfaces onto a set of 3D points. While weighted least square approach
averages the arithmetic means instead of assuming the same contributions from all points,
25
and is preferred for reconstructing 3D points. Meanwhile, Hough transform is often used for
line (2D) and surface (3D) detection, where the detection work by determining the points'
angle from the origin, and points who share the same angle will be verified as located on the
[image:45.595.93.505.208.452.2]same line or surface.
Figure 2.4: Fitting a surface onto a set of 3D points using least square (Source: OptimEFE,
n.d.)
Meanwhile, planar surfaces were represented by their volumetric information through
voxelization by Adan and Huber (2010). Voxelization is a method to produce continuity of
points by representing them in voxel, or volumetric pixel. From here, voxel can be segmented
into respective surfaces by applying further classifications. Figure 2.5 shows an example of
voxelization of smooth surfaces. Elevation information like heights and histograms were also
being utilized to extract vertical and horizontal data before they can be categorized into
26
respective surfaces (Budroni & Boehm, 2009). A similar method is used by Okorn, et al.
(2010) to develop floor plan modelling.
Figure 2.5: Voxel representation of a smooth teapot as on the right (Source: Mattausch, O.,
2011)
In the meantime, Eich, et al. (2010) use region growing algorithm to extract geometric data of
a plane, where neighbouring points from a pre-defined seed points are being determined as to
whether they belong to the same region by defining the similar criteria shared by them, and
then this iterates until all points have been considered. Similar adaptation on region
concentration are used by Sappa (2002) where a region connectivity graph is used while
Stulp, et al. (2001) exploit depth discontinuity detection with fold edge details and cosine
shaded image to reconstruct surfaces. Both rendering techniques (depth map and cosine
shaded image) are being utilized to segment the points into respective surfaces.
Meanwhile, a probabilistic-based approach has been used by researchers in mobile robotics
towards solving the Simultaneous Localization And Mapping (SLAM). Haehnel, et al. (2003)
27
uses Expectation-Maximization (EM) method to produce a map from the laser scanner
mounted on their robot. EM uses probabilistic models to segment data by iteratively fitting
surfaces or planes towards the points. Other related methods like RANSAC and PCA are also
being used by others to reconstruct the surfaces. RANSAC or RANdom SAmple Consensus
is an algorithm that assumes outliers are parts of the data and will fit the data iteratively
within the 'inliers' or required data. Meanwhile, Principal Component Analysis or PCA is a
mathematical model that uses statistics to find patterns in the data. Elements like eigenvectors
and covariance matrices were exploited to find the pattern of the points and fit them. Johnson
and Hebert (1999) develop a method called spin images, and they use this with PCA to
reconstruct surfaces of the object such as a rubber duck. Spin images is a method that can be
used to reconstruct surfaces and recognize objects from point cloud data. Suppose there is a
mesh model representing an object, and by applying a function to all vertices of the mesh, a
set of points will be created. These points will be used to generate a set of images (i.e. spin
images) and this set of spin images can be used to recognized the same object that has been
occluded. Figure 2.6 summarizes the whole process of spin images. Cantzler, et al. (2002)
use RANSAC for feature detection, and genetic algorithm to optimize the modelling.
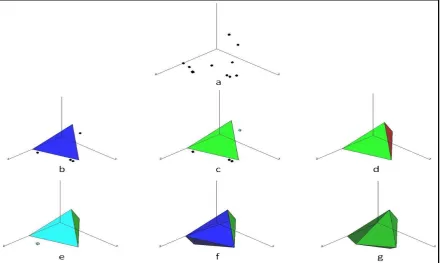
Xiong and Huber (2010) combine geometry and statistical-based modelling methods of
convex hull and conditional random field to classify planar patches. Convex hull reconstructs
surfaces from a seed triangle developed from a set of points, and any points that are located at
each side of the triangle will be searched and used to reconstruct new triangles. The triangles
are then assimilated into the evolving polyhedron. The whole process will be repeated until
28 (a)
[image:48.595.98.499.214.640.2](b)
Figure 2.6: (a) Summary of how spin images are generated from various vertices; (b) the
29
Figure 2.7: A summary of convex hull in 3D points: (a) the raw data; (b) the seed triangle
which forms the basis of surface reconstruction; (c) a point in the right side of the seed
triangle is recognized; (d) the point in (c) is used as the edge of a new triangle; (e) moving on
to the next side where another point is recognized and be used to develop new triangle as
shown in (f); (g) the final reconstruction representing all the points (Source: Lambert, 1998)
Apart from the above method, some professionals who are involved directly with
reconstruction from 3D point cloud data are using commercially available software to process
them. Arayici (2007) who is involved directly with built environment modelling, uses
RiSCAN PRO software for point registration, 3D model editing and CAD extraction, and
AutoCAD and Revit by Autodesk were used by architects like Meadati (2009) for data
modelling. Meanwhile, Leica-based software such as Cyclone, Cloudworx and Geosystems
30
2.3.2 Handling missing data
It is now known that the process of gathering 3D point cloud data using a laser scanner would
involve dealing with occlusion and clutter problems. Therefore, various researchers have
come up with solutions to handle these and provide information on how to work out data that
is missing or occluded due to the clutter.
Researchers in the late 1990s and early 2000s could only reconstruct outer surfaces from laser
scanner data without solving the problem on how to reconstruct the occluded surfaces behind
any clutter. The modelling results would be surfaces of any items or objects which exist in
the scene combined together with the background producing smooth surfaces between them
(refer to Figure 2.8 for samples). This kind of result did not bring any advantages to those
relying on accuracy and measurement modelling in order to obtain any information from
them, for instance architects and engineers who need to know the exact condition of an
interior from the model.
Castellani, et al. (2002) used geometry estimation to reconstruct occluded lines, as shown in
Figure 2.9. If the lines entering and leaving the clutter are straight with no angle between
them, then it is assumed that it is a single straight line and a line is created to connect them.
The same assumption is used in determining curves and joints – if two lines project out from
the clutter at a certain angle, it is assumed that they intersect at a feature e.g. corner, therefore
another curve will be used to join them. Meanwhile Sappa (2002) comes out with the method
of handling missing data by using a geometry-based method of occluded surface recovery
with crease edges. In here, all possible occluded regions will be determined by calculating