RESEARCH ARTICLE
Wing inertia as a cause of aerodynamically uneconomical flight
with high angles of attack in hovering insects
Hoang Vu Phan* and Hoon Cheol Park*
ABSTRACT
Flying insects can maintain maneuverability in the air by flapping their wings, and, to save energy, the wings should operate following optimal kinematics. However, unlike conventional rotary wings, insects operate their wings at aerodynamically uneconomical and high angles of attack (AoA). Although insects have continuously received attention from biologists and aerodynamicists, the high AoA operation in insect flight has not been clearly explained. Here, we used a theoretical blade-element model to examine the impact of wing inertia on the power requirement and flapping AoA, based on 3D free-hovering flight wing kinematics of a horned beetle,Allomyrina dichotoma. The relative simplicity of the model allowed us to search for the best AoA distributed along the wingspan, which generate the highest vertical force per unit power. We show that, although elastic elements may be involved in flight muscles to store and save energy, the insect still has to use substantial power to accelerate its wings, because inertial energy stores should be used to overcome aerodynamic drag before being stored elastically. At the same flapping speed, a wing operating at a higher AoA requires lower inertial torque, and therefore lower inertial power output, at stroke reversals than a wing operating at an aerodynamically optimal low AoA. An interactive aerodynamic-inertial effect thereby enables the wing to flap at sufficiently high AoA, which causes an aerodynamically uneconomical flight in an effort to minimize the net flight energy.
KEY WORDS: Power, Power loading, Flapping wing, Hovering flight, Rhinoceros beetle, Biomimetics
INTRODUCTION
Most man-made fliers generate lift by taking advantage of conventional rotary or fixed wings with a low angle of attack (AoA, i.e. the geometric AoA throughout this study) for optimal aerodynamic efficiency. However, insects exhibit highly maneuverable flight performance in nature, relying on flapping their wings with relatively high AoA (Ellington, 1984a; Willmott and Ellington, 1997a; Mao and Gang, 2003; Usherwood, 2009; Walker et al., 2010; Liu and Sun, 2008). For example, a kinematics study by Ellington (1984b) indicates that hovering insects flap their wings at AoA of around 35 deg at a 70% wingspan. Free-flying hoverflies operate their wings at AoA ranging from 35 to 45 deg during their mid-stroke (Ellington, 1984a; Walker et al., 2010). A similar range was also found in drone flies (Liu and Sun, 2008), fruit
flies (Fry et al., 2005) and horned beetles (Le et al., 2013). If energy minimization is important, natural selection would favor mechanisms that reduce total flight costs while producing sufficient lift to stay airborne. However, optimization studies on flapping wings have found that the aerodynamically optimal AoA for efficient flight are much below the range observed in insects (Usherwood, 2009; Usherwood and Ellington, 2002; Taha et al., 2013; Pesavento and Wang, 2009). As indicated in studies by Ellington (1985) and Dickinson and Lighton (1995), insects may use elastic storage in their flight muscles to minimize flight energy. For an assumption of perfect elastic storage with a chordwise center of wing mass (CGwc) located along the torsion axis (also defined as
a feather axis), the total mechanical power used in insect flight is only an aerodynamic power, because the inertial cost to accelerate the wing is completely eliminated with the stored energy during wing deceleration in the previous stroke (Zhao and Deng, 2009). From these suggestions, many previous studies therefore considered only the aerodynamic energy in their analyses (Le et al., 2013; Usherwood and Ellington, 2002; Taha et al., 2013; Pesavento and Wang, 2009).
However, Usherwood (2009) argued that inertial power may contribute significantly to the power budget, affecting the aerodynamic optimality of the hovering wing kinematics. Although only the aerodynamic term was used in the optimization model, the study proposed that the aerodynamically low AoA generates a small value of lift force that may not be sufficiency to keep the insects aloft. Thus, to produce enough force to lift the body, insects should flap their wings at higher flapping frequencies, which results in a higher inertial power requirement (Usherwood, 2009). Furthermore, the wing inertia was proposed as the cause of the wing rotation at stroke reversal (Ennos, 1988; Combes and Daniel, 2002). This suggestion was supported by the fact that the CGwcis located
behind the torsion axis of the wing (Ennos, 1988; Norberg, 1972). Thus, flapping wings are affected not only by the aerodynamic component but also by the inertial component when the wing accelerates and decelerates for stroke reversals. During flapping motion, insects spend extra flight energy to overcome wing inertia. Consequently, wing inertia may reduce the hovering efficiency of the flapping wing, which is based on power loading as a performance metric (Young et al., 2009; Mayo and Leishman, 2010; Zheng et al., 2013).
Even though wing inertia has been extensively studied, its effect on wing kinematics, particularly the flapping AoA distribution along the wingspan during insect flight, has not been clearly explained. In addition, because of the difficulty of obtaining a direct measurement, the contribution of the inertial power to the mechanical power used for flight has not been determined in prior studies. Here, we studied the effect of wing inertia on the power requirements and flapping AoA based on the 3D wing kinematics of a rhinoceros beetle, Allomyrina dichotoma, during free-hovering flight. The mass distribution on the hindwing was experimentally
Received 25 June 2018; Accepted 8 August 2018
Artificial Muscle Research Center and Department of Smart Vehicle Engineering, Konkuk University, Seoul 05029, South Korea.
*Authors for correspondence ([email protected]; [email protected])
H.V.P., 0000-0002-4943-9765; H.C.P., 0000-0002-5070-6189
Journal
of
Experimental
obtained, and the wing kinematics was measured using three synchronized high-speed cameras. Using the theoretical blade-element model as an effective tool, we were able to estimate the force generation, power requirement and contribution of each power component to the total power budget. In addition, we investigated the effect of the torsion axis by artificially adjusting its location with respect to the CGwcbecause the actual location of the torsion axis is
difficult to determine. Based on the parameters of the beetle’s hindwing, we then searched for the best AoA distributed along the wingspan for hovering flight, which provide the highest local power loading (PL, vertical force/power ratio) at each wing section, for each position of the torsion axis. Unlike other optimization studies, which were based solely on the aerodynamics using simplified 2D wing kinematics (Usherwood, 2009; Usherwood and Ellington, 2002; Taha et al., 2013; Pesavento and Wang, 2009), our approach was based on both aerodynamic and inertial terms associated with the measured wing kinematics of a real beetle. Finally, the effect of wing inertia was addressed and is discussed.
MATERIALS AND METHODS Animals
The rhinoceros beetles, Allomyrina dichotoma (Linnaeus 1771), used in this study were purchased from a commercial company in South Korea and were reared in a plastic cage at room temperature (25°C) with jelly as food.
Flight experiment and wing mass measurement
A beetle with a small suspension hook glued onto the back of its head was hung freely on a hanger with an approximately vertical body orientation. The hanger was positioned near the side of the field of view with the beetle’s head oriented toward the center of the field of view (30 cm×30 cm×30 cm). We filmed the flight using three synchronized high-speed cameras (Photron Ultima APX, 1024×1024 pixels, 2000 frames s−1, shutter speed 4000 frames s−1), as shown in Fig. S1A. We waited (several minutes) until the beetle voluntarily prepared for free flight by opening its forewings (elytra). Then, we manually triggered the cameras to capture the flight. Only flights with advance ratios of less than 0.1 were selected for the study as a definition of hovering flight (Ellington, 1984a). The advance ratio (J) is defined as follows:
J ¼ V
Ut; ð1Þ
whereVdenotes the flight speed,Ut¼2CfRis the mean flapping speed at the wing tip,Ψrepresents the sweep amplitude,fis the flapping frequency andRis the wing length.
After the hovering flights had been successfully filmed, the hindwings were removed at the wing base to measure the dimension and mass distribution. We used an analytical balance (AR0640, Ohaus, Adventure™, resolution 0.1 mg) to measure the mass distribution of the hindwing in both the spanwise and chordwise directions. One hindwing (either left or right) was freshly cut into 10 spanwise pieces of similar length, and the mass of each piece was individually weighed, as shown in Fig. S1B. The other wing was cut into five chordwise pieces to obtain the mass distribution along the wing chord. The hindwings of six additional beetles were also removed and weighed to improve the accuracy of the measurement. During the experiment, about 9±2% of the wing mass was lost after cutting it into small pieces. This loss is due to leaking of the liquid inside the veins at the cut surface. To balance this with the wing mass before cutting, we assumed that the loss is proportional to the
distribution of the wing mass along the wing span as well as the wing chord.
To experimentally determine the location of the spanwise center of wing mass (CGws), we assumed that the mass of each divided
piece was uniformly distributed along its span, with the center of mass located at its center. We assumed that a slight difference in location of each section’s center of mass does not significantly affect the results. Thus, the center of the wing mass can be obtained using the following equation:
rcom¼ P
dmkrk P
dmk ; ð2Þ
wherercomdenotes the location of the center of wing mass from the
wing root, dmkis the mass of the spanwise piecek(mass of wing mw=Σdmk) andrkis the distance from the wing root (flapping axis)
to the center of piece k. The location of the CGwc can be also
obtained using Eqn 2. In this case,rcomis the location of the CGwc
from the leading edge (LE), dmkis the mass of the chordwise piece kandrkis the distance from the LE to the center of piecek.
Wing kinematics analysis
To acquire the 3D wing kinematics of the beetle during hovering flight, we placed low-density white markers in eight spanwise sections of the hindwing distributed uniformly from 0.0R(wing root) to about 0.875R. 2D images captured by three high-speed cameras were analyzed and merged to obtain 3D coordinates of the markers using DLTdv3 (Hedrick, 2008), which is based on a modified direct linear transformation method (Hatze, 1988). Then, the 3D coordinates acquired for the markers, which are based on the coordinates from a custom-built calibration frame, were analyzed and converted into an instantaneous sweep angle (ψ) and wing rotational angle (θr) of the
hindwing. These raw angle data were fitted using the least squares method with the first 5-term sine and cosine function, before employing them as input for the theoretical model to estimate force and power. The fitting function is defined as follows:
kðtÞ ¼X 5
n¼0
½ancosð2npftÞ þbnsinð2npftÞ; ð3Þ
whereκ(t) denotes either sweep angle or rotational angle at timet,an
andbnare the fitted coefficients (n=0, 1, 2,…, 5), andfis the flapping frequency. Details of the measurement procedure of the wing kinematics can be found in previous work (Le et al., 2013; Truong et al., 2011; Phan et al., 2015).
Theoretical model of the force and power Blade-element theory
We used the blade-element theory (BET) model developed in our previous work (Truong et al., 2011; Phan et al., 2016), which is based on 3D wing kinematics as the input condition, to estimate the force generation and power requirement. The force acting on each spanwise section (drin Fig. S2A) of the hindwing was a summation of the translational force (dFT), added mass force (dFA), rotational
force (dFR) and inertial force (dFiner). We defined a fixed coordinate
system,Oxyz, with the originOlocated at the wing root, thexy-plane
corresponding to the wing stroke plane, the x-axis in the lateral direction, they-axis pointing longitudinally backward and thez-axis pointing vertically as the flapping axis. In addition, a coordinate systemξηζlocated at the wing section shown in Fig. S2A was used to define the direction of the force generation. Thus, the sweep angle (ψ) is the angle between thex-axis and theξ-axis. The rotational angle (θr) of the wing section, dr, is the angle between theη-axis and
the wing section, as shown in Fig. S2A.
Journal
of
Experimental
The aerodynamic force (dFaero) produced at an instanttin theη
-and ζ-directions in a wing section can be expressed as follows (Truong et al., 2011):
dFaero;hðtÞ ¼dFT;hðtÞ þdFA;hðtÞ þdFR;hðtÞ
¼ 12rcðCLsinfþCDcosfÞðVT2þV 2 iÞdr
þp4rc2ansinusinurdrrVTcrotu_rc2sinurdr;
ð4Þ dFaero;zðtÞ ¼dFT;zðtÞ þdFA;zðtÞ þdFR;zðtÞ
¼12rcðCLcosfCDsinfÞðVT2þV 2 iÞdr
þp 4rc
2ansinucosu
rdrþrVTcrotu_rc2cosurdr;
ð5Þ where ρ, c, ϕ, VT and Vi represent the air density, wing chord
length, induced angle, translational velocity and induced velocity, respectively. CL and CD are the lift and drag coefficients,
respectively, obtained through experiments by Dickinson et al. (1999). The induced velocity Vi is acquired by determining the
vertical translational forces derived from the BET and momentum theory (Truong et al., 2011). The term an is expressed as an¼½rc€þ ðc=2xfÞc_
2
cosursinur þ ðc=2xfÞ€ur, which
represents the acceleration of the wing section at instantaneous time t, and xf denotes the chordwise distance between the LE
and the torsion axis (Fig. S2B). The symbols crot and u_r denote
the rotational force coefficient {crot=π[0.75−(xf/c)]} (Sane and
Dickinson, 2002) and rotational velocity, respectively.
The inertial force of the spanwise wing section is estimated by dividing the section into several chordwise sections. During flapping motion, the mass of an infinitesimal chordwise section (dmwin Fig. S2B) is accelerated, and the inertial force is generated
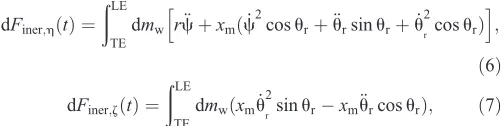
in the section. Thus, the inertial forces at a spanwise section from the trailing edge (TE) to the LE in theη- andζ-directions are determined using the following equations:
dFiner;hðtÞ ¼
ðLE
TE
dmw h
rc€þxmðc_ 2
cosurþ€ursinurþu_ 2 r cosurÞ
i ; ð6Þ
dFiner;zðtÞ ¼
ðLE
TE
dmwðxmu_ 2
r sinurxm€urcosurÞ; ð7Þ
wherexmdenotes the chordwise distance between the dmwand the
torsion axis (ξ-axis) of the wing section (Fig. S2B). Finally, the resulting forces at the wing section produced in the η- and ζ -directions are determined using the following equations:
dFhðtÞ ¼dFaero;hðtÞ þdFiner;hðtÞ; ð8Þ
dFzðtÞ ¼dFaero;zðtÞ þdFiner;zðtÞ: ð9Þ
Power at an instant timetrequired to flap (around the flapping
z-axis) and rotate (around the torsionξ-axis) the wing section dris computed as follows:
dPðtÞ ¼c_
r
! dF!hðtÞ
þu_r X
x
!jd!FjðtÞ; ð10Þ
where! r dF!h indicates the moment around the flappingz-axis produced by the resulting force in theη-direction (dFη),!xjd!Fj
represents the moment around the torsionξ-axis due to the force
component dFj,xjdenotes the distance from the center of the force
component dFjto theξ-axis, andjdenotes translational, rotational,
added mass or inertial components. The location of the center of the aerodynamic forces in the chordwise direction is assumed to be a function of local AoA (θ) of the wing section (Dickson et al., 2006, 2008; Whitney and Wood, 2010; Clawson et al., 2017). Its position from the LE of the wing, d(θ)=c[(0.82/π)|θ|+0.05], is determined using experimental data obtained from a study by Dickson et al. (2006). The location of the CGwc can be obtained from the
measurement. Studies by Sun and Tang (2002) indicated that the power required to rotate the wing around the ξ-axis contributed insignificantly to the power budget. Therefore, a difference caused by a slightly incorrect location of the center of force in the chordwise direction may insignificantly affect the total power requirement. From the calculation above, the mechanical power required by the beetle can be obtained for hovering flight.
Validation of force and power estimates
We used our BET model to estimate the force generation and power requirement for the hovering fruit fly Drosophila melanogaster
[image:3.612.49.300.484.547.2]used in the study by Fry et al. (2005). The wing morphology and kinematics were taken from Fry et al. (2005), as shown in Table S1 and Fig. S3. The 0.96 mg insect (9.42×10⁻³N) with a wing length of about 2.39 mm flapped its wings at a flapping frequency of 218 Hz. The Reynolds numberRewas about 153. The wing mass is assumed to be uniformly distributed along the wingspan. The results estimated by the BET model were compared with the experimental results obtained by Fry et al. (2005) and the computational fluid dynamic (CFD) results obtained by Aono et al. (2008), as plotted in Fig. S4. Although there are discrepancies, the time courses of the forces and power estimated by our model show a good match with those from the experiment and CFD. The cycle-average values in Table S2 show a reasonable number for the hovering flight and also agree well with previous data. Thus, we think that our theoretical model is good enough to estimate the power requirement as well as the force generation of flapping flight.
Approach to find the best flapping AoA
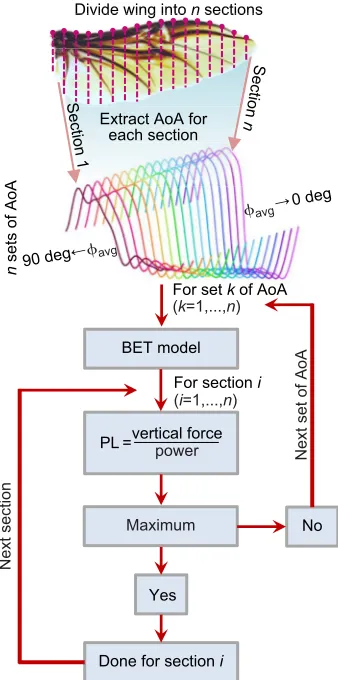
The PL, which represents the amount of vertical force per unit power, was used as a basic metric to assess the economical hovering flight in this study (Young et al., 2009; Mayo and Leishman, 2010; Zheng et al., 2013). Based on the 3D wing kinematics of the beetle, we sought the best local AoA at each wing section along the wingspan for the highest PL by using a simple approach developed in our previous work (Phan et al., 2017a), as depicted in Fig. 1. The approach was performed using the same wing geometry and sweep angle of the beetle at the same flapping frequency of 40.5 Hz. The beetle’s hindwing performs approximately linear twist from the wing root to the wing tip during flapping motion (Le et al., 2013). By dividing the wing intonspanwise sections, we could haventime histories of AoA; the average AoA (θavg) during the translational
stage varies from approximately 0 to 90 deg. Then, at each spanwise section, we used the BET model to estimate the vertical forces and power for thentime histories of AoA. Thus, the time history of AoA that generates the highest PL at each section can be identified to achieve a complete set of the best AoA along the wingspan.
This method may have some limitations as it maximizes the local cycle-average PL at each section [max(dFζ.i/dPi), wherei=1,…,n
wing section], instead of maximizing PL of the whole wing max Pn1dFz;i=Pn1dPi
. However, we assumed that if at each wing section i, dFζ.i/dPi is maximum, then
Pn 1dFz;i=
Pn 1dPi
also reaches its maximum. Thus, we expect that the AoA
Journal
of
Experimental
for max(dFζ.i/dPi) along the wingspan match those for
max Pn1dFz;i=Pn1dPi
. The results of our previous study (Phan et al., 2017a) also proved that the optimal twisted wing with max(dFζ.i/dPi) obtained using the same approach provided
a higher total PL of the wing, compared with the optimal flat-plate wing. In addition, the method based on BET, which requires cheap and less time-consuming computations, allows us to obtain the results without a high cost. Most of the available optimization approaches for the flapping wings are performed experimentally (Chaudhuri et al., 2014; Nan et al., 2017) or based on simplified 2D wing kinematics (Usherwood, 2009; Taha et al., 2013; Pesavento and Wang, 2009; Berman and Wang, 2007). While we lack a fully formulated global optimization approach to find the optimal 3D wing kinematics, this simple optimization-like method may be an appropriate way to obtain the optimal AoA for a 3D wing using a real insect’s wing kinematics.
RESULTS
Mass distribution and kinematics of the beetle’s hindwing After removing the hindwings from the beetles’ body, we immediately measured the weight and size of the hindwings before dividing them equally into spanwise and chordwise pieces. The measurement showed that each hindwing contributed about 0.9±0.05% of the body weight. The distribution of the mass in the spanwise and chordwise directions is plotted in Fig. 2A. In the spanwise direction, the mass concentrates mainly near the wing root
and up to about 60% of the wingspan, where the marginal joint is located. The distribution of the wing mass in the spanwise direction was fitted by a polynomial function (Fig. 2A) to use as input of the theoretical BET model for force and power estimates. Using Eqn 2, we found that the location of the CGwsis located at approximately
25.6±1.1% of the wingspan from the wing root. In the chordwise direction, the mass is heavily concentrated near the LE and the center of mass is located at about 21.9±0.6% wing chord.
We selected an active 5.06 g female beetle to measure the wing kinematics during the hovering flight. Its hindwing with a length of about 49.3 mm weighs approximately 45 mg. The wing area is about 750 mm2, and the aspect ratio is about 3.2. Fig. 2B shows a
snapshot of the successful hovering flight of the beetle. It flew slightly backward with a speed of about 0.1 m s−1. The stroke plane is inclined to the dorsal side of the beetle with an angle of approximately 7 deg with respect to the horizontal plane. The beetle beats its wings with a frequency of approximately 40.5±0.3 Hz. Thus, the advance ratio is approximately 0.007 (tip flapping speed≈12.7 m s−1), which absolutely satisfies the hovering condition (Ellington, 1984a). The Reynolds number is approximately 12,200 at the wing tip. The time histories of the sweep angle (ψ) and wing rotational angle (θr) in
one flapping cycle from the downstroke (t/T=0.0–0.5, whereTis the flapping cycle) and upstroke (t/T=0.5–1.0) were averaged from three wing beats, as shown in Fig. 2C,D. The peak-to-peak sweep amplitude was approximately 183 deg. The average AoA, θavg,
during the translational stages of the downstroke (t/T=0.2–0.4) showed that the hindwing is negatively twisted with θavg=75.0
±1.5 deg at the wing root andθavg=15.2±3.6 deg at about 0.875R.
During the translational stages of the upstroke (t/T=0.7–0.9), the
θavgis mostly higher (θavg=81.7±1.3 deg at the wing root) except
near the wing tip (θavg=14.0±1.1 deg at 0.875R), compared with
those of the downstroke.
It is challenging to determine the precise location of the torsion axis along the wingspan. Previous studies indicated that the torsion axis lies anterior to the CGwc (Ennos, 1988; Norberg,
1972). In particular, Ennos (1988) proposed that the torsion axis of the hoverfly’s wing is located in the middle of the LE and the CGwc. This location was also used in a study by Bergou et al.
(2007). In this work, as the CGwc of the beetle’s hindwing is
located at about 22% wing chord from the LE, we first assumed that the torsion axis is located at about 10% of the wing chord behind the LE (xf=0.1c), which is approximately in the middle of
the LE and CGwc. The effect of torsion axis location is examined
further below.
Force and power requirements
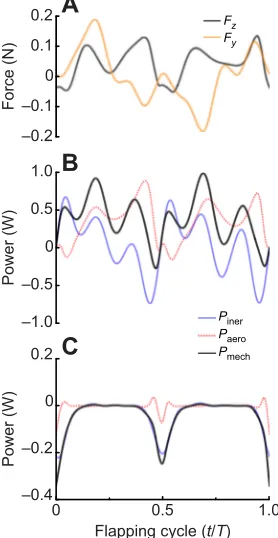
The forces generated by the beetle in theζ- andη-directions were estimated and transformed to the horizontal and vertical forces in they- andz-directions, respectively. Fig. 3A plots the vertical force in thez-direction (Fz) required to lift the body and horizontal force in
they-direction (Fy) produced for the forward or backward flight.
The cycle-averaged Fz was approximately 45.7 mN (≈4.65 gf ),
which is equivalent to about 92% of the beetle’s body mass (5.06 g). This result is reasonable because the presence of elytra, which substantially contributes to the lift generation of the beetle to support its weight (Le et al., 2013; Johansson et al., 2012; Burton and Sandeman, 1961), was not considered in this work. The cycle-average horizontal force was approximately 4 mN (≈0.41 gf ), which results in a slightly backward flight of the beetle. Thus, the estimated forces are acceptable to strengthen the accuracy of force estimation by the BET model that was validated in previous papers (Truong et al., 2011; Phan et al., 2016).
Divide wing into n sections
Extract AoA for each section
avg
0 deg
n
sets of AoA
BET model
PL = vertical forcepower For section i For set k of AoA
Maximum
Yes
No
Next set of AoA
Done for section i
Next section
90 deg avg
Divide wing intonsections
Section
n
Section 1
(k=1,...,n)
[image:4.612.90.259.58.398.2](i=1,...,n)
Fig. 1. Procedure to find the best wing configuration for the highest power loading (PL).Note that the average angles of attack (AoA) during the wing translation (θavg) are different for different wing sections.
Journal
of
Experimental
The power components required to flap and rotate the hindwings are shown in Fig. 3B,C. The total power required to flap the wing around the z-axis presents both positive and negative parts. However, the total rotational power required to rotate the wing
around theξ-axis is negative in the time course, indicating that the wing is passively rotated at stroke reversal (Bergou et al., 2007). The active or passive rotation about the torsion axis can be also classified by observing the direction of the torsion wave along the trailing edge of the wing (Ennos, 1988; Bergou et al., 2007). If the wave propagates from the wing tip to the root, it is termed passive rotation assisted by the aerodynamic force. Otherwise, the wing rotation is activated by the flight muscles if the torsion wave propagation is from the root to the tip. We observed that the torsion wave propagates from the wing tip to the root, providing evidence of passive wing rotation in the beetle’s hindwing (Fig. S5).
The time courses in Fig. 3B,C can be used to obtain the cycle-average powers. Three possibilities were proposed to estimate the cycle-average mechanical power requirements in the previous studies (Ellington, 1984b; Weis-Fogh, 1972, 1973). In the first assumption, the flight muscles work as an end stop at the end of each half-stroke (no elastic storage). Thus, the negative powers in the time course are ignored, and only positive powers are considered. The second assumption is that the elastic element presented in the flight muscle can store excess energy during a period of negative power and release it in the period of positive power in the following stroke ( perfect storage). In the third possibility, the flight muscles are assumed to be stretched to do negative work. Among those, the first two assumptions have been widely used in many previous studies (Mao and Gang, 2003; Fry et al., 2005; Berman and Wang, 2007; Ellington, 1984b; Weis-Fogh, 1972, 1973; Sun and Tang, 2002; Liu, 2009), while the third is rarely used. The reason is that the negative work may consume much less metabolic energy than a similar amount of positive work (Ellington, 1984b). Then, the flight muscles act again as an end stop, dissipating the required energy as in the first assumption. However, Fig. 3B shows that some negative muscle work may be required, making the difference in efficiency for positive and negative work relevant. Thus, it may be possible for the muscles to require stretching to decelerate the wing, expending energy. Thereby, the third assumption can occur during insect flight.
0 0.2 0.4 0.6 0.8 1.0 0
1 2 3 4 5 6
7 Span (measured)
Mass per unit wingspan (g mm
–1
)
Normalized wingspan or chord 0 0.2 0.4 0.6 0.8 1.0
Mass distribution along chord (
mk
/
mw
)
Chord (measured)
A
C
–100 –50 0 50 100
Upstroke
Raw angle,
ψ
(deg)
Fitted angle,
ψ
(deg)
0 0.5 1.0
0 45 90 135 180
r=0.000R
r=0.500R r=0.625R r=0.750R r=0.875R
r=0.125R
r=0.250R r=0.375R
Flapping cycle (t/T)
0 0.5 1.0
Flapping cycle (t/T)
Raw angle,
r
(deg)
Fitted angle,
r
(deg)
B
10 mm Tracked
marker
Flight path in 3 flapping cycles
D
–100 –50 0 50 100
Upstroke
0 45 90 135 180
0 0.5 1.0 0
30 60 90
Downstroke
Wingspan (r/R)
Upstroke
Stroke plane Chord
Downstroke Downstroke Downstroke
r=0.875R
r=0.0R
avg
(deg)
r Fitted (y=−0.0223x6−0.0334x5+0.2374x4
[image:5.612.82.532.56.294.2]−0.3284x3+0.1909x2−0.0502x+0.0059)
Fig. 2. Wing mass distribution and kinematics of the beetle’s hindwing during hovering flight.(A) Distribution of the wing mass in the spanwise and chordwise directions. (B) Snapshot of the beetle in flight and the flight path in three flapping cycles. (C) Instantaneous measured sweep (ѱ) and rotational (θr)
angles averaged from three flapping cycles. (D) Fitted angles using a five-term sine and cosine fitting function.θavg, average AoA.
–0.2 –0.1 0 0.1 0.2
Force (N)
–1.0 –0.5 0 0.5 1.0
Piner
Fz Fy
Paero
Pmech
Power (W)
0 0.5 1.0
–0.4 –0.2 0 0.2
Power (W)
Flapping cycle (t/T)
A
B
C
Fig. 3. Estimated force generation and power requirement of the beetle’s hindwing in a flapping cycle.(A) Forces in the vertical (Fz) and
horizontal (Fy) directions. (B) Power required to flap the hindwings around
the flappingz-axis. (C) Rotational power required to rotate the hindwings around the torsionξ-axis.Piner,PaeroandPmechdenote the inertial, aerodynamic and
total mechanical powers, respectively;t, time;T, flapping cycle.
Journal
of
Experimental
[image:5.612.104.243.404.673.2]By assuming perfect elastic storage in the muscle system, the cycle-average total mechanical power can be obtained by taking both positive and negative parts of the time course of the power. We assume that elastic elements may exist in flight muscles used only to flap the wing, showing that the assumption of perfect storage is applied only to the power required to flap in Fig. 3B. Negative rotational power (Fig. 3C) and passive wing rotation at stroke reversal also showed there might be no muscle activation to rotate the wing. Thus, the negative rotational power may not be stored or added to the power budget. Therefore, the total mechanical power requirement for flight should be the power used to flap the wing about its flapping axis (z-axis). In this case, the cycle-average total mechanical power became approximately 0.390 W. Thus, the muscle mass-specific power (P*), which is defined by the ratio of the cycle-average power and the mass of the flight muscle of the beetle (30% of the body mass; Lehmann and Dickinson, 1997), was approximatelyP*mech=257.1 W kg−1, as shown in Table S3.
For an assumption of no elastic storage, there are two options to obtain the cycle-average value, as illustrated in Fig. S6. If there are interactions among the wing sections, the total cycle-average power of 0.411 W (P*mech=270.7 W kg−1 in Table S3) was
computed from the positive parts of the resulting time course, which was a summation of the time courses (both positive and negative) at each wing section along the wingspan. For no interaction, as in the second option, the total cycle-average value of 0.424 W (P*mech=279.5 W kg−1in Table S3) was obtained from
the positive power for each wing section. Note that the concept of the wing section interaction is explained in Fig. S6. Then, the difference between them is only approximately 3.1%, which is a minor effect. Using the third assumption, the acquired mechanical power was 0.435 W (P*mech286.7 W kg−1in Table S3), which was
obtained by averaging the absolute values of the power in the time course. As the flight muscles spent more energy (negative power in the time course was treated as the power spent to decelerate the wing) to brake the wings in this case, the power was about 11.5% higher than that of the case with perfect storage.
Effect of torsion axis on power requirement
We artificially varied the location of the torsion axis along the chordwise direction from the CGwc(xf=0.22c, wherexfdenotes the
distance between the LE and the torsion axis) to the LE (xf=0.0c).
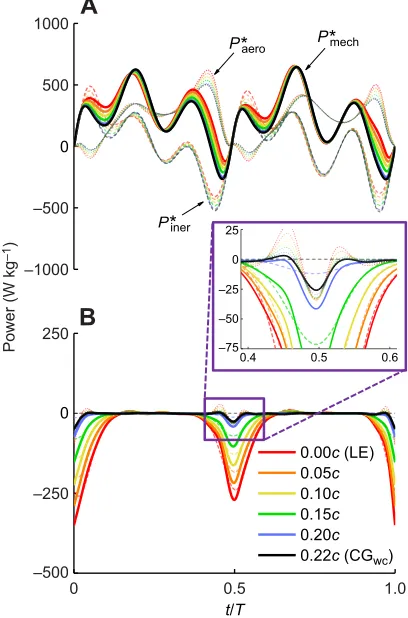
Its effects on the energetic cost are presented in Fig. 4. The decrease inxf[increase in the distance (xM) between the CGwcand the torsion
axis; Fig. S2) resulted in changes to the time course of the inertial and aerodynamic power used to flap and rotate the wing. Obviously, this causes a change in the time course of the mechanical power (Fig. 4A). Asxfdecreases, the amount of positive work increases,
while the amount of negative work decreases. The insect is thereby required to use more power for flight.
For perfect storage, the muscle mass-specific power increases from 220.8 W kg−1(torsion axis locates at CGwc) to 286.5 W kg−1
(about a 29.7% increase, torsion axis located at LE), asxfdecreases.
In contrast, a smaller xf (higher xM) results in higher torque
generation caused by a change in the inertial force near the end of each half-stroke, thereby enabling the wing to passively rotate about the torsion axis. The negative inertial power (Fig. 4B) eliminates the power needed to rotate the wing. Even when the torsion axis is located at the CGwc(xf=0.22c), the total mechanical power is still
negative over one cycle, which is caused by the added mass involved in the aerodynamic term. However, this negative work may not be sufficient to passively rotate the wing for its following stroke because the duration of this negative work at downstroke reversal
happens within a very short time (rotational duration in a flapping cycle,Δτr≈0.07) starting at aboutt/T=0.46. Meanwhile, the wing
kinematics measurement showed that the wing starts to flip in advance at aboutt/T=0.4 (Fig. 2C,D). In this case, the wing may perform a delayed rotation (the wing flips after the end of the stroke), resulting in inefficient flight (Dickinson and Lighton, 1995; Sun and Tang, 2002). Thus, the torsion axis should be located anterior to the CGwc, which is enough to ensure passive wing rotation and
energy savings.
The change in the location of the torsion axis affects the rotational force coefficient and the wing accelerationan, causing changes in
unsteady forces. However, the contribution of unsteady forces to the resulting vertical force is small compared with that of the steady-translational force. Therefore, the resulting vertical force increased by approximately 11.4% by the decrease inxf(or increase ofxM)
from 0.22cto 0.0c.
Contribution of the inertial power to the power budget The inertial power contributes to the flight energies of the beetle and other insects. However, it is difficult to determine how much it added to the total mechanical power, as shown in previous studies (Fry et al., 2005; Ellington, 1984b, 1985; Weis-Fogh, 1972, 1973). For perfect elastic storage, the cycle-average total mechanical power is the sum of the cycle-average inertial and aerodynamic powers. In particular, when the CGwcis located along the torsion axis, the
cycle-average inertial power is zero, and the total mechanical power
A
B
0 0.5 1.0
–500 –250
0
250
0.00c (LE) 0.05c 0.10c 0.15c 0.20c 0.22c (CGwc)
t/T
–1000 –500
0
500 1000
P*iner
P*aero P*mech
0.4 0.5 0.6
–75 –50 –25 0 25
Power (W kg
–1
[image:6.612.337.541.62.371.2])
Fig. 4. Effect of torsion axis location on muscle mass-specific power.
(A) Power required to flap about the flappingz-axis. (B) Power required to rotate about the torsion axis. Dotted lines represent the aerodynamic power, dashed lines denote the inertial power and solid lines represent the total mechanical power.c, wing chord length; LE, leading edge; CGwc, chordwise
center of wing mass.
Journal
of
Experimental
is equal to the aerodynamic power (|Ellington, 1984b, 1985). Thus, the elastic storage eliminates the contribution of the inertial power to the total power budget (Fry et al., 2005; Ellington, 1985; Dickinson and Lighton, 1995). In this case, the power requirement for flight is unaffected by the mass of the wing, which seems to be unreasonable because if wing inertia plays no role, flapping wings should operate at lower angles of attack (Usherwood, 2009). Moreover, in the scenario where the flight muscles do not store energy and act as an end-stop, the summation of the inertial power [114.2 W kg−1from positive parts in its time course shown as a yellow dashed line (xf=0.10c) in Fig. 4A] and aerodynamic power (236.7 W kg−1,
shown as a yellow dotted line in Fig. 4A) was greater than the total mechanical power (270.7 W kg−1, shown as a yellow solid line in Fig. 4A) as estimated by this assumption. Similar results can also be found in previous work using time-averaged models (Ellington, 1984b, 1985; Dickinson and Lighton, 1995) and even using instantaneous wing kinematics (Fry et al., 2005). Thus, there should be a tradeoff between the two power components to reduce the total mechanical power output used for flight. For example, during wing deceleration, the inertial force tends to move the wing forward, reducing the power needed to overcome the aerodynamic drag. Otherwise, the aerodynamic drag from the wing membrane reduces the inertial effect. As a result, the amount of each power component should not be estimated from each individual time course. However, how do we determine the amount contributed by each power component in the total mechanical power after the tradeoff?
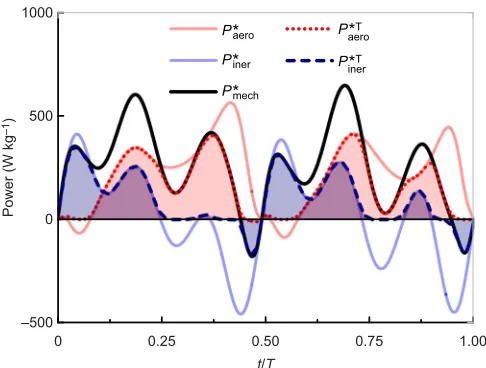
The aerodynamic power is mostly positive in its time course. However, the inertial power is positive during wing acceleration and negative during wing deceleration (Fig. 3B). The tradeoff between the aerodynamic and inertial power forms the mechanical power. Table 1 shows how the aerodynamic ðPT
aeroÞ and inertial ðPinerTÞ
power contribute to the total mechanical power after the tradeoff. At the same instantaneous time, if Paero and Piner have the same sign (same direction of force), the power after the tradeoff should be the same as its value before the tradeoff (PT
aero¼Paero and PT
iner¼Piner, where the superscript T denotes the tradeoff ). When Paero and Piner are of different sign (forces are in the reverse direction), the one with the larger absolute value should be dominant and eliminate the other to form the mechanical power on its own, i.e. the contribution of the other one is set to zero because of the tradeoff. In this way, we can separate and obtain the amount of each power component in the total power budget used for hovering flight of the beetle, as shown in Fig. 5. During the wing acceleration
periods (t/T=0.00–0.25 and t/T=0.50–0.75), the insects were required to expend energy to overcome the inertial force ðPiner.0Þ. The aerodynamic power in these periods showed both negative and positive values. The absolute values of the negative aerodynamic power, however, were smaller than those of the inertial power. Thus, after the tradeoff, the aerodynamic power is set to be zeroðPT
aero¼0Þ and the inertial power is equal to the mechanical
power ðPT
iner¼PinerjPaero j¼PmechÞ. During t/T=0.07–0.25 and t/T=0.57–0.75, because both inertial and aerodynamic power are positive ðPiner.0;Paero.0Þ, the amounts after the tradeoff should be the same as their values before the tradeoff ðPT
aero¼Paero andPinerT¼PinerÞ; the tradeoff had no effect in this
case. The wing then decelerated toward the end of each half-stroke (t/T=0.25–0.50 andt/T=0.75–1.00), as represented by the negative sign of the inertial powerðPiner, 0Þdue to the reversed direction of the inertial force. The inertial force at these periods tended to move the wing forward, while the aerodynamic drag was always slowing down the wing motion ðPaero. 0Þ. If Paero jPinerj.0, the aerodynamic power is dominant. Thus, PT
iner¼0 due to
the tradeoff andPT
aero¼PaerojPiner j¼Pmech . IfPaerojPinerj,0, the
negative inertial power is dominant (the aerodynamic drag could not counteract the wing inertial force moving the wing forward). Hence,PT
iner¼Piner þPaero¼Pmech, 0 andPaeroT ¼0 (t/T=0.44–0.50 and t/T=0.95–1.00 in Fig. 5). Note that duringt/T=0.83–0.90,Piner.0 andPaero.0. Therefore,PT
aero¼Paero andPinerT¼Piner.
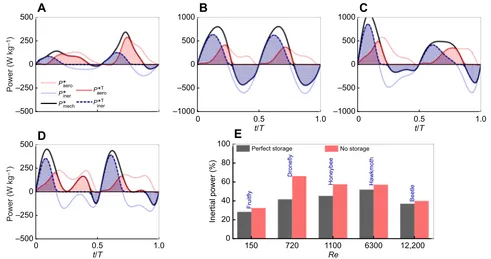
Together with the beetle case, the power distributions in the hovering flight of other insects were also estimated in this study, as shown in Fig. 6. We tested for fruit flyD. melanogaster(Fig. 6A), dronefly, Eristalis tenax (Fig. 6B), honeybee, Apis mellifera
(Fig. 6C), and hawkmoth Agrius convolvuli (Fig. 6D), with various Reynolds numbers ranging from 100 to 6300. The wing kinematics and morphological parameters of these insects taken from previously published works can be found in Fig. S3 and Table S1. Using Table 1, the cycle-average inertial power after the tradeoff can be obtained, and its contribution to the power budget is shown in Fig. 6E and Table S4. We show that the tradeoff uses negative work (during wing deceleration) to overcome the aerodynamic drag, before storing energy in the elastic elements. This means that the aerodynamic power should be reduced or
0 0.25 0.50 0.75 1.00
–500 0 500 1000
Power (W kg
–1)
t/T
P*aero
P*iner
P*mech
P*T
aero
P*T
iner
Fig. 5. Contribution of each power component to the total mechanical power of the hovering beetle.Paero ,Piner andPmechdenote the muscle mass-specific aerodynamic, inertial and total mechanical power before the tradeoff, respectively.PT
aeroandP T
inerrepresent the muscle mass-specific
aerodynamic and inertial power fit to the power budget after the tradeoff.
Table 1. Method to estimate the contribution of each power component to the total power budget after the tradeoff
Mechanical power,Pmech ¼Paero þPiner
Aerodynamic power,PT
aero Inertial power,PinerT
IfPaero ,0,Piner,0 orPaero .0,Piner.0
PT
aero¼Paero PinerT¼Piner
IfPaero ,0,Piner.0,Pmech .0 orPaero .0,Piner,0,Pmech ,0
PT
aero¼0 PinerT¼Pmech
IfPaero ,0,Piner.0,Pmech ,0 orPaero .0,Piner,0,Pmech .0
PT
aero¼Pmech PinerT¼0
PaeroandPiner are the muscle mass-specific aerodynamic and inertial power
before the tradeoff, respectively,Pmech denotes the total muscle mass-specific
mechanical power, andPT aeroandP
T
inerrepresent the muscle mass-specific
aerodynamic and inertial power fit to the power budget after the tradeoff,
respectively.
Journal
of
Experimental
[image:7.612.317.560.56.240.2]eliminated during the period of energy storage. Thus, the aerodynamic power needed to flap the wing in a whole flapping cycle should be reduced by the same amount as that taken from the stored energy for the negative work. The amount remaining in storage therefore is not enough to eliminate all inertial power accelerating the wing. Therefore, the insects may spend a substantial amount of energy to overcome wing inertia, even though perfect elastic storage was assumed to be present in the flight muscles.
Best AoA for economical flight
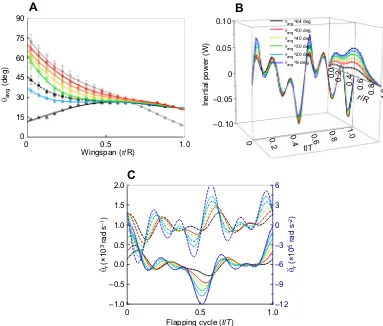
During flapping motion, the beetle’s hindwing performed a negative twist with various AoA along the wingspan, as shown in Fig. 2C,D, and in Fig. 7A in gray. We divided the hindwing into 20 spanwise sections and obtained 20 different time courses of the AoA. We first calculated the power based on the perfect elastic storage assumption. Fig. 7A shows the average AoA (θavg, average
AoA during wing translation) of the best wings for the highest PL corresponding to each chordwise location of the torsion axis from the CGwc (xf=0.22c) to the LE (xf=0.0c), along with that of the
highest translational PL based only on translational force and power. For the translational component only, the best wing (black dashed line in Fig. 7A) is negatively twisted along the wingspan in a manner analogous to that of conventional helicopter blades (Leishman, 2006). The best wings for the highest total PLs also perform a twist, but with slightly different shapes. With respect to the CGwc, the
closer location of the torsion axis results in a lower AoA operation. The difference is clearly seen in the wing inboard, where the contribution of the mass was dominant (Fig. 2A). Near the wing tip, the average AoA are almost the same for differentxMbecause of the
minor mass distribution in this area. When the torsion axis
approaches the LE, the best AoA come closer to those in the beetle’s hindwing (best seen near the wing root). For the case of the torsion axis located at the CGwc(xf=0.22c), the best wing performed
a positive twist from the wing root to the mid-span and a slightly negative twist from the mid-span to the wing tip. As the best AoA were obtained using cycle-average values, this wing configuration also represents the case of the highest aerodynamic PL only (the negative power eliminates all the positive power needed for wing acceleration). The positive twist near the wing inboard can be explained as a result of the dominant contribution of the added mass term (Fig. S7), which is best at a low AoA.
In hovering flight, the wing inertia does not contribute significantly to the resulting vertical force, but it requires more energy to accelerate the wing. Thus, the only inertial power (not inertial force) is expected to affect the change in the best AoA. Fig. 7B plots the cycle-average inertial power (solid lines with markers in the right side) distributed along the wingspan for different AoA (represented byθavg) for the case of a perfect elastic
storage assumption. The results show that wing flapping at a higher AoA uses less inertial power. To investigate how the flapping AoA affects the inertial power requirement, we analyzed the time courses of the inertial power at the mid-span wing section for various AoA, as shown by the solid lines in Fig. 7B. The differences among the inertial power values are best seen at the stroke reversals. The wing section operating at a lower AoA expends a higher inertial power to accelerate the wing section (t/T=0.0–0.1 and 0.5–0.6) while storing less energy (less negative power) when the wing section decelerates (t/T=0.4–0.5 and 0.9–1.0).
For the same wing mass, the inertial power (calculated from the inertial force in theη-direction) at a spanwise wing section located at
ris affected by the wing acceleration in theη-direction, which is
150 6300 12,200
0 20 40 60 80 100
Fruitfly
Dronefly
Honeybee Hawkmoth
Beetle
No storage
1100
Inertial power (%)
Re Perfect storage
720
A
D
0 0.5 1.0
–1000 –500 0 500 1000
t/T
0 0.5 1.0
t/T
0 0.5 1.0
t/T
–500 –250 0 250 500 –500 –250 0 250 500
–1000 –500 0 500 1000
B
C
E
P*aeroP*mech
P*iner
P*T aero
P*T iner
Power (W kg
–1
)
Power (W kg
–1
[image:8.612.61.552.57.316.2])
Fig. 6. Muscle mass-specific power and contribution of the inertial power to the total mechanical power requirements used in hovering insects.
(A) Power requirement of the fruit flyDrosophila melanogaster. The wing morphology and kinematics were taken from Fry et al. (2005). (B) Power requirement of the dronefly,Eristalis tenax. Wing morphology and kinematics were taken from Liu and Sun (2008). (C) Power requirement of the honeybee,Apis mellifera. Data for hovering flight of the honeybee were taken from Altshuler et al. (2005) and Liu and Aono (2009). (D) Power requirement of the hawkmothAgrius convolvuli. Data for hovering flight of the hawkmoth were taken from Willmott and Ellington (1997b) and Liu et al. (1998). (E) Contribution of inertial power after the tradeoff.Re, Reynolds number.
Journal
of
Experimental
expressed as the following equation (Phan et al., 2017a):
€
h¼rc€þxmðc_ 2
cosurþ€ursinurþu_ 2
r cosurÞ: ð11Þ
For the same distance xm,h€ varies by the change in the wing
rotation angle (θr) and its derivativesðu_r;€urÞ. Fig. 7C shows the
rotational velocity and acceleration of the wing section at the mid-span for different AoA or wing rotational angles. It is clear that the wing operating at a lower AoA or higher rotational angle requires a higher angular velocity and acceleration at stroke reversal, resulting in a higher inertial force generation in theη-direction and inertial power.
The best AoA were also obtained for the no elastic storage assumption, as shown in Fig. 8A. In this case, the contribution of the wing inertia is dominant even for the torsion axis located at the CGwc. Therefore, unlike those in the perfect storage assumption,
the best AoA for the total PL (with the inertial effect) are different from those of the aerodynamic PL for all locations of the torsion axis. Fig. 8A shows that the best AoA for the total PL are higher than those for aerodynamics only. However, the change in the location of the torsion axis does not affect the best AoA much because of the small change in the power requirement. Fig. 8B shows the best AoA when the muscles do negative work. Even though these AoA are similar to those for the case with no storage, they are slightly
different for different locations of the torsion axis. Thus, for all cases of elastic storage (Figs 7A and 8), the best wings for the highest total PL demonstrate higher AoA than those for the highest aerodynamic PL, signifying the impact of wing inertia in insect flight.
DISCUSSION
Insects may use elastic components in their flight muscles to minimize flight energy (Ellington, 1985; Dickinson and Lighton, 1995; Alexander and Bennet-Clark, 1977). A study onDrosophila
by Fry et al. (2005) indicated that, with full storage capability, flight energy could be saved by a maximum amount of about 19%. We assumed that the flight muscles of beetles are also capable of storing energy and are unable to do negative work, similar to the previous studies. Thus, a maximum energy saving of 5.1% could be achieved by elastic storage in the beetle. This contribution is much lower than that forDrosophila(Fry et al., 2005). In another exceptional case, the elastic elements may be responsible for preventing the muscles from being stretched to do negative work. Thus, the role of elastic storage is greater to save up to 10.3% energy. Dickinson and Lighton (1995) indicated that an amount of elastic storage of the order of 10% would be enough to eliminate all inertial costs, and insects would require energy to overcome the aerodynamic force only. However, we showed that insects (regardless of their size) still need to spend a substantial amount of energy to accelerate their
A
0 0.5 1.0
0 15 30 45 60 75
90 0.10
0.05
0
t/T
r/R
–0.05
–0.10
1.0
0.8
0.6
0.4
0.2
0.0
0 0.2 0.4
0.6 0.8 1.0
Inertial power (W)
θavg
(deg)
θavg=64 deg
θavg=50 deg
θavg=40 deg
θavg=30 deg
θavg=20 deg
θavg=9 deg
Wingspan (r/R)
B
0 0.5 1.0
–1.0 –0.5 0.0 0.5 1.0 1.5 2.0
Flapping cycle (t/T)
–12 –9 –6 –3 0 3 6
C
θr
(×10
3 rad s
–1
)
. θ(×10r
5rad s
–2
)
[image:9.612.111.494.58.384.2]..
Fig. 7. Estimation of the best AoA.(A) Best AoA distributed along the wingspan for the highest PLs with a perfect storage assumption in the flight muscles. The symbols represent the rough values, and the lines denote the fitted values. Black, blue, green, yellow, orange and red denote the average AoA for the torsion axis located at 0.22c(CGwc,xM=0.0c, wherexMis the distance between the CGwcand the torsion axis), 0.20c, 0.15c, 0.10c, 0.05cand 0.0c(LE,xM=0.22c),
respectively. The black dashed line shows the average AoA for the highest translational PL. Gray represents the measuredθavgof the beetle’s hindwing. The error
bars indicate the deviation of the AoA for the downstroke and upstroke during wing translation. (B) The inertial power for various AoA (represented byθavg). The
cycle-average power (solid lines with markers) distributed along the wingspan was scaled up by 10 (×10) to clearly display the difference. (C) Rotational velocity (solid line) and acceleration (dashed line) of the wing section at mid-span.
Journal
of
Experimental
wings, as shown in Fig. 6E. If the wing inertia incurs no cost, why do insects not operate their wings at the aerodynamically optimal AoA, which was found to be lower than the range of AoA used in most insects (Usherwood, 2009; Usherwood and Ellington, 2002; Taha et al., 2013; Pesavento and Wang, 2009). In addition, the insects benefit from the wing inertia to passively rotate their wings at stroke reversal (Ennos, 1988; Combes and Daniel, 2002), which is possible when the CGwcis located behind the torsion axis from the
LE. Thus, wing inertia may play a substantial role in flapping flight. We recommend that estimates of the energetic cost of flapping flight should consider the inertial effect to approach the actual power requirement in insect flight.
The results in this study were obtained from an assumption that the negative rotational power is not stored by the elastic storage in the flight muscles and ignored in the calculation. This is because the wing is passively rotated about the torsion axis, signifying no muscle activation for wing rotation. However, the detailed structure of muscle activation inside the wing’s veins is unknown. It is possible that the wing rotational power contributes to the total power budget. To see whether the contribution of the rotational power alters the results of the study, we obtained the optimal AoA by considering that the elastic storage in the flight muscles is associated with both flapping and rotational motion. As shown in Fig. 4B, the rotational power was negative in its time course. For different elastic storage assumptions, this power could add to or reduce the total power needed for flight. Table 2 shows the cycle-average muscle mass-specific power with perfect storage assumption for different locations of the torsion axis. We can see that the negative rotational powerðPaero;rot þPiner;rotÞdissipated the inertial power required to
accelerate the wingðPiner;flapÞ. As a result, total mechanical power ðPmechÞ is similar to the aerodynamic power to flap ðPaero;flapÞ. Therefore, even though there are some minor differences near the wing root, the best AoA for the highest total PL are also similar to those for the best aerodynamic PL, as shown in Fig. S8A.
For an assumption of no elastic storage, although the inertial power is partially reduced by the contribution of negative rotational power, it is still present in the total power budget. Consequently, the best AoA for the highest total PL (with the inertial effect) are still higher than those of the aerodynamic PL (Fig. S8B), signifying the effect of inertial power. In the last assumption, when the muscles do negative work, the rotational power adds more to the total power budget, requiring the insect to spend extra energy for flapping the wings. In this case, the contribution of the inertial power alters the best AoA for the total PL, which are higher than those of the aerodynamic PL, as shown in Fig. S8C. In summary, with the inertial effect, the insect’s wing is still required to operate at high AoA for efficient flight.
We showed that the actual distribution of the AoA in the beetle’s hindwing was different from that of the best wings. The AoA are lower in the wing outboard but higher in the inboard than those in the best wings. For the perfect storage assumption, to generate the same vertical force of the beetle wings (4.65 gf ), the best wing (torsion axis located at 0.1c) may operate at about 4.9% lower frequency (38.5 Hz) than the beetle’s flapping frequency (40.5 Hz), saving about 9.6% of mechanical power (232.5 W kg−1). Interestingly, during hovering, the beetle’s hindwing does not operate at the optimal wing kinematics. Then, why does the beetle not? For the optimal AoA operation, the beetle should simultaneously reduce the AoA near the wing root and increase
A
B
0 0.5 1.0
0 15 30 45 60 75 90
Wingspan (r/R)
0 0.5 1.0
θavg
(deg)
[image:10.612.110.502.58.222.2]0 15 30 45 60 75 90
Fig. 8. Best AoA.(A) Values were obtained on the assumption of no elastic storage in the flight muscles. (B) Values were obtained on the assumption that muscles do negative work. Solid lines represent the best AoA for the total mechanical PL. Dashed lines depict the best AoA for the aerodynamic PL. Black, blue, green, yellow, orange and red denote the average AoA for the torsion axis located at 0.22c(CGwc), 0.20c, 0.15c, 0.10c, 0.05cand 0.0c(LE), respectively. Data in
gray show the AoA of the beetle’s hindwing.
Table 2. Muscle-mass specific power for different locations of the torsion axis for perfect storage assumption obtained from each individual time course of a flapping cycle
Muscle mass-specific power (W kg−1)
Location of torsion axis 0.00c(LE) 0.05c 0.10c 0.15c 0.20c 0.22c(CGwc)
Aerodynamic power to flap,Paero ;flap 236.06 232.59 229.10 225.61 222.12 220.76
Inertial power to flap,Piner;flap 50.44 39.01 27.56 16.09 4.60 0.00
Aerodynamic power to rotate,Paero ;rot −1.90 −2.16 −2.26 −2.28 −2.40 −2.60
Inertial power to rotate,Piner ;rot −48.96 −36.90 −25.14 −13.63 −2.26 0.000
Mechanical power,Pmech 235.64 232.54 229.25 225.79 222.05 218.16
LE, leading edge; CGwc, chordwise center of wing mass;c, wing chord length.
Journal
of
Experimental
[image:10.612.50.564.653.729.2]the AoA near the tip. We speculate that this action requires more vein structures distributed near the wing tip and trailing edge to resist the influence of aerodynamic and inertial forces during flapping. As a result, the additional wing mass causes more inertial power to be required, which again significantly reduces the hovering efficiency. From our perspective, operating the wing at the optimal kinematics by increasing the wing mass (more vein distribution near the tip) or more actively rotating the wing using flight muscle may require much more flight energy than flapping the wing, minimizing the inertial effect with a still relatively high AoA distribution. To support this hypothesis, we investigated how the wing mass distribution affects the total power requirement of the beetle by assuming that the wing, in which the mass is uniformly distributed along the wingspan (more mass distribution near the tip than the beetle’s hindwing) with CGwc=0.1c, is operated at the optimal AoA.
This mass distribution is also roughly similar to those in the current robotic flapping wings (Keennon et al., 2012; Ma et al., 2013; Phan et al., 2017b). For a perfect storage assumption, to produce the same vertical force, the optimal wing with uniform mass distribution
requires only 9.1% increase in the mechanical power
(253.6 W kg−1), compared with that of the optimal wing using the beetle wing’s mass distribution (232.5 W kg−1). This is because changing the wing mass alters the inertial power only, which is stored elastically. However, for no elastic storage assumption, the mechanical power is about 37.9% increase (336.1 W kg−1versus 243.7 W kg−1), which is 24.2% higher than the mechanical power required by the beetle’s wing kinematics (270.7 W kg−1) to generate the same vertical force. Thus, insects are capable of flapping their wings with a higher beat frequency to produce more lift against their body mass to stay airborne (Usherwood, 2009). Therefore, insects may minimize the energy of the flight by optimizing the wing mass and its distribution. Accordingly, the wing mass, and particularly the wing veins, are mainly concentrated near the wing base and the wing LE. Therefore, the location of the CGwcis close to but behind the torsion axis, as found in the beetle
here, the hawkmoth (Zhao and Deng, 2009), hoverfly (Ennos, 1988), blowfly (Ganguli et al., 2010; Lehmann et al., 2011) and butterfly (Lin et al., 2012). A similar distribution of the mass can be also observed in bats (Riskin et al., 2012) and birds (Weis-Fogh, 1972; Askew et al., 2001; Maeda et al., 2017). The above result also shows how the wing mass significantly affects the power requirement of a robotic wing, in which no available elastic elements are implemented to store the flight energy (Keennon et al., 2012; Ma et al., 2013; Phan et al., 2017b). Thus, a light-weight wing with an appropriate mass distribution is recommended to reduce the inertial effect for an efficient flight of a flapping-wing robot.
The results of this study indicate that a wing flapping at an aerodynamically optimal and low AoA requires a high inertial power. Furthermore, because of the low AoA, the wing has to increase its flapping speed to generate sufficient lift to stay airborne, resulting in an additional increase in inertial power (Usherwood, 2009). Thus, the associated augmentation in the inertial power causes an inefficiency in hovering flight at an aerodynamically optimal AoA. Indeed, hovering insects in nature were found to operate their wings at high AoA (Ellington, 1984a; Willmott and Ellington, 1997a; Mao and Gang, 2003; Usherwood, 2009; Walker et al., 2010; Liu and Sun, 2008; Fry et al., 2005; Le et al., 2013), which are still lower than or equal to the AoA for the maximum vertical force (effective AoA≈45 deg; Dickinson et al., 1999). It is highly probably that, from each specific body mass, the insects try to flap their wings at a proper AoA and frequency to generate enough lift to stay airborne at a minimum flight energy.
Conclusion
This work focuses on the question of why insects flap their wing at aerodynamically uneconomical high AoA during flight. From the hindwing’s mass distribution, morphology and 3D kinematics of a hovering horned beetleAllomyrina dichotoma, we investigated the effect of wing inertia on mechanical power requirement and AoA along the wingspan. We found that the insect may benefit from the tradeoff between the aerodynamic and inertial forces during flapping motion to reduce the total mechanical power required for flight. Although elastic storage may occur in the flight muscles to minimize flight energy, the cost needed to overcome wing inertia is still considerable. We propose that a higher AoA operation yields a lower inertial cost. Thus, the interaction between aerodynamic and inertial effects enables the wing to flap at aerodynamically uneconomical high AoA, as found in insect flight. To ensure passive wing rotation at stroke reversal, the chordwise center of wing mass should be located behind the torsion axis. We also found that the operation of the membranous beetle’s hindwing may not be at an optimal kinematics for hovering flight because of the effect of aerodynamic and inertial forces on its deformation.
Acknowledgements
We thank Prof. Lin Woo Kang at Konkuk University for allowing us to use their analytical balance.
Competing interests
The authors declare no competing or financial interests.
Author contributions
Conceptualization: H.V.P.; Methodology: H.V.P.; Formal analysis: H.V.P.; Writing -original draft: H.V.P.; Writing - review & editing: H.C.P.; Supervision: H.C.P.
Funding
This research was supported by a grant to the Bio-Mimetic Robot Research Center (UD130070ID) funded by the Defense Acquisition Program Administration and Agency for Defense Development and partially supported by the 2018 KU Brain Pool Program of Konkuk University, Korea.
Supplementary information
Supplementary information available online at
http://jeb.biologists.org/lookup/doi/10.1242/jeb.187369.supplemental
References
Alexander, R. M. N. and Bennet-Clark, H. C.(1977). Storage of elastic strain energy in muscle and other tissues.Nature265, 114-117.
Altshuler, D. L., Dickson, W. B., Vance, J. T., Roberts, S. P. and Dickinson, M. H. (2005). Short-amplitude high-frequency wing strokes determine the aerodynamics of honeybee flight.Proc. Natl. Acad. Sci. USA 102, 18213-18218.
Aono, H., Liang, F. and Liu, H.(2008). Near- and far-field aerodynamics in insect hovering flight: an integrated computational study.J. Exp. Biol.211, 239-257.
Askew, G. N., Marsh, R. L. and Ellington, C. P.(2001). The mechanical power output of the flight muscles of blue-breasted quail (Coturnix chinensis) during take-off.J. Exp. Biol.204, 3601-3619.
Bergou, A. J., Sheng, X. and Wang, Z. J.(2007). Passive wing pitch reversal in insect flight.J. Fluid. Mech.591, 321-337.
Berman, G. J. and Wang, Z. J.(2007). Energy-minimizing kinematics in hovering insect flight.J. Fluid. Mech.582, 153-168.
Burton, A. J. and Sandeman, D. C.(1961). The lift provided by the elytra of the rhinoceros beetle,Oryctes boasFabr.S. Afr. J. Sci.57, 107-109.
Chaudhuri, A., Haftka, R. T., Ifju, P., Chang, K., Tyler, C. and Schmitz, T.(2014). Experimental flapping wing optimization and uncertainty quantification using limited samples.Struct. Multidisc. Optim.51, 957-970.
Clawson, T. S., Fuller, S. B., Wood, R. J. and Ferrari, S.(2017). A blade element approach to modeling aerodynamic flight of an insect-scale robot. American Control Conference, Seattle, USA, pp. 2843-2849.
Combes, S. A. and Daniel, T. L.(2002). Flexible wings and fins: bending by inertial or fluid-dynamic forces.Integr. Comput. Biol.42, 1044-1026.
Dickinson, M. H. and Lighton, J. R. B.(1995). Muscle efficiency and elastic storage in the flight motor ofDrosophila.Science268, 87-90.