warwick.ac.uk/lib-publications
Original citation:
Dang, Hiep Vu and Živanović, Stana. (2016) Influence of low-frequency vertical vibration on
walking locomotion. Journal of Structural Engineering. 04016120.
doi: 10.1061/(ASCE)ST.1943-541X.0001599
Permanent WRAP URL:
http://wrap.warwick.ac.uk/80272
Copyright and reuse:
The Warwick Research Archive Portal (WRAP) makes this work of researchers of the
University of Warwick available open access under the following conditions.
This article is made available under the Creative Commons Attribution 4.0 International
license (CC BY 4.0) and may be reused according to the conditions of the license. For more
details see: http://creativecommons.org/licenses/by/4.0/
A note on versions:
The version presented in WRAP is the published version, or, version of record, and may be
cited as it appears here.
Influence of Low-Frequency Vertical Vibration
on Walking Locomotion
Hiep Vu Dang
1and Stana
Ž
ivanovi´c
2Abstract:Walking locomotion has been a subject of studies in diverse research fields, such as computer, medical, and sport sciences, biomechanics, and robotics, resulting in improved understanding of underlying body motion and gait efficiency and pathology (when present). Only recently, a detailed understanding of kinematics and kinetics of the walking locomotion has become an important requirement in structural engineering applications due to an increasing sensitivity of modern, lightweight, low-frequency, and lightly damped footbridges to pedestrian-induced dynamic excitation. To facilitate development, calibration and verification of pedestrian models requires experimental characterization of walking gait parameters and understanding whether and how these parameters are influenced by the structural vibration. This study investigates whether low-frequency vibrations in the vertical direction affect seven walking locomotion parameters: pacing fre-quency, step length, step width, angle of attack, end-of-step angle, trunk angle, and amplitude of the first forcing harmonic. Three participants took part in a testing program consisting of walking on a treadmill placed on both stationary and vibrating supporting surfaces. The collected data suggest that an increasing level of vibration results in an increase in step-by-step variability for the majority of parameters. Furthermore, the existence of the self-excited force, previously observed only in numerical simulations of walking on pre-excited bridge decks, was confirmed. In addition, the deck vibration tended to have a beneficial effect of reducing the net force induced into the structure when walking at a pacing rate close to the vibration frequency. Finally, it was found that the vibration level perceptible by a pedestrian is one to two orders of magnitude larger than that typical of a standing person, and that the sensitivity to vibration decreases as the speed of walking increases.
DOI: 10.1061/(ASCE)ST.1943-541X.0001599.This work is made available under the terms of the Creative Commons Attribution 4.0 International license,http://creativecommons.org/licenses/by/4.0/.
Author keywords: Walking locomotion parameters; Vertical vibration; Pedestrian-structure interaction; Self-excited force; Vibration perception; Shock and vibratory effects.
Introduction
Vibration serviceability assessment of footbridges under pedes-trian-induced dynamic actions has become a routine requirement in the contemporary structural engineering practice (Sétra 2006; ISO 2007;BSI 2008). This development is a result of increasing probability of pedestrians exciting resonance in modern, slender, lightweight, and low-frequency structures. In addition, these struc-tures are usually lightly damped, resulting in high sensitivity of the vibration response to the variations in the excitation frequency. Stochastic modeling of pedestrian loading has emerged to address a need to genuinely represent both the intersubject variability in walking locomotion parameters (i.e., variability within a human population using a particular structure) and the intrasubject vari-ability (i.e., step-by-step variations of a parameter within an indi-vidual) (Živanovi´c et al. 2007; Ing´olfsson and Georgakis 2011; Racic and Brownjohn 2011; Carroll et al. 2012; Bocian et al. 2014;Caprani 2014). In parallel, research into experimental quan-tification of both types of variability is being advanced to facilitate the calibration and verification of the stochastic models.
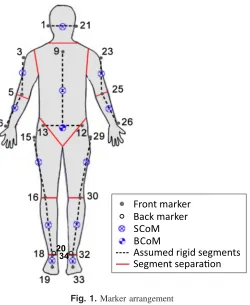
An experimental study that involved measuring both types of variability for seven walking locomotion parameters of potential interest in bridge engineering applications has recently been per-formed. The monitored parameters were the amplitude of the first forcing harmonic normalized by the pedestrian weight (so-called dynamic loading factor, DLF1), pacing ratefp, step lengthd, step widthw, angle of attackθ0, end-of-step angleθe, and trunk angleθtr (Dang andŽivanovi´c 2015;Živanovi´c et al. 2016). The parameters were derived from trajectories of 21 reflective markers attached to test subjects’(TSs’) anatomical landmarks and measured using a motion-capture system Vicon (Oxford Metrics, Oxford, U.K.). While the exact anatomical positions of these markers, also utilized in the current study, have been reported in the previous paper (Dang and Živanovi´c 2015), their graphical representation is shown in Fig.1 for a quick reference.
The marker trajectories were used in conjunction with the data on mass and position of the center of mass of individual body seg-ments (SCoMs) (de Leva 1996) to infer the kinematics of the body center of mass (BCoM). At the same time, the generated ground reaction force (GRF) was calculated by summing the inertial forces for the individual body segments (Racic et al. 2009). While the Vicon system records the marker trajectories with high accuracy (with the error up to 1 mm), the measurement error in the first forc-ing harmonic (for the chosen marker arrangement) was found to be less than 20% in the majority (90%) of trials (Dang 2014;Dang and Živanovi´c 2015). This error mostly originates from modeling as-sumptions (that the body segments are rigid and undamped, and that mass distribution throughout the body is the same for all individuals as are geometric locations of the center of mass of individual body segments) and measurement errors due to soft tissue artifact.
1Graduate Engineer, TSP, Floor 6, Alpha Tower, Suffolk St.,
Birmingham B1 1TT, U.K. E-mail: [email protected]
2Associate Professor, Univ. of Warwick, School of Engineering, Coventry
CV4 7AL, U.K. (corresponding author). E-mail: [email protected] Note. This manuscript was submitted on August 13, 2015; approved on May 1, 2016; published online on July 6, 2016. Discussion period open until December 6, 2016; separate discussions must be submitted for indi-vidual papers. This paper is part of theJournal of Structural Engineering, © ASCE, ISSN 0733-9445.
The study concluded that, when walking at a range of normal (comfortable) speeds, the recorded ranges of monitored parameters were similar to those available in wider literature. The coefficient of variation (COV) on a step-by-step basis was also reported: it was less than 5% for all parameters except DLF1(COV¼1.5–8.3%) and step width (COV¼13.4–39.2%).
Most studies available in the public domain, including Dang and Živanovi´c (2015), investigated walking over a stationary surface. Because the number of lively structures is increasing, a need to understand walking locomotion on vibrating surfaces has become critical (Racic et al. 2009). Bipedal models of humans are increas-ingly utilized in numerical studies because they not only directly resemble the geometry of the human legs and sufficiently accu-rately represent the force generated on the rigid surface, but also have a potential to be used to model pedestrian interaction with vibrating structures (Bocian et al. 2013; Qin et al. 2013; Dang 2014). In an attempt to conceptually model the effects of the ver-tical vibration on pedestrian locomotion, Bocian et al. (2013) used a simple bipedal model (inverted pendulum with rigid legs) to re-present a human walking over a vibrating bridge deck. They con-cluded that the simulated ground reaction force not only consists of the harmonic components at the pacing frequency and its integer multiples (as in the case of walking on stationary surfaces), but also of a component at the vibration frequency (so-called self-excited force). The existence of the self-excited force component was also found in comparative numerical and experimental studies into pedestrian-structure interaction with laterally oscillating decks (Macdonald 2009;Ing ´olfsson and Georgakis 2011). Bocian et al. concluded that the ground reaction force is most influenced by the vibration when a pedestrian walks at a pacing rate that is in the vicinity of the vibration frequency and that the effect can be mod-eled as equivalent damping and mass added to (or subtracted from) the damping and mass of the unoccupied bridge structure. They argued that the most likely net effect of a pedestrian crowd would be a reduction in the structural vibration response compared with
the response that would occur if the interaction effects had been ignored. However, an experimental verification of these findings on decks vibrating in the vertical direction has not been provided yet beyond rare observations on full-scale structures that pedes-trians, similar to standing people, seem to add damping to the sys-tem (Willford 2002;Brownjohn et al. 2004;Živanovi´c et al. 2009; de Sebastián et al. 2011). The U.K. design guideline (BSI 2008) acknowledges that understanding of pedestrian-structure interac-tion in the vertical direcinterac-tion is still evolving, to draw atteninterac-tion of structural designers to the fact that the existing design proce-dures, at the time being, cannot provide all the answers.
Lack of experimental data in relation to the interaction with vertically vibrating supporting surfaces motivated the authors to perform an experimental study of walking locomotion on a lively laboratory bridge and compare the results with benchmark data ac-quired on a stationary surface. Three TSs took part in the exper-imental program. In this paper, the lively structure is introduced first, followed by a description of the experimental procedure. Then the TSs’subjective perceptions of walking speed and vertical vi-bration are presented. The walking locomotion parameters recorded on the lively surface are then compared with the benchmark data. Finally, findings about effects of vertical vibration on the human walking locomotion are summarized.
Description of Lively Bridge
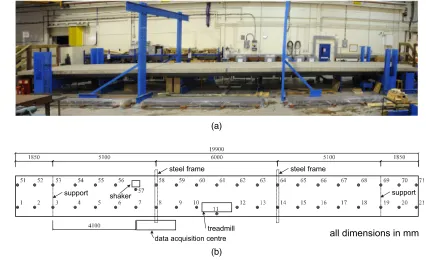
The bridge, hereafter referred to as the Warwick Bridge (WB), is a simply supported structure situated in the Structures Laboratory at the University of Warwick [Fig. 2(a)]. The bridge was built in 2012 to investigate pedestrian interaction with lively, low-frequency structures. Its composite (steel-concrete) cross section consists of 150-mm-thick reinforced concrete deck connected to two steel I-beams (UC203×203×52) by means of welded shear studs. The deck is 2 m wide and 19.9 m long, and the bridge has a total mass of approximately 16,500 kg. More detailed information on the design and construction of the bridge is available elsewhere (Lasheen et al. 2014).
The span of the bridge can be altered by relocating either one or both supports. Two span lengths were utilized in this study: 16.2 m (WB1) and 17.4 m (WB2). A grid of test points on the bridge deck, some of which were utilized in the experimental work presented in this paper, is shown in Fig. 2(b).
The natural frequency of the fundamental vertical bending vibra-tion mode is 2.44 Hz for WB1 and 2.18 Hz for WB2. The damping ratio is very low in both cases, and it ranges between 0.30 and 0.52%, depending on the vibration amplitude, while modal mass (including a treadmill placed at the midspan) is 7,700 kg for WB1 and 8,200 kg for WB2 (Dang andŽivanovi´c 2015). The low damping and low natural frequency make the bridge very lively, with accelerations as high as3m=s2being recorded due to a single person crossing the bridge fast with the intention to excite the resonance. When walking at a pacing rate away from the resonance, third vertical bending mode (at 18.18 Hz for WB1 and at 17.00 Hz for WB2) occasionally makes a significant contribution to the structural response due to its exceptionally low damping ratio of 0.3% (Lasheen et al. 2014). Both the third and the fundamental vibration modes have the maximum modal amplitude at the midspan.
Experimental Program
[image:3.612.46.296.29.334.2]Basic characteristics of the three healthy male TSs who participated in the experimental program are shown in Table1. Depending on the TS and the configuration of the bridge, the ratio between mass
Fig. 1.Marker arrangement
of a test subject and the modal mass of the bridge was between 0.0076 and 0.0094. The test protocol was introduced to TSs prior to the experiments. The TSs were then asked to complete and sign a consent form and a physical readiness questionnaire. The experi-mental program was approved by the Biomedical and Scientific Research Ethics Committee at the University of Warwick.
Components of Experimental Setup
The experimental setup involved walking on a treadmill (Fuel Fit-ness Model F63, Stoke-On-Trent, U.K.) placed either on a station-ary surface in the Gait Laboratory at the University of Warwick, or at the midspan point on the lively bridge [Fig.2(b)]. The treadmill weighs 86 kg, and it has a 0.5-m-wide and 1.4-m-long walking area, providing enough space for a comfortable walk by a single walker. The belt speed ranges between 0.28 and 5.00m=s, and it will be referred to as the average walking speed in this paper.
Walking on the treadmill was chosen over walking directly on the stationary or lively surface to enable prolonged monitoring of the walking locomotion (as opposed to only the 10–15 s required to cross the bridge once). In addition, the choice of the test setup was influenced by a successful use of a similar setup in the studies re-lated to walking on laterally vibrating structures (Ing ´olfsson et al. 2011). Although walking locomotion on the treadmill generally differs from walking over ground, Van de Putte et al. (2006) found that these differences become negligible after a 10-min-long warm-up session. As a result, a 15-min warm-warm-up session, at a range of belt
speeds chosen by the test subject, preceded all the tests presented in the current study.
A motion-capture system Vicon, consisting of 12 high-speed and low-latency cameras, was used to monitor pedestrian kinemat-ics in the Gait Laboratory at the sampling frequency of 200 frames per second. Every camera contains a strobe unit configured with light-emitting diodes to illuminate highly retroreflective markers attached to the test subject’s body. When a marker enters a field of view of a camera, it reflects the light back to the camera lens. The information from all the markers is then used to reconstruct the body movement. The data from all cameras were recorded using an MX Giganet data acquisition unit and processed using theNexussoftware to reconstruct displacements of all the markers in a three-dimensional space. It is necessary that each marker is seen by at least two cameras at any given time for processing to be successful.
Before use of the Vicon system on any particular day, the system was calibrated by monitoring markers attached to a calibration wand (an object of known geometry). Before starting the experi-ments, the background noise was determined by monitoring stationary markers for 30 s (Hasan et al. 1996) and found to be very low at a root-mean-square value of up to 0.05 mm.
Each TS was instrumented using 21 reflective markers, as shown in Fig.1. This layout covers 19 markers attached to the front of the body required to reconstruct the ground reaction force and one marker on each heel (Markers 20 and 34 in Fig.1) for iden-tifying the timing of the heel-strike event that is considered to be an important reference event during walking. Utilizing specifics of walking on a treadmill, the heel-strike event was identified as a time instant at which the movement of the heel marker of the leading leg changes from moving forward to moving backward (Zeni et al. 2008), while the toe-off was defined as an instant when the toe marker of the trailing leg changes from moving backward to mov-ing forward. The end-of-step angle was the only parameter deter-mined at the toe-off time instant. It is defined as an angle between the line connecting BCoM and midpoint between Markers 20 and (a)
[image:4.612.87.513.33.296.2](b)
Fig. 2.Warwick bridge: (a) photograph; (b) plan view
Table 1.Test Subjects Characteristics
Test subject Age (years) Height (cm) Mass (kg)
TS1 22 180 62.4
TS2 55 178 70.0
TS3 28 172 72.7
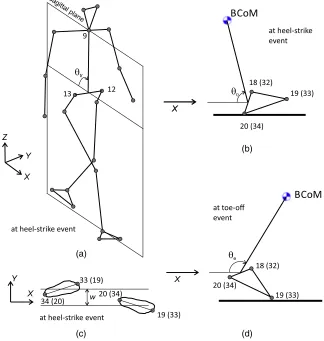
[image:4.612.41.296.354.405.2]18 (or 32 and 34) on the trailing leg and the horizontal line in the direction of progression (Fig. 3). The angle of attack was deter-mined in the same way, but at the heel-strike event of the leading leg (Fig.3). In addition the trunk angle was calculated at the heel-strike event as the angle between the line connecting Marker 9 and midpoint defined by Markers 12 and 13 and the horizontal line in the sagittal plane (Fig.3). The pacing rate was found as a reciprocal value of the step duration taken as the time elapsed between two successive heel strikes. The step length was then determined as a ratio between the treadmill speed and the step frequency. The step width was calculated as the lateral distance (perpendicular to the sagittal plane) between the two midpoints defined by the toe and heel markers of each leg (Fig. 3) at the heel-strike event. The DLF1 was determined as an amplitude of the force signal after performing narrow band-pass filtering around the relevant frequency.
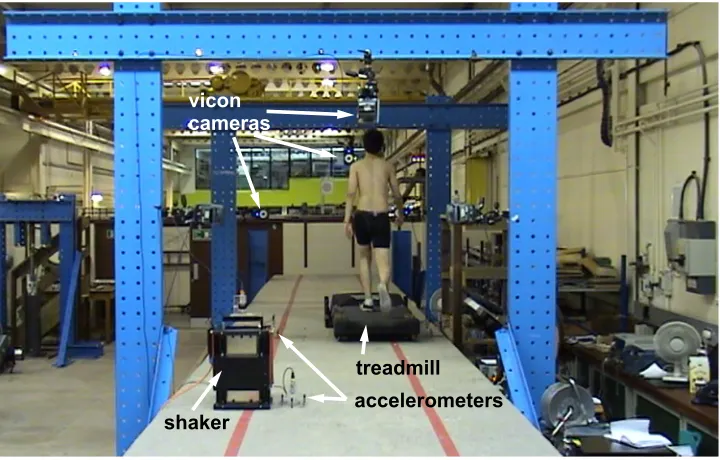
To perform experiments on the two lively bridge configurations, six Vicon cameras were attached to two steel frames built around the bridge (Fig.4). Three cameras monitored the frontal part of the TS’s body (sufficient for the force reconstruction) while the other three captured the back (to acquire kinematic data for the heel markers). The ambient light inside the laboratory was found to not have adverse effects on the operation of the Vicon system.
Apart from monitoring the kinematics of the test subject, the acceleration of the bridge at the midspan points (Test Points 11 and 61) and Test Point 57 [Fig. 2(b)] was recorded using QA-750 accelerometers (Fig. 4) having nominal sensitivity of
1.32V=g (Honeywell Sensing and Control, Columbus, Ohio).
An electrodynamic shaker (APS Dynamics, San Juan Capistrano, California) was placed at Test Point 57 [Fig.2(b)], and the accel-eration of its moving mass (and therefore the shaker-generated force) was measured using an additional QA-750 accelerometer (Fig.4). The shaker location on the deck was chosen to allow for excitation of the first vibration mode to desired vibration levels, and, at the same time, to be sufficiently distant from the midspan to not interfere with other aspects of the experimental procedure (e.g., test subject’s preparation and exact positioning of the treadmill). A data acquisition system Quattro SignalCalc (Data Physics, San Jose, California) was used to send an input signal to the shaker and to record the acceleration signals at a sampling frequency of 200 Hz. At the data acquisition center aside the bridge [Fig.2(b)], the shaker activity, the structural response, the treadmill operation, and the TS’s participation were closely monitored.
Tests on Stationary and Lively Surfaces
Each test subject participated in three series of tests. First they were asked to walk on the treadmill placed on the stationary surface in the Gait Laboratory, then on WB1, and finally on WB2. The experi-ments on each surface took place on different days and they in-volved walking at a range of walking speeds and, in case of tests on WB1 and WB2, over the surface vibrating at a range of shaker-induced vibration amplitudes.
In the Gait Laboratory, the TSs performed tests at 13 treadmill belt speeds following this order: 1.15, 1.56, 1.36, 1.88, 1.67, 2.08, 1.76, 1.04, 1.24, 0.84, 0.93, 1.97, and1.45m=s. The pseudorandom order (a)
(b)
[image:5.612.144.468.36.377.2](d) (c)
Fig. 3.Definitions of four walking locomotion parameters: (a) trunk angle; (b) angle of attack; (c) step width; (d) end-of-step angle
was employed to avoid potential psychological bias that could have occurred if either increasing or decreasing speed order was utilized. In total, 39 trials were recorded, each consisting of at least 400 steps to acquire statistically reliable data (Owings and Grabiner 2003). Data recording started after the treadmill reached the target speed and the TS felt they achieved steady walking. Between two succes-sive trials, the TS was given a 3–5 min break, during which the data acquisition system was checked. In particular, the attachment of the markers to the TS was inspected. In rare cases in which loose markers were identified, the previous trial was repeated. During this break the test subjects were also asked to subjectively evaluate the walking speed. A test session took up to 2.5 h per test subject.
In the tests on WB1 and WB2, four levels of preinduced vibra-tion were utilized: either the shaker was switched off, or the shaker generated a harmonic force (at the frequency that matched the fun-damental frequency of the bridge) required to induce a steady-state acceleration response amplitude of 0.5, 0.85, or1.2m=s2 at the midspan. The test setups with preinduced vibrations were used to simulate a real-life scenario of a person crossing a bridge already excited by other pedestrians. The experiments at each bridge configuration were performed following this order of steady-state acceleration levels: 0 (shaker switched off), 0.50, 1.20, and
0.85m=s2.
The choice of the steady-state vibration levels was informed by the current design guidelines. For example, International Organiza-tion for StandardizaOrganiza-tion (ISO) (2007) states that the boundary between unacceptable and acceptable acceleration amplitudes is
0.65m=s2 at frequency of 2.18 Hz (WB1) and0.61m=s2 at fre-quency of 2.44 Hz (WB2). On the other hand, the French guideline Service d’Etudes Techniques des Routes et Autoroutes (Sétra) (2006) considers that structures experiencing the peak acceleration of less than0.5m=s2provide maximum comfort. When vibration is in the range0.5–1.0m=s2, the bridge is considered to provide mean comfort, while1.0–2.5m=s2 are classified as structures of mini-mum comfort. Finally, vibrations above2.5m=s2 are considered unacceptable.
The preinduced vibration level in this paper was limited to
1.20m=s2. The limit was chosen (based on the authors’experience
with tests on the bridge) with an intention to prevent the joint shaker-and-pedestrian-induced vibration exceeding the Sétra limit of2.5m=s2 as well as to avoid exposing the bridge to high stress levels.
In five out of six sets of experiments (the six sets referring to three TSs on two bridge configurations) performed on the WB, TSs were asked to walk at seven different speeds. Only for TS1 walking on WB1 the number of speeds was reduced to five due to time re-strictions imposed on testing on this particular day. In total, 160 trials were recorded. The order of walking speeds for WB1 was 1.45, 1.15, 2.08, 1.76, 0.84, 1.56, and 1.36m=s (speeds 1.36 and 1.56m=s were not attempted by TS1), while for WB2 it was 1.45, 1.88, 1.15, 2.08, 1.76, 0.84, and1.97 m=s. The natural frequency of 2.44 Hz for WB1 is close to the upper limit of possible pacing rates and therefore it could only be matched by very fast walking. Because the likelihood of matching resonance is this case was low, the walking speeds were selected with the aim to make TSs walk at as wide a range of pacing rates as possible. On WB2, TSs were well capable of walking at the pacing rate that matches the natural frequency of 2.18 Hz. Therefore in this case three test speeds, 1.88, 1.97, and2.08m=s (which were, depending on TS, equivalent to the pacing rates between 2.1 and 2.3 Hz), were chosen to increase the likelihood of resonance. Overall, the experiments were designed to investigate the effect of the structural vibration on the human gait for a range of pacing frequency to vibration fre-quency ratios.
In the trials with the preinduced vibration, the TS was first in-structed to stand still on the nonoperational treadmill. Then the shaker was switched on. After achieving the predefined steady-state vibration level, the treadmill was activated and the TS began walk-ing. After 30 s, the recording of the marker trajectories and the ac-celeration of the bridge started until a minimum of 400 steps was acquired. Immediately after finishing a test, the TS was asked to subjectively evaluate the vibration perceived.
[image:6.612.127.487.33.263.2]A test session with a single TS walking on one bridge configu-ration lasted up to 4 h. In total, the three TSs completed approx-imately 64,000 steps on the bridge, which is equivalent to covering a distance of approximately 45 km. To the best knowledge of the
Fig. 4.Test setup in which an instrumented test subject and electrodynamic shaker excite the bridge simultaneously
authors, this experimental program is the largest pedestrian-structure interaction study performed on a bridge deck exposed to the vertical vibration.
Data Analysis
In this section, data processing is explained first, followed by a data analysis with respect to:
• Pedestrians’ subjective classification of walking speed and perceived vibrations;
• Influence of the vertical vibration on the pacing rate, step length, step width, and angular parameter; and
• Influence of the vertical vibration on the ground reaction force.
Data Preparation
Displacement trajectories of the markers were filtered inMATLAB
using a low-pass fourth-order Butterworth zero-phase-shift filter with the cutoff frequency of 10 Hz and then differentiated twice to calculate the acceleration signals. Then the inertia forces of indi-vidual body segments were found and summed up to calculate the ground reaction force. In this process, the position of BCoM was also determined (Dang andŽivanovi´c 2015).
The acceleration response at the midspan was low-pass filtered using a fourth-order Butterworth filter with a cutoff frequency of 10 Hz to extract modal response in the first vertical bending mode only. This modal response dominated the response of the bridge by contributing to at least 80% of the signal energy in 128 out of 160 trials (Dang 2014). In the remaining 32 trials the contribution of the mode at 18.18 Hz on WB1 and 17.00 Hz on WB2 was relatively significant, but the overall amplitude of the vibration response was low. The low vibration amplitude and the expectation that the walker is less sensitive to vibration at 17–18 Hz compared with vibration at 2–3 Hz, similar to well-established frequency-dependent vibra-tion percepvibra-tion for a standing person (ISO 2007), were decisive fac-tors in analyzing the modal response in the first mode only. After filtering the signal measured at Test Point 11 [Fig.2(b)], the peak acceleration was extracted on a vibration cycle–by–vibration cycle basis. The mean of these values was named the average peak-per-cycle acceleration,appc, and it will be used as a measure of vi-bration strength during a test. The maximum acceleration value in a trial was utilized for the purpose of evaluating human response to deck vibration, and it will be referred to as the peak acceleration.
The locomotion parameters were extracted from each trial on a step-by-step basis following the standard procedures explained in detail by Dang and Živanovi´c (2015). Then the average and the coefficient of variation of a parameter were calculated for each trial. The percentage differenceΔXbetween statistical descriptorX (ei-ther the average value or the COV) calculated for the two surfaces
ΔX¼
Xbridge−Xrigid
Xrigid 100ð%Þ ð1Þ
was used to observe if the surface vibration causes an increase or decrease in the parameter statistics.
Speed and Vibration Perception in Walking Posture
The TSs were asked to subjectively classify the treadmill speeds utilized in the tests in the Gait Laboratory into one of the following categories: slow, normal, or fast. Their responses were recorded after completion of each trial. It was found that TS1 considered walking speed between (and including) 1.24 and1.67m=s as nor-mal, while TS3 preferred slightly slower walking (1.15–1.45m=s).
The speeds below and above these ranges were categorized as slow and fast, respectively. On the other hand, TS2 is a naturally fast walker who classified all belt speeds≤1.56m=s as slow and all speeds≥1.67m=s as normal.
After each trial performed on the bridge, the TSs were asked to classify perceived vibration into one of the following categories: did not perceive vibration (Category 1), the vibration was accept-able and had no effect on the walking style (Category 2), the vi-bration was acceptable and occasionally affected the walking (Category 3), and the vibration was strong or uncomfortable and affected the walking style most of the time (Category 4). Because there were only seven trials reported to belong to Category 3, the data in Categories 3 and 4 were merged into one data set in further analysis.
The pedestrian’s subjective classification of whole body vibra-tion (resulting from transfer of the vibravibra-tion from the oscillating footbridge deck through the pedestrian’s feet) is presented in Fig.5. For pacing rate above approximately 1.75 Hz, walkers’sensitivity to vibration decreased with increase in the pacing frequency. This outcome is likely to be a consequence of at least two factors: (1) a shorter duration of continuous foot-deck contact when walking fast (which results in less time available for transmission of vibration through the human body), and (2) a larger acceleration of the hu-man body when walking fast (which makes the deck vibration less noticeable). For walking at frequencies up to 1.75 Hz the duration of the foot contact became long enough and the acceleration of the walker small enough that the classification of the vibration became independent from the pacing rate.
[image:7.612.318.570.32.212.2]To depict the relationship between the vibration level and the pacing frequency forfp>1.75Hz, the best (second-order polyno-mial) fitting functions were found for Category 1 (dotted line), Category 2 (dashed line), and Categories 3/4 (dot-dashed line) us-ing the least-square method. Forfp≤1.75Hz, the representative vibration level is chosen as constant for each vibration category. The average value between the first two fitting functions is also presented (thin solid line in Fig.5) and it can be interpreted as per-ception threshold in the walking posture. This threshold ranges from approximately0.3m=s2 while walking slowly to 1.3m=s2 at approximately 2.2 Hz. The average value between the last two fitting functions is shown as a thick solid line in Fig.5and it can be interpreted as the complaint threshold in the walking pos-ture. The peak acceleration at the complaint threshold ranges from
Fig. 5.Pedestrian’s subjective classification of whole body vibration while walking at a range of pacing frequenciesfp
0.8m=s2 at the slow pacing rates to 1.9m=s2 at the pacing rate of 2.2 Hz.
The ratio between the complaint threshold and the perception threshold can be interpreted as the response factor. The limit value of the response factor is frequently defined in the current design guidelines as a means of evaluating the vibration serviceability state of a structure, usually in nonwalking postures (e.g., Concrete Centre 2007; ISO 2007). To achieve low probability of adverse comments during daytime vibration exposure in residential envi-ronments, the Concrete Centre and ISO guidelines set the response factor limit to 2–4. The results in this paper suggest that the limit response factor in the walking posture is approximately 2.0 (i.e., be-tween 1.5 and 2.6, depending on the pacing rate), and therefore comparable to the lower end value defined for the residential envi-ronments. While the relative ratio between the complaint and per-ception threshold is similar, the perper-ception levels in the walking posture were found to be between 30 (for slow walking) and 130 (for fast walking) times larger than those for the standing pos-ture (approximately 0.01m=s2 for vibration frequency around 2–3 Hz).
As for comparing the complaint threshold with the existing vi-bration limits for footbridges, the range of0.8–1.9m=s2(Fig.5) is within the range of either mean or minimum comfort on footbridges defined by Sétra (2006), while it is well above the vibration limits suggested by ISO (2007) for pedestrians walking fast. However, the limit recommended by ISO (2007) seems appropriate for slow walkers.
Given the large scatter in the data that is inherent to characteri-zation of human perception of vibration, all numerical values re-ported in this section should be treated as indicative, until data collected for a larger population of test subjects become available.
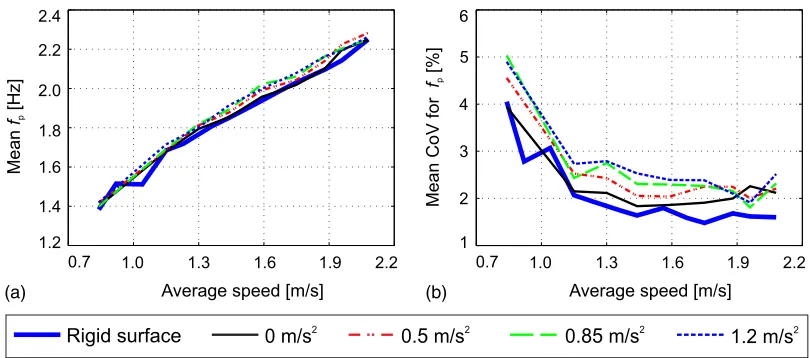
Pacing Rate
The average pacing rate recorded on the bridge, when compared with that recorded on the stationary surface, increased in 76% of the trials (with the maximum increase of 8%) and decreased in the remaining 24% of trials (with the maximum decrease of 7%). While the liveliness of the deck did not influence the average pacing rate much, the influence on the COV was one order of mag-nitude larger. Namely, the COV for pacing rate increased (when compared to that on the rigid surface) in 84% of trials, with maxi-mum increase being 176% (Dang 2014). This result suggests that
the step-by-step variation in the pacing rate was significantly larger on the lively surface.
The reported overall increase in the average pacing frequency and COV could be a consequence of not only vibration of the deck but also the natural variations in human locomotion on different occasions (i.e., on different days of testing). Figs.6(a and b)clarify the influence of the two factors by showing the mean values (within the population of three TSs) of the average pacing rate and COV, respectively, for five test conditions (i.e., tests on stationary surface, bridge with shaker switched off, and bridge pre-exposed to vibra-tion amplitude of 0.5, 0.85, and1.2m=s2). It can be seen that the results for walking on the bridge with no shaker-induced force (thin solid lines in Fig.6), which are associated with low and mainly imperceptible vibration response of the bridge, are relatively similar to the walking on the stationary surface (thick solid lines). This observation suggests that the pacing rate did not significantly differ in these two conditions despite the tests being conducted on differ-ent days. Increase in the preinduced vibration level is therefore the most likely cause of a significant increase in the COV [Fig.6(b)], while the marginal increases of the average pacing rate are only circumstantial [Fig.6(a)].
The layout used in Fig.6for presenting influence of vibration on the pacing rate will be used as a template for presenting the data for other parameters hereafter.
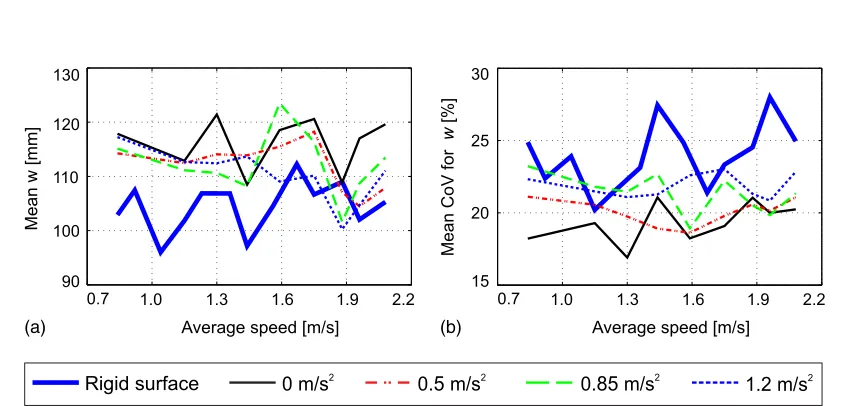
Step Length and Width
In 78% of trials, the average step lengthdmeasured on the bridge was lower than that on the stationary surface. The maximum drop was 8% (Dang 2014), in agreement with the 8% increase in the pacing rate, as would be expected (given that the walking speed, which is a product between the pacing rate and the step length, is kept constant in every trial). On the other hand, the COV for the step length is larger than that recorded on the stationary surface in 84% of trials with the maximum increase being 177% (Dang 2014). Data in Fig.7(a)demonstrate a marginal decrease in the mean step length, while Fig. 7(b) shows a noticeable increase in the mean COV, mainly caused by the vibration of the surface (because the thin and thick solid lines are close to each other for most walking speeds).
Figs.8(a and b)show that the average step width and its varia-tion are quite different between walking on the stavaria-tionary surface (thick solid lines) and on the bridge surface with no shaker input
[image:8.612.103.508.29.208.2](a) (b)
Fig. 6.Mean value for (a) average pacing rate; (b) COV of pacing rate as a function of walking speed on surfaces characterized by different back-ground vibration conditions
(thin solid lines). This observation suggests that the step width parameter is more sensitive (than the pacing rate and the step length parameters) either to the testing on different days or to small vibration levels seen in the tests in which the shaker was switched off, or to a combination of these two effects. Considering the data acquired on the bridge only, it can be concluded that the average step width and its COV are relatively independent from the vibra-tion level.
Angular Parameters
The average attack angle and the COV are larger on lively than on the stationary deck surface in 71 and 86% of trials, respectively. The maximum increase of the average value is low at approxi-mately 7%, while for COV it could be as large as 170% (Dang 2014). Similar to the results for the pacing rate and the step length, the influence of vibration on the COV for the attack angle is much larger than the influence on the average value. Fig.9confirms this. The marginal increase in the average attack angle with increase in the vibration level, seen in Fig.9(a)(mainly for speed greater than
1.3m=s), is, given geometrical constraints of the human legs, an
expected consequence of the marginal reduction in the average step length observed in Fig. 7(a).
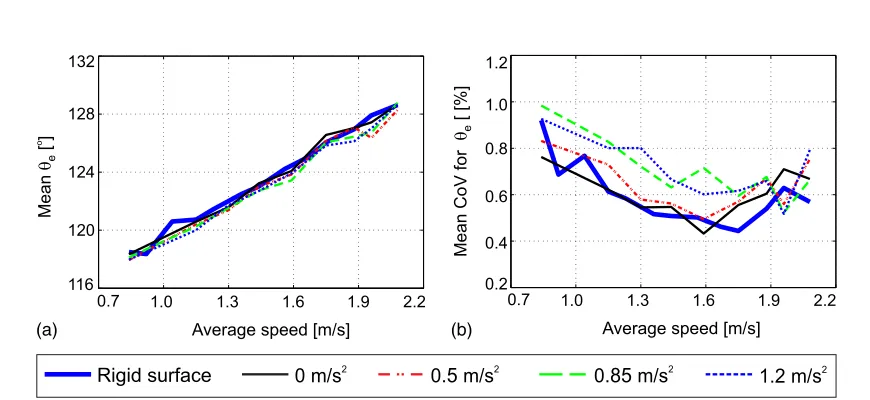
The average end-of-step angle measured on the vibrating sur-face was within 2% of that measured on the rigid sursur-face. However, the COV on lively surface increased in 65% of trials, with the maxi-mum increase being approximately 140%. Fig.10(a)confirms that it is difficult to differentiate between the values of the end-of-step angle measured on different surfaces, while Fig.10(b)reinforces the finding that an exposure to higher vibration level generally re-sults in an increased variability in this angular parameter.
The average trunk angle increased in 83% of trials on the lively surface, but this increase was up to only 4% in all but three trials. In 65% of the trials, the COV for the trunk angle increased up to 70% (Dang 2014). Although this increase in COV is not as large as for some other parameters, it is still one order of magnitude larger than that for the average trunk angle. Fig.11shows that larger vibration levels lead to a larger increase in both the average trunk angle and the COV. Therefore, while walking on the lively surface the TSs tend, on average, to lean forward marginally more than when walking on the stationary surface and the variation in the angle on a step-by-step basis increases.
[image:9.612.103.509.29.201.2](a) (b)
Fig. 7.Mean value for (a) average step length; (b) COV of step length as a function of walking speed on surfaces characterized by different back-ground vibration conditions
(a) (b)
Fig. 8.Mean value for (a) average step width; (b) COVof step width as a function of walking speed on surfaces characterized by different background vibration conditions
[image:9.612.94.520.247.450.2]Ground Reaction Force
Characteristics of Force Spectrum
Fig.12shows amplitude of GRF spectra for trials in which TS1 walked on WB2 at speeds of 0.84 and1.44m=s. With the shaker switched off, the first forcing harmonic can be observed in the spec-tra, as expected [Fig.12(a)]. For walking at the bridge pre-excited to the steady-state acceleration amplitude of0.85m=s2at 2.18 Hz, the spectra exhibit an additional peak at the vibration frequency [dotted vertical line in Fig.12(b)]. The additional peak represents the self-excited force that is a consequence of the pedestrian’s in-teraction with the oscillating deck.
In most trials performed when the bridge was exposed to the preinduced vibration, it was possible to extract both the first har-monic amplitude (i.e., DLF1) and the amplitude of the self-excited force [which, after being normalized by the body weight, will be referred to as the self-excited factor (SEF)].
To determine DLF1on a step-by-step basis, the force signal was band-pass filtered using a fourth-order Butterworth filter. The filter bandwidth was set to include frequency lines within3standard
deviations of the average pacing rate, previously presented in the “Pacing Rate”section. The SEF was calculated in a similar way, but using a band-pass filter having the center frequency set to be equal to the vibration frequency and the filter bandwidth chosen as 0.05 Hz, as recommended by Ing ´olfsson et al. (2011). When the pacing frequency was very close or equal to the vibration fre-quency, the two force components could not be separated. In these cases their joint effect will be referred to as the total force factor (TFF), which represents the total force normalized by the body weight.
Key Properties of the Pedestrian-Generated Force
When the TSs walked at a pacing frequency away from the vibra-tion frequency of the bridge, the DLF1was found to be similar to that observed on the rigid surface (Dang 2014). More interestingly, in 40 trials in which the pacing rate was close or equal to the vi-bration frequency, the TFF values from the tests on the bridge dif-fered noticeably from the DLF1values from the tests on the rigid surface. In 12 of these trials, the difference was larger than the measurement error of 20%, and in all these cases the TFF was lower (by 21–53%) than the corresponding DFL1. This result implies that
[image:10.612.105.507.32.206.2](a) (b)
Fig. 9.Mean value for (a) average attack angle; (b) COV of attack angle as a function of walking speed on surfaces characterized by different background vibration conditions
[image:10.612.88.523.251.451.2](a) (b)
Fig. 10.Mean value for (a) average end-of-step angle; (b) COV of end-of-step angle as a function of walking speed on surfaces characterized by different background vibration conditions
walking at a pacing rate that is close or equal to the vibration frequency results in a force drop. The reduction in the pedestrian-induced force can be alternatively presented as equivalent damping and mass that the pedestrian adds to the system. Using methodol-ogy for calculation of the added mass and damping presented by
Bocian et al. (2013), the added damping was found to be between 2,500 and 5,000Ns=m, while the equivalent mass ranged from
−100to 700 kg [Fig.13(a)]. The numerical values of added mass and damping reported here are similar to those resulting from numerical simulations by Bocian et al. This result suggests that
[image:11.612.105.510.32.202.2](a) (b)
Fig. 11.Mean value for (a) average trunk angle; (b) COV of trunk angle as a function of walking speed on surfaces characterized by different background vibration conditions
[image:11.612.101.520.239.420.2](a) (b)
Fig. 12.Amplitude of GRF spectra (with frequency resolution of 0.02 Hz) for TS1 walking on WB2: (a) without preinduced vibration; (b) with preinduced steady-state vibration of0.85m=s2at 2.18 Hz
(a) (b)
Fig. 13.(a) Equivalent added damping (circles) and mass (stars) for selected 12 trials; (b) average SEFs as functions of the pacing to vibration frequency ratio and preinduced vibration level
[image:11.612.100.519.455.628.2]Bocian et al.’s inverted pendulum model is a promising means for simulating effects of a human walking over oscillating structures, at least in those cases in which the vibration characteristics are similar to those encountered in the experiments presented in this paper (vibration frequency of approximately 2 Hz and vibration ampli-tude in the range 4–10 mm).
Regardless of the presence of the measurement error in the GRF, the conclusion can be drawn that when a pedestrian walks over a bridge set in motion by other pedestrians, the pedestrian generates the force that contains a self-excited force component at the vibra-tion frequency. The data collected suggest that the SEF is relatively independent from the pacing rate to vibration frequency ratio and it generally increases with an increase in the vibration level [Fig.13(b)].
For further characterization of the influence of vibrating surface on the pedestrian-generated dynamic force, and a more precise quantification of the SEF component, it would be extremely ben-eficial to develop an experimental procedure with improved meas-urement accuracy for GRF.
Discussion and Conclusions
Three TSs participated in an experimental program designed to measure characteristics of seven walking locomotion parameters on a lively footbridge deck and evaluate these characteristics against the benchmark data acquired on a stationary surface. The deck was pre-excited by an electrodynamic shaker to a steady-state acceler-ation level of 0, 0.5, 0.85, and1.2m=s2. It was found that increasing vibration level leads to a marginal increase in the pacing rate, the attack angle, and the trunk angle, and a slight decrease in the step length compared with the benchmark data. The largest increase was approximately 8% only. These marginal differences are only circumstantial and should be further researched. The experiments also revealed that an increase in the vibration level could cause a noticeable increase in the step-by-step variation in all four walking locomotion parameters considered so far. This information could be utilized in the development of high-fidelity models of pedestrians (e.g., bipedal models that aim to represent mass, stiffness, and damping properties of the pedestrian body) with the aim of realis-tically representing the kinematic and geometry constraints of the human-structure interface.
The average and COV values of the step width seem to be influenced by testing on different testing days rather than by the vibration level imposed. The average value of the end-of-step angle is also vibration independent, i.e., the pedestrian’s geometry of the trailing leg at the toe-off event remains the same regardless of the presence or absence of vibration. The step-by-step variability, however, increased with an increase in vibration levels.
As for the walking-generated force, the results of the previous numerical studies by Bocian et al. (2013), arguing that there are two components contributing to the GRF on the vibrating structure, DLF1 and SEF, have been experimentally confirmed. It has also been found that SEF increases with an increase in the vibration am-plitude. When the pacing rate was close to the vibration frequency, DLF1and SEF combined to produce the TFF. In most of the trials they combined in such a way to reduce the force that would otherwise be induced on a stationary surface. This result confirms rare experimental observations from the previous studies (Willford 2002;Brownjohn et al. 2004;Živanovi´c et al. 2009;de Sebastián et al. 2011) that pedestrians have a damperlike effect on the struc-tures vibrating in the vertical direction. Twelve trials were studied in more detail, and it was concluded that the drop in the force was equivalent to adding damping (between 2.5 and 5kNs=m) and
mass (from−100to 700 kg) to the system. These values are very similar to those predicted by the inverted pendulum model for pe-destrians (Bocian et al. 2013). It should be kept in mind that all these results are observed for low-frequency vibrations at the fre-quency of approximately 2 Hz and with the average vibration am-plitude in the range between 4 and 10 mm. The force reduction effect was also observed in experiments with people performing other types of activities, such as bouncing (Yao et al. 2004) and jumping (Yao et al. 2006).
Finally, a rarely available insight into human response to vibra-tion in the walking posture has been obtained. The vibravibra-tion per-ception and complaint thresholds were found to be approximately constant for walking frequency up to 1.75 Hz. For walking at pac-ing rates above 1.75 Hz, the two threshold levels increased with an increase in the walking speed. The perception threshold ranged from 0.3 to1.3m=s2, while the complaint threshold was between 0.8 and1.9m=s2. This result represents a rare attempt of observing subjective response to vibration at a range of pacing rates since the pioneering work on vibration perception in the walking posture by Leonard (1966) and Smith (1969). The response factor for walking posture was found to be approximately 2, which is similar to that adopted in the vibration serviceability guidelines for vibration ex-posure in residential buildings in standing or sitting postures. How-ever, the vibration level that is perceived by a pedestrian is one to two orders of magnitude larger than that for a standing person, with greater difference seen at faster pacing rates.
This paper provides a unique insight into the human locomotion on and interaction with vibrating surfaces. It is hoped that the study will motivate further development of numerical models and that it will inspire additional experimental work that will look into the interaction under a wider range of vibration amplitudes and frequencies and with the participation of a larger number of test subjects.
Data Availability
Electronic format of the data collected in this research can be down-loaded freely from the University of Warwick webpageshttp://wrap .warwick.ac.uk/79038/.
Acknowledgments
This research work was supported by the U.K. Engineering and Physical Sciences Research Council (Grant Number EP/ I03839X/1: Pedestrian Interaction with Lively Low-Frequency Structures). The first author was also supported by the Warwick Postgraduate Research Scholarship. The authors would like to thank Birmingham Science City and Advantage West Midlands for the access to the Gait Laboratory.
References
Bocian, M., Macdonald, J. H. G., and Burn, J. F. (2013).“ Biomechanically-inspired modeling of pedestrian-induced vertical self-excited forces.”
J. Bridge Eng.,10.1061/(ASCE)BE.1943-5592.0000490, 1336–1346.
Bocian, M., Macdonald, J. H. G., and Burn, J. F. (2014).“Probabilistic criteria for lateral dynamic stability of bridges under crowd loading.”
Comput. Struct., 136, 108–119.
Brownjohn, J. M. W., Fok, P., Roche, M., and Omenzetter, P. (2004).“Long span steel pedestrian bridge at Singapore Changi Airport—Part 2: Crowd loading tests and vibration mitigation measures.” Struct. Eng., 82(16), 28–34.
BSI (British Standards Institution). (2008).“U.K. national annex to Euro-code 1: Actions on structures—Part 2: Traffic loads on bridges.”EN 1991-2:2003, London.
Caprani, C. C. (2014).“Application of the pseudo-excitation method to as-sessment of walking variability on footbridge vibration.” Comput. Struct., 132, 43–54.
Carroll, S. P., Owen, J. S. and Hussein, M. F. M. (2012).“Modelling crowd-bridge dynamic interaction with a discretely defined crowd.”J. Sound
Vib., 331(11), 2685–2709.
Concrete Centre. (2007).“A design guide for footfall induced vibration of structures.”London.
Dang, H. V. (2014).“Experimental and numerical modelling of walking locomotion on vertically vibrating low-frequency structures.” Ph.D. thesis, School of Engineering, Univ. of Warwick, Coventry, U.K. Dang, H. V., andŽivanovi´c, S. (2015).“Experimental characterisation of
walking locomotion on rigid level surfaces using motion capture system.”Eng. Struct., 91, 141–154.
de Leva, P. (1996).“Adjustments to Zatsiorsky-Seluyanov’s segment inertia parameters.”J. Biomech., 29(9), 1223–1230.
de Sebastián, J., Díaz, I. M., Casado, C. M., Vasallo, A., Poncela, A. V., and Lorenzana, A. (2011). “Environmental and crowd influence on the dynamic behaviour of an in-service footbridge.”Proc., 4th Int. Conf. Footbridge 2011, Wroclaw Univ. of Technology, Wrocław, Poland. Hasan, S. S., Robin, D. W., Szurkus, D. C., Ashmead, D. H., Peterson, S.
W., and Shiavi, R. G. (1996). “Simultaneous measurement of body center of pressure and center of gravity during upright stance—Part I: Methods.”Gait Posture, 4(1), 1–10.
Ing ´olfsson, E. T., and Georgakis, C. T. (2011).“A stochastic load model for pedestrian-induced lateral forces on footbridges.”Eng. Struct., 33(12), 3454–3470.
Ing ´olfsson, E. T., Georgakis, C. T., Ricciardelli, F., and Jönsson, J. (2011).
“Experimental identification of pedestrian-induced lateral forces on footbridges.”J. Sound Vib., 330(6), 1265–1284.
ISO (International Organization for Standardization). (2007).“Bases for design of structures—Serviceability of buildings and walkways against vibration.”ISO 10137, Geneva.
Lasheen, M. R. M.,Živanovi´c, S., Salem, E., and Dang, H. V. (2014).
“Static and dynamic performance of a steel-concrete composite bridge.”
Proc., 9th Int. Conf. on Structural Dynamics (EURODYN 2014). Leonard, D. R. (1966).“Human tolerance levels for bridge vibrations.”
TRRL Rep. No. 34, Road Research Laboratory, Crowthorne, U.K. Macdonald, J. H. G. (2009).“Lateral excitation of bridges by balancing
pedestrians.”Proc., Royal Society A, 465, 1055–1073.
MATLAB version 7.13.0.564 [Computer software]. Mathworks, Natick, MA.
Nexus version 1.4.1[Computer software]. Vicon, Oxford, U.K. Owings, T. M., and Grabiner, M. D. (2003).“Measuring step kinematic
variability on an instrumented treadmill: How many steps are enough?”
J. Biomech., 36(8), 1215–1218.
Qin, J. W., Law, S. S., Yang, Q. S., and Yang, N. (2013).“Pedestrian-bridge dynamic interaction, including human participation.” J. Sound Vib., 332(4), 1107–1124.
Racic, V., and Brownjohn, J. M. W. (2011).“Stochastic model of near-periodic vertical loads due to humans walking.”Adv. Eng. Inf., 25(2), 259–275.
Racic, V., Pavic, A., and Brownjohn, J. M. W. (2009).“Experimental iden-tification and analytical modelling of human walking forces: Literature review.”J. Sound Vib., 326(1–2), 1–49.
Sétra (Service d’Etudes Techniques des Routes et Autoroutes). (2006).
“Footbridges, assessment of vibrational behaviour of footbridges under pedestrian loading.”Technical Guide, Paris.
Smith, J. W. (1969).“The vibration of highway bridges and the effects on human comfort.”Ph.D. thesis, Univ. of Bristol, Bristol, U.K. Van de Putte, M., Hagemeister, N., St-Onge, N., Parent, G., and de Guise,
J. A. (2006).“Habituation to treadmill walking.”Bio-Med. Mater. Eng., 16(1), 43–52.
Willford, M. (2002). “Dynamic actions and reactions of pedestrians.”
Proc., Footbridge 2002, Paris.
Yao, S., Wright, J. R., Pavic, A., and Reynolds, P. (2004).“Experimental study of human-induced dynamic forces due to bouncing on a percep-tibly moving structure.”Can. J. Civ. Eng., 31(6), 1109–1118. Yao, S., Wright, J. R., Pavic, A., and Reynolds, P. (2006).“Experimental
study of human-induced dynamic forces due to jumping on a percep-tibly moving structure.”J. Sound Vib., 296(1–2), 150–165.
Zeni, J. A., Jr., Richards, J. G., and Higginson, J. S. (2008).“Two simple methods for determining gait events during treadmill and overground walking using kinematic data.”Gait Posture, 27(4), 710–714.
Živanovi´c, S., Díaz, I. M., and Pavic, A. (2009).“Influence of walking and standing crowds on structural dynamic performance.” 27th Proc., IMAC, Society for Experimental Mechanics (SEM), Bethel, CT.
Živanovi´c, S., McDonald, M. G., and Dang, H. V. (2016).“Characterising randomness in human actions on civil engineering structures.”34th Proc., IMAC, Springer, Berlin.
Živanovi´c, S., Pavic, A., and Reynolds, P. (2007).“Probability based pre-diction of multi-mode vibration response to walking excitation.”Eng. Struct., 29(6), 942–954.