Effect of
γ
-Phase Stability on Local Deformation Energy of
α
-
γ
Duplex Stainless Steel
*1Masayuki Yamamoto
1, Ryosuke Ochi
*2, Kyono Yasuda
*2, Masatoshi Aramaki
2, Shinji Munetoh
2and Osamu Furukimi
21Yamamoto Scientific Tool Lab. Co., Ltd., Funabashi 273–0018, Japan
2Department of Materials Science and Engineering, Kyushu University, Fukuoka 819–0395, Japan
The effect of austenite (γ) phase stability in the local deformation region on the deformation energy of ferrite (α)-γ duplex stainless steel is investigated using tensile testing. The uniform deformation energy values of both the γ-stable and unstable duplex stainless steels are simi-lar, while the local deformation energy of γ-stable duplex stainless steel is larger than that of γ-unstable duplex stainless steel. In γ-unstable duplex stainless steel, the difference in nano-indentation hardness between the α and transformed martensite (α) phases increases remarkably beneath the fractured surface. Low-voltage electron microscopy observations reveal that voids grow rapidly at the grain boundaries between the α and α phases beneath the fractured surface, resulting in a decrease in the local deformation energy in γ-unstable duplex stainless steel.
[doi:10.2320/matertrans.H-M2017826]
(Received March 6, 2017; Accepted June 28, 2017; Published August 18, 2017)
Keywords: duplex stainless steel, ductile fracture energy, nano-indentation hardness, void, phase stability, transformation-induced plasticity
1. Introduction
Ferrite (α)–austenite (γ) duplex stainless steel is widely used in chemical plants, precision machinery, and medical instruments owing to its excellent strength, ductility, and corrosion resistance. This material is broadly classified into
γ-unstable and γ-stable types. In the γ-unstable steel, trans-formation-induced plasticity (TRIP) occurs,1) where the γ
phase transforms into the martensite (α) phase; the γ-stable steel does not show TRIP behavior. Many studies have shown that the TRIP effect in γ-unstable steel causes greater total elongation and described the mechanisms involved. In 1975, Nakamura et al.2) revealed that the TRIP effect can be
used to increase total elongation in tensile tests.
Both uniform and local elongations contribute to the total elongation and these are controlled by different microstruc-tural behaviors. In the uniform elongation deformation re-gion, work hardening behavior is dominant that causes crys-tal slips and grain rotations prevails, along with dislocation increases and movements. In the local elongation deforma-tion region, work hardening continues, generating voids that grow in size as plastic deformation continues. When certain critical conditions are reached, the voids rapidly merge, re-sulting in fracture.
The mechanisms underlying the observed uniform defor-mation behavior have now been clarified theoretically and experimentally and discussed with respect to dislocation the-ory. Local deformation occurs under the complicated influ-ences of mechanical and microstructural factors including multiaxial stress after necking and deformability of the ma-trix structure, where the formation, growth, and connection of inner micro-voids are the fundamental processes causing deformation. The micro-void formation begins at second-ary-phase particles, such as nonmetallic inclusions and
pre-cipitates or crystal grain boundaries. Many studies have in-vestigated local deformation by considering voids in steel materials,3–5) void growth and connection models,6–8) and
numerical calculations based on fracture mechanics.9,10)
However, only a few studies discuss the relationship be-tween mechanical and microstructural factors.
As mentioned above, the mechanical and microstructural factors that control uniform elongation are completely dif-ferent to those controlling local elongation. However, many previous studies discuss the material properties using the to-tal elongation as an indicator. A study by Nakamura et al.2)
also discusses the TRIP effect with reference only to in-creasing total elongation. Therefore, it is not clear whether the TRIP phenomenon increases local elongation in duplex stainless steels. In order to identify the major factors con-trolling local elongation, it is proposed that it is necessary to consider both the mechanical properties and microstructure, observing the formation and growth of voids and elucidating the differences in work-hardening behavior between the two phases. Furthermore, it is essential to establish an experi-mental method for observing micro-voids and a microscopy method for evaluating work-hardening behavior in the re-spective phases of the two-phase structure.
Previously, the authors presented a method for detecting voids of the order of 0.1 micro meters using the secondary electron (SE) detector and angle-selective backscattered (AsB) electron detector of a low-voltage field emission scan-ning electron microscope (FE-SEM)3). In addition, we
demonstrated that nano-indentation testing is an effective tool for analyzing plastic deformation behavior of a micro-structure after tensile testing4,11).
In this paper, the authors report the results of testing two types of duplex stainless steel with different Ni contents that do not show the TRIP phenomenon in the uniform elonga-tion region. The above-menelonga-tioned experimental methods were used to investigate the effect of the TRIP phenomenon in the local elongation region under high strain on the for-mation and growth of voids and the elongation behavior.
Be-*1 This Paper was Originally Published in Japanese in J. Jpn. Soc. Heat
Treatment 56 (2016) 285–291.
*2 Graduate Student, Kyushu University, Fukuoka 819–0395, Japan
cause elongation is inversely correlated with strength, it is not an appropriate measure for evaluating the deformation properties of materials with different strengths. In a tensile test, dynamic characteristics appear according to the applied external force. Assuming that a test specimen is a single sys-tem, the first law of thermodynamics applies; therefore, the work (dW) done during tensile testing can be regarded as a physical quantity that influences the change in the internal energy (dU) of the system12). Generally, the input and output
of heat (dQ) can be ignored in standard tensile tests5);
there-fore, it is possible to obtain dU by determining dW. Hence, dU can be used to evaluate the deformation behavior of specimens with different strengths. For these reasons, this study does not use local elongation itself, but rather evalu-ates the local deformation energy or the dU value of the sys-tem in the local elongation region obtained from the stress-strain curves from tensile testing4,12,13).
2. Experimental Methods
2.1 Test materials
Two types of commercially available α-γ duplex stainless steel with different Ni contents were used here; one of these steels was γ-stable and the other γ-unstable in the local elon-gation region. The chemical compositions of these steels are shown in Table 1. Specimens for tensile testing were taken from the steel sheets in the direction parallel to the rolling direction. A plane perpendicular to the transverse direction of the base material was wet-ground with #2500 emery pa-per and then polished to a mirror finish using diamond paste and colloidal silica and then etched with aqua regia. Figure 1 shows the microstructures of treated specimens observed us-ing optical microscopy.
Next, electron backscatter diffraction (EBSD) images un-der an accelerating voltage of 15 kV were obtained for the
γ-stable duplex stainless steel using a Carl Zeiss Ultra55 FE-SEM. We confirmed using electron diffraction orientation imaging microscopy (OIM) that the white and gray phases shown in Fig. 1 corresponded to the α- and γ-phases, respec-tively, as shown in Fig. 2. The image shown in Fig. 2 (a) was taken with an optical microscope and shows part of the
Vickers indentation used as a marker on the left side. Fig-ures 2 (b) and (c) show the inverse pole figFig-ures (IPFs) of the area indicated in (a), corresponding to the α and γ phases, respectively. It was found that the white region corresponded to the α phase and the gray region to the γ phase; the ratio of the α phase to γ phase was 6:4 in the γ-stable steel and 7:3 in the γ-unstable steel.
2.2 Tensile testing
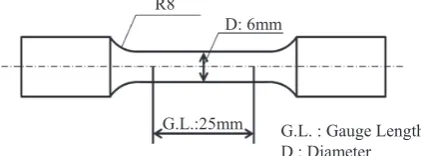
Cylindrical specimens 6 mm in diameter, as shown in Fig. 3, were prepared for tensile testing. The tensile tests were conducted with an initial strain velocity of 1.0 × 10⁻³ s−1 over three cycles. Gauge marks were made 25 mm
apart on the parallel portions of the specimens. The marked areas were imaged with a camera to record change in the displacements. From the tensile test, the 0.2% yield strength, tensile strength, uniform elongation, local elongation, and uniform and local deformation energies (as defined in Fig. 4) were determined.
2.3 Nano-indentation hardness tests
After the tensile tests, specimens for hardness testing were prepared, as shown in Fig. 5. The plane of the speci-men perpendicular to the fractured surface was embedded in resin, buffed, and polished with colloidal silica. Changes in the hardness (HIT) of the specimen as a function of distance
from the fractured surface were measured using an Elionix ENT-2100 nano-indentation tester under a test load of 9.81 mN. Figure 6 shows a schematic diagram of the
posi-Table 1 Chemical composition of duplex stainless steels tested (mass%) Steel A : γ-stable, Steel B : γ-unstable.
Steel C Si Mn Ni Cr Mo Al N
A 0.02 0.50 0.75 7.1 24.9 3.0 0.02 0.11
B 0.02 0.35 0.98 5.4 22.5 3.2 0.03 0.15
Fig. 1 Optical micrographs of (a) γ-stable and (b) γ-unstable steels tested.
Fig. 2 EBSD analysis results of γ-stable duplex stainless steel : (a) Opti-cal micrograph, (b) IPF image of bcc, (c) IPF image of fcc.
[image:2.595.306.549.441.640.2] [image:2.595.46.293.617.773.2] [image:2.595.320.531.692.770.2]tions on the sample at which hardness measurements were taken. Starting on a point about 100 μm from the fractured surface, measurements were taken at points on lines at inter-vals of 20 μm up to a point about 1.5 mm from the fractured surface, and then on lines at intervals of 500 μm. Five mea-surements were taken in the transverse direction of the spec-imen at intervals of 20 μm between test points on each line, and the average of the five measurements on each line was
compared to the specimen deformation. The deformation was defined as the true strain εx at a distance x from the
fractured surface, as shown by eq. (1) below:
εx=2 ln DD0 , (1)
where D0 is the initial diameter of the specimen (here,
6 mm) and D is the diameter at distance x where the hard-ness measurement was taken after the tensile test.
After the nano-indentation tests, an EBSD image of the specimen was obtained using a Hitachi High-Technologies SU6600 scanning electron microscope (SEM). The image data were analyzed with an orientation-imaging microscope (OIM) to identify the phases present at the indentation and determine the hardness values of the α and γ phases and their relationship with εx. Hardness measurements taken on the grain boundaries and on or around voids were excluded from the calculations.
2.4 Observations of voids
SEM specimens were prepared by cutting a cross-section-al test piece from the fractured sample using a micro-cutter. The plane perpendicular to the fractured surface was wet-ground sequentially using No. 150 to No. 2000 emery paper, and then buffed with alumina paste to a mirror finish. Next, the specimen was subjected to argon sputtering to remove any surface contamination and damaged layers (treatment time of 3 min; accelerating voltage of 4 kV; angle of inclina-tion of 80 ; rotainclina-tion speed of 25 rpm) using a Hitachi High-Technologies IM-3000 flat ion milling system. An AsB image of the specimen was obtained using a Carl Zeiss Ul-tra55 FE-SEM at an accelerating voltage of 5 kV to observe voids down to 0.1 μm in size. Image analysis was performed in order to quantify the number and area ratio of the voids using ImageJ software. In addition, an EBSD image was ob-tained at an accelerating voltage of 15 kV and the points of void initiation were analyzed using OIM.
3. Results
[image:3.595.75.261.197.343.2]3.1 Strength, elongation, and deformation energy
Figure 7 shows examples of stress–strain curves obtained
Fig. 4 Definition of uniform and local deformation energy obtained by stress-strain curve.
Fig. 5 Schematic diagram of the process of specimen preparation.
Fig. 6 Nano-indents positions for specimens after tensile test.
[image:3.595.49.296.397.486.2] [image:3.595.76.261.530.772.2] [image:3.595.325.529.601.758.2]from the tensile testing undertaken for three times per each steel. These results show that the γ-stable duplex stainless steel had a greater 0.2% proof stress and tensile strength than the γ-unstable steel. This was attributed to the fact that the γ-stable specimen used here had a harder γ phase (as discussed later with reference to Fig. 15) and a higher total fraction of γ phase. The total elongation was highest for the
γ-stable steel. Considering the uniform and local elongations separately, both of which were components of total elonga-tion, the γ-unstable steel had a greater uniform elongation and smaller local elongation than the γ-stable steel. The main purpose of this study was to clarify the effects of γ
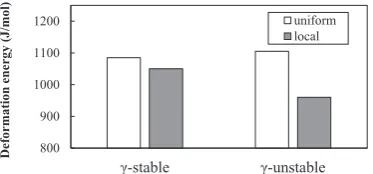
phase transformation in the local deformation area on the lo-cal deformation energy. Following is a discussion of the ex-perimental results from this perspective. Figure 8 shows ductile fracture energies determined from the measured stress–strain curves. The uniform deformation energy of both types of steel was almost equal, whereas the γ-stable steel showed about a 10% larger local deformation energy.
[image:4.595.76.263.506.593.2]3.2 Observations of voids
Figure 9 shows the relationship between εx and the per-centage area of voids, Sv, or the number of voids, Nv, per unit area (μm2). The void measurement area was 700 μm in
length and 30 μm in width for each εx value. Both the γ -sta-ble and γ-unstable steels showed an increase in the number of voids with increasing strain. The γ-unstable steel showed a sharp increase in Sv at εx immediately beneath the frac-tured surface, whereas the γ-stable steel showed only a slight increase. Next, the relationship between εx and aver-age void size (Sv/Nv) was calculated to observe the void growth behavior, as shown in Fig. 10. The γ-stable steel showed little void growth, even just before the fracture oc-curred, whereas the γ-unstable steel showed rapid void
growth immediately before fracture. The observed positions nearest to the fracture surface were drawn in the micro-graphs of longitudinally sectioned in Fig. 10 (see arrows). This analysis revealed that the void growth behavior differed significantly between γ-stable and γ-unstable steels.
3.3 Observations of voids using EBSD imaging
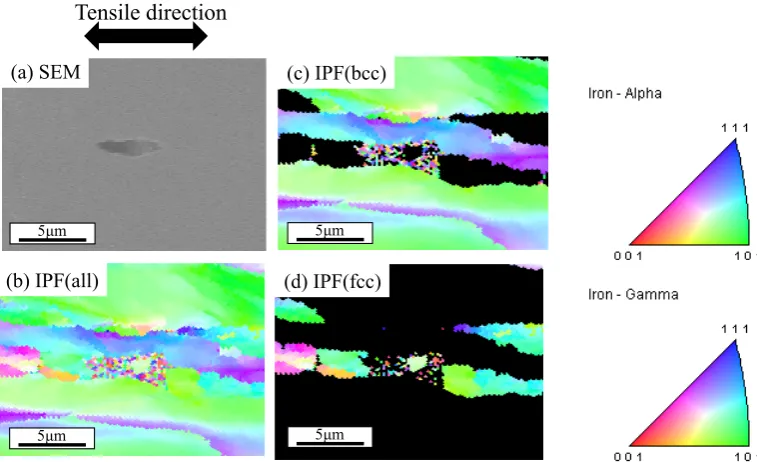
Figure 11 (a) to (d) show the results of the EBSD analysis of the cross-section of the γ-unstable steel at a low true strain of εx = 0.28. Figure 11 (a) shows an SEM image of the plane, (c) is the result of an EBSD analysis of the entire test region, and (b) and (d) are the results of extracting only bcc and fcc structures, respectively. hese results reveal that the voids were generated from the biphasic interface. After anal-ysis of the other fields of the microscope, it was found that 80% of the voids were created from the biphasic interface. Figure 12 shows the results of the same EBSD analysis of the cross-section of the γ-stable steel at a true strain of εx = 1.20. The results suggest that the voids were generated with-in the γ phase or from the γ grain boundary. The analysis of the other fields of the microscope confirmed that 90% of the voids were created within the γ phase or from the γ grain boundary.
3.4 Nano-indentation hardness
Figures 13 (a) and (b) show the nano-indentation hardness measurements of the γ-stable and γ-unstable duplex stain-less steels, respectively, after tensile testing. Both steels showed higher hardness values closer to the fractured sur-face. As commonly observed14), the γ phase showed a higher
work-hardening rate than the α phase. The data points showed as solid squares in this figure represent the hardness values of the α (martensite) phase. The γ-unstable steel showed higher hardness values than the γ-stable steel, which is attributed to the TRIP behavior of the γ phase when it transforms into the α phase at εx = 1.57. This phenomenon is discussed in more detail in the following section.
3.5 Strain-induced transformation
Figure 14 shows EBSD images of the specimens at a posi-tion 0.2 mm from the fractured surface where εx = 1.574).
Figure 14 (a), (b), and (c) show IPF images of both the fer-rite and austenite phases, only the ferfer-rite phase, and only the
Fig. 8 Uniform and local deformation energies obtained by stress-strain curves for γ-stable and γ-unstable duplex stainless steels.
[image:4.595.306.550.613.755.2]Fig. 9 Relationships between area of voids, number of voids per unit area and true strain for γ-stable and γ-unstable duplex stainless steels.
[image:4.595.62.274.645.762.2]austenite phase, respectively. In Fig. 14 (c), the areas sur-rounded by solid and dashed yellow lines represent a phase subject to twinning deformation and a phase with substantial noise, respectively. Investigating the orientation of the grain boundary in the area surrounded by the solid yellow line, it was found to have a ∑3 structure, which is proof of twinning deformation. The area indicated by the dashed yellow line was speculated to be strain-induced martensite. Figure 15 shows the pole figures of γ{111} and α{011} in the same area4). As the positions of the circled points were very
[image:5.595.107.489.70.301.2]simi-lar for both figures, it was confirmed that the γ{111} plane was parallel to the α{011} plane. Hence, it was confirmed that the area indicated by the dashed yellow line in Fig. 14 (c) underwent martensitic transformation. Therefore, it is
[image:5.595.108.487.344.575.2]Fig. 12 Voids nucleation behavior analysis at 1.20 of true strain for γ-stable duplex stainless steel by EBSD. Fig. 11 Voids nucleation behavior analysis at 0.28 of true strain for γ-unstable duplex stainless steel by EBSD.
[image:5.595.305.546.620.722.2]clear that the γ-unstable steel tested in this study showed TRIP phenomenon at high strain.
4. Discussion
4.1 Hardness ratio and void growth behavior
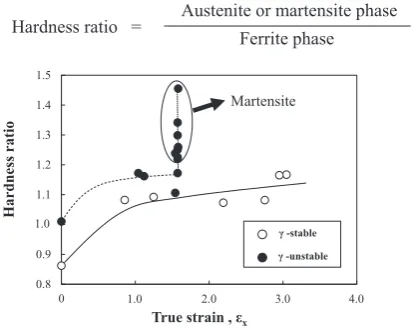
From the hardness relationship shown in Fig. 13, the hardness ratio of the α phase or strain-induced α phase to the γ phase was determined for γ-stable and γ-unstable steels, as shown in Fig. 16. The γ-stable steel showed a slight increase in the hardness ratio, whereas the γ-unstable steel showed a sharp increase in the hardness ratio near the fracture surface. Together with the results confirming the martensitic transformation (Figs. 14 and 15), these data sug-gest that TRIP behavior occurred in the high-strain region (immediately before fracture) where εx ≥ 1.5. This sharp in-crease in hardness ratio is thought to have caused the rapid growth of voids in the γ-unstable steel, as shown in Fig. 10.
4.2 Factors controlling local deformation energy
No significant difference in uniform deformation energy was observed between the γ-stable and γ-unstable steels; however, a larger local deformation energy was measured for the γ-stable steel, as shown in Fig. 8. Meanwhile, the work-hardening behavior in the γ and the α phases of the
[image:6.595.307.549.231.355.2]γ-stable and the γ-unstable steels was identical, irrespective of the uniform or local deformation region, as shown in Fig. 13. Hence, the two steels showed an equal change in in-ner ein-nergy attributable to the formation of dislocations during uniform and local deformation of the matrix phase during tensile tests. Accordingly, the difference in local de-formation energy between the two steels may be attributable to the different void growth processes. As shown in Fig. 10, the γ-stable steel showed extremely little void growth until close to fracture, whereas the γ-unstable steel showed gradu-al void growth starting at very smgradu-all εx values and reaching final fracture at a relatively low εx. Hence, the γ-unstable steel experienced rapid void growth, beginning in the low-strain region, resulting in low local deformation energy.
5. Conclusions
We studied the effects of γ-stability on deformation ener-gies determined from elongation and stress–strain curves
ob-tained during tensile testing, in the local deformation region where a high strain was applied, using γ-stable α-γ and
γ-unstable α-γ duplex stainless steels. The major conclu-sions are given below.
(1) In the local elongation region, the local deformation en-ergy of the γ-stable stainless steel was larger than that of the γ-unstable stainless steel, in which the γ phase trans-forms into the α phase.
(2) In the γ-unstable stainless steel, voids were generated mainly at the interface between the two phases. For the
γ-stable stainless steel, voids were generated within the
[image:6.595.322.530.407.571.2] [image:6.595.111.482.629.772.2]Fig. 16 Relationship between nano-indentation hardness ratio and true strain in tensile test for γ-stable and γ-unstable duplex stainless steels.
Fig. 13 Relationship between nano-indentation hardness and true strain in tensile test for (a) γ-stable and (b) γ-unstable duplex stainless steels. Fig. 15 Pole figures observed in area shown by the dashed-yellow line in
γ phase or at the γ grain boundary.
(3) The γ-stable stainless steel showed an extremely small amount of void growth up until a point close to fracture and rapid void growth immediately before fracture. Meanwhile, the γ-unstable stainless steel showed gradu-al void growth starting at low strain and rapid void growth immediately before fracture.
(4) In the γ-unstable steel, the creation of a strain-induced
α phase before the moment of fracture increased the hardness ratio of the two phases.
From these results, we reached the conclusion that, in order to increase the local deformation energy of α-γ
duplex stainless steel, it is important to ensure strain sta-bility in the local deformation region of the austenite phase.
Acknowledgements
We would like express our deep gratitude to Mr. Akihiko Takahashi and Mr. Masatomo Kawa at Nippon Steel & Sum-ikin Stainless Steel Corporation and to Mr. Makoto Oikawa at Nippon Yakin Kogyo Co., Ltd. for providing specimens and valuable discussions.
REFERENCES
1) V. F. Zackay, E. R. Parker, D. Fahr and R. Busch: Transactions of the ASM 60 (1967) 252.
2) T. Nakamura and K. Wasaka: Tetsu-to-Hagané 61 (1975) 2067.
3) O. Furukimi, S. Niigaki, N. Yamada, M. Aramaki, S. Oue and Y. Fu-nakawa: Tetsu-to-Hagané 99 (2013) 60.
4) M. Aramaki, S. Uchida, K. Yasuda, M. Oikawa and O. Furukimi: Tet-su-to-Hagané 100 (2014) 1261.
5) T. Hirashima, M. Aramaki, M. Yamamoto, K. Yasuda, S. Munetoh and O. Furukimi: Tetsu-to-Hagané 101 (2015) 308–314.
6) F.A. McClintock: J. Appl. Mech. 35 (1968) 353–371. 7) P.F. Thomason: J. Inst. Met. 96 (1968) 360–365.
8) T.B. Cox and J.R. Low: Metall. Trans. 5 (1974) 1457–1470.
9) X. Gao and J. Kim: Proceedings of the ASME International Mechani-cal Engineering Congress and Exposition, ASME, New York, (2005) 335.
10) T. Fukahori, M. Ohata, F. Minami, Y. Kayamori and T. Inoue: Tet-su-to-Hagané 94 (2008) 222.
11) S. Uchida, K. Yasuda, M. Aramaki and O. Furukimi: NETSU SHORI
52 (2012) 255–256.
12) M. Kato: Materia Japan 47 (2008) 317.
13) Y. Takeda, C. Kiattisaksri, M. Aramaki, S. Munetoh and O. Furukimi:
Tetsu-to-Hagané 102 (2016) 599.