INTRODUCTION
Medically refractory temporal lobe epilepsy (TLE) is a major seizure disor-der characterized by a unique pathology first described in 1880 as ‘hippocampal sclerosis’ or ‘Ammon’s horn sclerosis’. This is a distinct neuropathological con-dition characterized by hippocampal at-rophy, induration, distinctive neuronal loss, and astroglial proliferation (1,2) seen very prominently in area CA1 or the Sommer sector of the hippocampus.
A careful study of the pathology and electrophysiology of 151 hippocampi
re-moved in the Yale surgical series has been undertaken (3). This study revealed that about 60% of the hippocampi had Ammon’s horn sclerosis and were de-scribed as mesial temporal lobe epilepsy (MTLE). Another 28% was associated with an extrahippocampal mass lesion and did not show sclerosis; this condi-tion was described as mass associated temporal lobe epilepsy (MaTLE). A fur-ther 12% had no discernible pathology and their hippocampi also did not have sclerosis; a group described as paradoxi-cal TLE (PTLE).
Several lines of evidence point to the sclerotic hippocampus, rather than the amygdala or other temporal lobe regions, as the most likely place of origination and maintenance of chronic seizures in TLE patients (4). Intracranial EEG recordings have shown that the seizures in MTLE originate in the sclerotic hippocampus – severe neuronal loss (sclerosis) in the anterior hippocampus correlates with anterior focal onset, whereas sclerosis in both anterior and posterior hippocampus was associated with seizure onset from a wider area of the hippocampus (5). It has been argued that hippocampal sclerosis is merely a consequence of prolonged seizures. If this were the case, then all epilepsies in-volving the temporal lobe should be as-sociated with hippocampal sclerosis (6). However, PTLE and MaTLE are not
asso-Increased Release of Glutamate by Astrocytes
Address correspondence and reprint requests to Nihal C. de Lanerolle, Department of Neu-rosurgery FMB414, Yale University School of Medicine, 333 Cedar Street, New Haven, Con-necticut 06520-8082. Phone: 203-785-3258; Fax: 203-737-2159; E-mail: nihal.delanerolle@ yale.edu.
Submitted September 26, 2006; Accepted for publication December 7, 2006.
Tih-Shih Lee,
1Shrikant Mane,
2Tore Eid,
3,4Hongyu Zhao,
5Aiping Lin,
2Zhong Guan,
5,6Jung H Kim,
7Jeffrey Schweitzer,
8David King-Stevens,
9Peter Weber,
9Susan S Spencer,
10Dennis D Spencer,
3and Nihal C de Lanerolle
3Departments of 1Psychiatry, 2Keck Biotechnology Center,3Neurosurgery, 4Laboratory Medicine, 5Epidemiology and Public Health, 7
Pathology, and 10Neurology, Yale University School of Medicine; 6Department of Mathematical Sciences, Indiana University, South Bend, Indiana; 8Department of Neurosurgery, Kaiser Permanente Medical Center, Los Angeles, California;
9
Pacific Epilepsy Program, San Francisco, CA
Patients with temporal lobe epilepsy (TLE) often have a shrunken hippocampus that is known to be the location in which seizures originate. The role of the sclerotic hippocampus in the causation and maintenance of seizures in temporal lobe epilepsy (TLE) has remained incompletely understood despite extensive neuropathological investigations of this substrate. To gain new in-sights and develop new testable hypotheses on the role of sclerosis in the pathophysiology of TLE, the differential gene expres-sion profile was studied. To this end, DNA microarray analysis was used to compare gene expresexpres-sion profiles in sclerotic and non-sclerotic hippocampi surgically removed from TLE patients. Sclerotic hippocampi had transcriptional signatures that were different from non-sclerotic hippocampi. The differentially expressed gene set in sclerotic hippocampi revealed changes in sev-eral molecular signaling pathways, which included the increased expression of genes associated with astrocyte structure (glial fibrillary acidic protein, ezrin-moesin-radixin, palladin), calcium regulation (S100 calcium binding protein beta, chemokine (C-X-C motif) receptor 4) and blood-brain barrier function (Aquaaporin 4, Chemokine (C-C- motif) ligand 2, Chemokine (C-C- motif) lig-and 3, Plectin 1, intermediate filament binding protein 55kDa) lig-and inflammatory responses. Immunohistochemical localization studies show that there is altered distribution of the gene-associated proteins in astrocytes from sclerotic foci compared with non-sclerotic foci. It is hypothesized that the astrocytes in non-sclerotic tissue have activated molecular pathways that could lead to en-hanced release of glutamate by these cells. Such glutamate release may excite surrounding neurons and elicit seizure activity. Online address: http://www.molmed.org
ciated with hippocampal sclerosis. The clinical presentation of PTLE is virtually indistinguishable from MTLE but its focus of origin is yet unclear (3). Addi-tionally, hippocampal volume measure-ments by MRI as an indicator of sclerosis have shown that the degree of hip-pocampal atrophy is not correlated with the duration and severity of seizures (7). Hippocampal sclerosis was also reported to be absent in some patients with multi-ple daily seizures since infancy, again suggesting that seizures are not invari-ably a cause of sclerosis (8). A post-mortem study of hippocampi from pa-tients with poorly controlled seizures has confirmed a subgroup with absence of significant neuronal loss despite decades of seizures (9). Thus hippocampal sclero-sis appears to be a distinctive pathologi-cal entity that is correlated with and pos-sibly causally related to MTLE.
Strong evidence for the role of the scle-rotic hippocampus in the maintenance of seizures comes from the success of resec-tive surgery for the control of intractable epilepsy. Surgical removal of the sclerotic hippocampus, rather than adjacent re-gions, results in the best seizure free out-come (evidence reviewed in 10). In a more recent seven-center prospective ob-servational study of resective epilepsy surgery, the authors examined the proba-bility and predictors of patients entering two-year remission. They observed that about 70% of patients with medial tem-poral resections experienced two-year re-mission and found that only a history of absence of tonic-clonic seizures and the presence of hippocampal atrophy, were sig-nificantly and independently associated with remission (11).
Despite the above evidence, there is continuing debate as to the relationship of hippocampal sclerosis to the causation and maintenance of seizures in temporal lobe epilepsy. This debate has continued in the absence, until recently, of much in-formation on the role of astrocytes in the pathology of disease or the organization and function of the sclerotic substrate. Astrocytes in sclerotic regions of the hip-pocampus have many unique properties,
and may contribute to the hyperexcitabil-ity of the hippocampal seizure focus. The astrocytes have an increase in Na+ chan-nels on their membranes, a more depo-larized resting membrane potential, and a reduction of inward rectifying potas-sium (Kir) channel function (12,13); have an elevated flip-to-flop mRNA ratio of GluR1 that make them more responsive to glutamate (14); have a significant down regulation of the enzyme gluta-mine synthetase (15); and show in-creased expression of the transcription factor Nuclear Factor kappa B (NFκB), which is thought to play a crucial role in many acute inflammatory reactions (16). This paper further explores the molec-ular organization of the sclerotic sub-strate in TLE and proposes the hypothe-sis that the molecular changes in astrocytes from sclerotic hippocampi are associated with calcium dependent glu-tamate release into the extracellular space, and that several important initial precipitating events in the causation of TLE may activate this mechanism.
MATERIALS AND METHODS
Samples, Extract Preparation, and Labeling
The hippocampi used in this study were surgically removed from patients with medically intractable TLE who un-derwent anteromedial temporal lobec-tomy with hippocampeclobec-tomy for seizure control, by procedures previously de-scribed (17). Tissue used in these studies was obtained after informed consent and with approval of the human investiga-tions committees (HIC) of participating institutions. The patient characteristics are shown in Table 1. Twenty hippocam-pal specimens were subcategorized into mesial temporal lobe epilepsy with scle-rosis (MTLE, n = 8), paradoxical tempo-ral lobe epilepsy (PTLE, n = 6), mass as-sociated temporal lobe epilepsy (MaTLE, n = 6); the latter two groups had no scle-rosis. In the MaTLE patients used in this study, the mass lesion was outside the hippocampus. Subcategorization (3) was done on adjacent tissue sections from
each patient that were immunostained for neuropeptides (18) and on which neuronal counts were performed (19).
Hippocampal tissue slices, 5 mm or less in thickness, were collected in RNAlater (Ambion, Austin, TX) within 30 min of surgical removal of the hip-pocampus and stored overnight at 4° C to allow for penetration of the RNAlater, then frozen on dry ice and stored at –80° C. RNAlater has been shown to preserve RNA in tissue samples at least as well, if not better than, rapid freezing in liquid nitrogen (20).
The hippocampus was microdissected into subregions and total RNA extracted from the CA1 subregion using the RNeasy kit for lipid tissue (Qiagen, Valencia, CA.). The quality of the RNA was assessed by the Agilent Bioanalyzer (Agilent Technologies, Palo Alto, CA.) to visually verify the absence of genomic DNA contamination and integrity of 28S and 18S bands. The CA1 region was chosen, as this region, known as the Sommer sector (2), characterizes the sclerotic hippocampus.
The preparation of labeled cRNA and the subsequent hybridization to human U133A arrays was performed following guidelines provided by the Affymetrix Resource facility at Yale University (http://keck.med.yale.edu/affymetrix). The U133A chip was chosen as it con-tained all the well-characterized genes at the time. Patient RNA was not pooled for this study. The RNA from each patient was profiled on a separate GeneChip.
Measurement of Data and Analytical Tools
The hybridized arrays were scanned using a confocal laser fluorescence scan-ner (Affymetrix GeneChip Scanscan-ner 3000). The two-way ANOVA model was applied to identify differentially expressed genes using the PM-only model-based expres-sion values obtained from dChip, which implements the Li-Wong model (21).
To look at the relatedness of patient gene expression profiles, Multidimen-sional Scaling (22) analysis was con-ducted on representations of the
expres-sion of all 22,215 probe sets (14,500 genes). This approach projects the high-dimensional gene expression data onto two viewable lower dimensions. In this approach the distance between data points provides a measure of their differ-ences. Another unsupervised hierarchical cluster analysis using Pearson correlation to measure the similarity of expression between samples (23,24) was also carried out on the microarray data set.
To study hippocampal sclerosis in MTLE, the non-sclerotic PTLE and MaTLE hippocampi were used for the comparison. The PTLE and MaTLE sam-ples were used as they closely resembled the normal hippocampus in anatomy, their exposure profile to antiepileptic drugs was similar to the MTLE samples (Table 1) and they were subjected to the same surgical manipulations in removal. Further, while the MTLE hippocampus is
an epileptogenic focus, the hippocampus of MaTLE and PTLE are not. Evidence in support of this comes from electrophysio-logical investigation of dentate granule cell excitability, which shows that the MTLE granule cells are hyperexcitable while those in MaTLE and PTLE are not (25). A study of the long term surgical outcome of patients with temporal lobe tumoral epilepsy (MaTLE) showed signif-icant post operative seizure freedom was related only to gross complete tumor re-section and unrelated to its pathology (26). This, too, suggests that in MaTLE the hippocampus itself is non-epileptogenic. The poor seizure free outcome (44%) in PTLE following hippocampectomy sug-gests that the hippocampus is unlikely to be epileptogenic in this group as well (3). Hippocampal tissue from autopsies of “neurologically normal’ subjects was not used as a comparison or “control” group
for this study as this tissue is subject to longer and variable post-mortem delay before tissue harvest, uncertain periago-nal conditions, and other variable factors, which are shown themselves to influence gene expression patterns (27). Autopsy specimens also lack exposure to AEDs and anesthetics or exposure to seizure ac-tivity that surgical tissue has. Thus they are not a good tissue source for control-ling the experimental variables in an ex-periment with surgically obtained tissue from epileptic patients.
Biological Pathways Analytical Tools An extensive literature search has to be done to establish the functional roles, in-teractions, and relationships between the differentially expressed genes,. This is considerably assisted by proprietary soft-ware, of which we chose Ingenuity Path-ways Analysis (Ingenuity Systems, Mountain View, CA). The Ingenuity Pathways Knowledge Base is the largest curated database of previously published findings on mammalian biology from the public literature (www.ingenuity.com). The Ingenuity Knowledge Base com-prises a genomic database of over 10,000 human genes that were manually cu-rated by reviewing over 200,000 full-text scientific articles supplemented with cu-rated information parsed from MED-LINE abstracts. In addition, the database comprises biological networks created from millions of individually modeled relationships derived from findings re-ported in peer-reviewed scientific publi-cations and constantly updated. Content and modeling experts systematically en-coded these findings to derive binding relationships, post-translational modifi-cations, expression regulation, transport, and other types of interaction. Hence, a molecular network of direct, physical, transcriptional, and enzymatic interac-tions between orthologues with high connectivity can be computed using this knowledge base. Each gene interaction in the biological network is supported by annotated literature (28)
From data generated by the ANOVA analysis, the added criteria of false dis-Table 1. Clinical Features Related to Patient Tissue Used in Microarray Analysis
Patient Age at Age at
ID TYPE M/F first seizure surgery Pathology
IH575 MTLE M 11 51 Hippocampal Sclerosis
IH648 MTLE F 9 32 Hippocampal Sclerosis
IH672 MTLE F 8 61 Hippocampal Sclerosis
IH693 MTLE F 4 34 Hippocampal Sclerosis
IH708 MTLE M 8 27 Hippocampal Sclerosis
LA7 MTLE F 8 52 Hippocampal Sclerosis
LA11 MTLE M 0.5 36,5 Hippocampal Sclerosis
LA15 MTLE M 5 35 Hippocampal Sclerosis
IH677 MaTLE M 63 64 Oligodendroglioma
IH688 MaTLE M 15 17 Mixed glioma, low grade
IH280 MaTLE M 22 36 Heterotopia, Neuronal clustering.
Hippocampus no cell loss.
IH689 MaTLE M 0.008 11 Cerebral tissue with remote ischemic
changes (cystic infarct) and reactive gliosis. Hippocampus no neuronal loss
IH682 MaTLE F 0.014 6 Hippocampus no neuron loss. Cerebral
cortex showing partial atrophy and focal absence, neuronal loss, and gliosis.
IH687 PTLE M 0.75 5 No hippocampal sclerosis. Cortex and
white
matter with no significant histopathology.
IH671 PTLE F 38 47 Hippocampus with mild white matter gliosis,
no detectable neuronal loss.
IH453 PTLE F 4 46 No significant neuronal loss in hippocampus.
IH653 PTLE F 8 38 No significant neuronal loss in hippocampus.
IH707 PTLE M 24 27 No significant neuronal loss in hippocampus
SF6 PTLE M 8 24 No significant neuronal loss in hippocampus
covery rate (FDR) of < 0.05, and fold-change cut-off of 1.5 were used. Because the brain is histologically heterogeneous, with often small numbers of different cell types, gene expression levels may not al-ways be large, and it has been proposed that a 1.5 fold change is reasonable to use (29,30). Each gene identifier was mapped to its corresponding gene object in the In-genuity Pathways Knowledge Base. These genes, called focus genes, were then used as the starting point for generating biolog-ical networks. These genes were overlaid onto a global molecular network devel-oped from the information contained in the Ingenuity Pathways Knowledge Base. Networks of these focus genes were then algorithmically generated based on their connectivity and interactions. Ingenuity Pathway Analysis then computed a score for each network according to the fit of the set of the significant genes, which was derived from a P value and indicates the likelihood of the focus genes in a network being found together due to random chance. Only networks with at least a 99% confidence of not being generated by ran-dom chance alone were used for this study.
In addition, Ingenuity Pathways Anal-ysis can generate Global Canonical Path-ways, which associates genes from the dataset file with pathways of known metabolic and signaling pathways to ex-amine their role in the context of these pathways. The significance values (P val-ues) are measures for the likelihood that genes from the dataset file under investi-gation participate in that function and are calculated using the right-tailed Fisher’s Exact Test by comparing the number of genes from the dataset that participate in a given function or pathway, relative to the total number of occurrences of these genes in all functional/pathway annota-tions stored in the Ingenuity Pathways Knowledge Base. The significance of the association between the data set and the canonical pathway was measured in two ways: 1. The ratio of the number of genes from the data set that map to the path-way divided by the total number of genes that map to that canonical
path-way; 2. Fisher’s exact test was used to calculate a P value determining the prob-ability that the association between the genes in the dataset and the canonical pathway is explained by chance alone.
Validation of Microarray Data by Quantitative RT- PCR (QRT-PCR)
QRT-PCR was performed on five genes along with a housekeeping gene, β-actin or Glyceraldehyde-3-phosphate dehydro-genase (GAPDH), for each sample as a means of validating the microarray data. The genes were chosen on the basis of previous reports of their presence in as-trocytes. Each QRT-PCR reaction was per-formed with RNA from the same prepa-ration used for the microarray analysis. Total RNA (2 μg) from each sample was subjected to reverse transcription using High Capacity cDNA Archive Kit (Ap-plied Biosystems, Foster City, CA). QRT-PCR analysis was performed using ABI 7900 Sequence Detection System using Assays-on-Demand products for AQP4, CD44, CXCR4, GFAP, and PLEC1. All re-actions were performed in triplicate in 15 μL final volumes. The following PCR conditions were used: 50° C for 2 min, then 95° C for 10 min, followed by 40 cy-cles at 95° C/0.15 min and 60° C /1 min. Standard curve was generated for each gene using cDNA obtained by pooling equal amounts from each sample. The ex-pression level of target genes was nor-malized to internal β-actin or GAPDH. Data was analyzed using Microsoft Excel following ABI instructions, and
calcu-lated using the relative standard curve method (ABI, User Bulletin #2).
Immunohistochemistry
An approximately 3 mm thick slice of tissue adjacent to the one used for DNA microarray studies was fixed by immer-sion in a 4% paraformaldehyde solution in phosphate buffer (pH 7.4) for 6–8 h Vi-bratome sections (50 μm thick) were im-munostained according to the Avidin-Bi-otin Complex method (31) with primary antibodies against AQP4 (1:10,000, Chemicon, Temecula, CA), DMN (1:5000, Novocastra, Newcastle, UK), CD44 (1:500, RDI, Flanders, NJ), PLEC1 (1:500, BD Transduction Laboratories) and CXCR4 (1:1000, ProSci Inc., Poway, CA) using procedures previously described (18).
RESULTS
Patient Characteristics
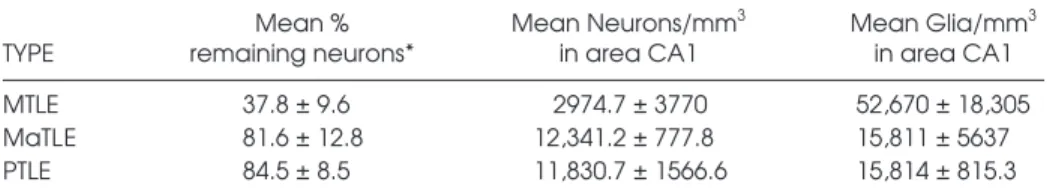
The types of the hippocampal speci-mens used in this study were identified on the basis of immunohistochemistry for neuropeptides and neuronal density as-sessments (3). The MTLE specimens (n = 8) all had hippocampal sclerosis, i.e. sig-nificant neuronal loss with accompanying gliosis in area CA1 (Table 1). None of the MaTLE (n = 6) or PTLE (n = 6) specimens showed hippocampal sclerosis. The MTLE specimens had about a four-fold loss in neurons and a three-fold increase in glia in area CA1 compared with the MaTLE and PTLE specimens (Table 2). The MaTLE pa-tients had an extrahippocampal temporal
Table 2. Neuronal and Glial Counts in Surgically Removed Hippocampi used in this Study
Mean % Mean Neurons/mm3 Mean Glia/mm3
TYPE remaining neurons* in area CA1 in area CA1
MTLE 37.8 ± 9.6 2974.7 ± 3770 52,670 ± 18,305
MaTLE 81.6 ± 12.8 12,341.2 ± 777.8 15,811 ± 5637
PTLE 84.5 ± 8.5 11,830.7 ± 1566.6 15,814 ± 815.3
*The percentage is the neuronal density across all subregions of the hippocampus in a particular hippocampal type compared with the neuronal density in 20 neurologically normal autopsy controls. The neuron and glial density were estimated from sections adjacent to those used for microarray analysis. In all groups MTLE were significantly different from either MaTLE or PTLE, whereas the latter two groups were not significantly different from each other (Mann Whitney U test, two tail, at P ≤ 0.05).
mass lesion, whereas the PTLE had no dis-cernible pathology or identifiable etiology (Table 1). These features correspond to the previously described pathology for larger samples of similar specimens (3).
Whereas there was a spread in the age of patients at the time of surgery, they were similar across the three groups (mean ± SD, MTLE 41.0 ± 11.9, MaTLE 26.2 ± 23, PTLE 31.1 ± 16, Table 1). The age at the first unprovoked seizure in MTLE was significantly younger (mean ± SD, 6.7 ± 3.3 years) than in either MaTLE (20 ± 25 years) or PTLE (13.8 ± 14.3 years); the age in the latter two groups being similar. The number of years to surgery (age at sur-gery minus age at first seizure) also showed differences. This period was similar in the MTLE (34.3 ± 11 years) and PTLE (17.3 ± 15.6 years) groups and significantly (Mann-Whitney U, two tailed, P ≤ 0.05) longer than in the MaTLE group (6.4 ± 5.5 years), and was consistent with previous observa-tions on larger patient populaobserva-tions (3). All of the patients in this study had seizures that were uncontrolled by antiepileptic medications (AEDs). Ex-amination of the lists of AEDs being used at the time of surgery or in AED use history showed no obvious differ-ence between patient groups.
Patient Categorization by Gene Expression Patterns
One objective of this study was to de-termine if there were distinct molecular signatures in the transcriptional profiles of the different hippocampal samples studied. To this end, two approaches, with somewhat different underlying mathematical assumptions, were adopted. Multidimensional scaling, an unsupervised method of data reduction, was conducted on the representations of the expression of all the genes (22,215 probe sets representing 14,500 genes) and demonstrated that gene expression pro-files of the eight MTLE hippocampi with sclerosis were grouped together and sep-arable from the other hippocampi with-out sclerosis (data not shown).
Unsupervised hierarchical cluster analysis was also performed on all sam-ples. This unbiased approach also orga-nized the hippocampal specimens into two major groups. The MTLE hip-pocampi formed one tight cluster while
the non-sclerotic hippocampi (MaTLE, PTLE) formed another group (P = 0.000002, Fisher Exact test). The hip-pocampal transcriptional profile of the MaTLE and PTLE patients were not dis-tinguishable from each other, at least not Figure 1.The comparison of the gene expression patterns in 20 hippocampi from patients with TLE. The dendrogram was obtained by unsupervised hierarchical cluster analysis using Gene Spring software. The analysis included all genes expressed in a microarray analysis using the Affymetrix GeneChip U133A. It shows a primary branching pattern, which separates the sclerotic MTLE (dark green) hippocampi as one cluster. The PTLE (blue) and MaTLE (Red), both being non-sclerotic hippocampi, form a separate group. On the dendrogram, each horizontal color bar denotes the intensity of expression of a particular gene relative to the mean expression value of all samples. The color codes are shown in the color bar where green represents transcript levels below the median and red represents transcript levels above. Yellow is at median. The more intense the color, the greater the level of trust it represents. MTLE = mesial temporal lobe epilepsy; MaTLE = mass associated temporal lobe epilepsy; PTLE = paradoxical temporal lobe epilepsy.
from the number of samples used in our study (Figure 1).
Reproducibility and Distinctiveness of Transcription Profile in Sclerotic (MTLE) Hippocampi
A second objective of our analysis was to identify the population of genes whose expression was uniquely changed in the MTLE hippocampi. The assess-ment by ANOVA was used to discover genes that were differentially expressed across MTLE, PTLE, and MaTLE. The mean of the expression of each transcript in the eight MTLE hippocampi was com-pared with the mean expressions of the six PTLE and the mean expression of the six MaTLE hippocampi separately, gen-erating two sets of comparisons (MTLE vs. PTLE, and MTLE vs. MaTLE). Only the gene transcripts that were differen-tially expressed in both comparisons were listed as significant genes for fur-ther evaluation, based on a false discov-ery rate (FDR) cut-off at < 0.05. The FDR is a multiple-hypothesis testing error measure, and is the expected proportion of false positive findings among all the rejected hypotheses (32). It is more ap-propriate to control for false positive re-sults than the Bonferroni correction. Using the fold-change convention, we found 149 gene transcripts that were changed two-fold and greater in either direction for both comparisons – MTLE vs. PTLE and MTLE vs. MaTLE. Of these, 67 were up-regulated and 82 were down-regulated. If the fold change crite-ria were expanded to include 1.5-fold and greater, then there were a total of 674 gene transcripts, of which 366 were up-regulated and 308 were down-up-regulated. (The complete list of genes is given in supplement 1, available on the Molecular Medicine Website (www.molmed.org).)
We also conducted a separate analysis whereby MaTLE and PTLE were consid-ered replicates of non-sclerotic hip-pocampi. This comparison of sclerotic vs. non-sclerotic specimens showed 138 genes changed two-fold (76 up-regulated and 66 down-regulated), while 947 genes were changed 1.5-fold or more (535
up-regulated and 412 down-up-regulated). (The complete list of genes is found in supple-ment two, available on the Molecular Medicine Website (www.molmed.org).)
To assess the degree of variability in transcription patterns between individ-ual MTLE specimens, correlation coeffi-cients were calculated. The correlations ranged from 0.95 to 0.98, and demon-strated a high degree of similarity be-tween MTLE replicates (33).
Identity of Genes Expressed in MTLE Specimens
One of the challenges in DNA microar-ray analyses is to find biological meaning in the lists of differentially expressed genes. To facilitate this process, several approaches were adopted. In one ap-proach the list of genes and ESTs show-ing changes in expression of 1.5- fold and above in either direction was submitted to Ingenuity Pathway Analysis Software to identify the genes and ESTs belonging to canonical pathways. Among the genes associated with major canonical path-ways, those involved in glutamate and GABA receptor signaling were down-regulated. Likewise a number of genes associated with G-protein-coupled recep-tor signaling were also down-regulated. Such reductions were not surprising in light of the anatomical observations of reduced neuronal populations in the CA1 area of the MTLE hippocampi. In contrast, many genes associated with im-mune and inflammatory functions showed increased expression. Among these were those associated with antigen presenting pathways, chemokine signal-ing, and interleukin signaling pathways (Table 3).
In another approach, the list of genes that were differentially expressed in MTLE were queried using Ingenuity Pathway Analysis Software to discover biological networks and pathways that may link genes and ESTs on the basis of known functional or structural relation-ships. Through such an analysis, several interesting observations were made in re-gards to the genes showing changed ex-pression in the MTLE hippocampi.
Among the several networks of interre-lated genes discerned by Ingenuity soft-ware, was one of special interest (Figure 2). In this network, several of the up-reg-ulated genes were those associated with astrocytes (Figure 2). These included GFAP, CD44, PSEN1, VIL2, RDX, MSN, PLEC1, TNC, CSPG2, S100A6, S100B, AHNAK, and KIAA0992, CRYAB, CAPN3, CAPN2, and TTN. In addition to those in this network, there were other genes associated with astrocytes such as ARHGAP5, GSN (Gelsolin), AQP4, DMN (Desmuslin), and DTNA (Dystrobrevin alpha) which were also up-regulated, and FBXW7, which was down-regulated.
A group of immune and inflammatory response genes was also up-regulated. These genes included chemokines and their receptors (CCL2, CCL3, CCL4, CXCR4), cytokines and their receptors (FGF1, FGF2, FGF13, TNFSF7), signal transduction proteins (CALM1, CALM3, PPP3CA, PPP3R1, PTPRD, PTPRG, PTPRN, PTPRO), transcription factors (FKBP1B, FKPB1A) and transcription fac-tor-related genes (AGT, COL1A1, COL21A1, NCAM1, VCAM1, CD44, IL11RA, IL13RA, IL15). Other genes as-sociated with immune response were TNC, ID3, MOG, ITPKB, HLA-E, FGF1, HLA-DRB1, HLA-DRA, C3, C4, PMP2, CLESF12, CD74, and TYROBP.
In addition to the glutamate and GABA receptor signaling pathway genes that were down-regulated, some of the other genes whose expression were down-regulated also seem to be related to neuronal loss in CA1. These included, for example, synaptic vesicle cycle asso-ciated genes (34) SNAP 25, SYN1, RAB3A, RAB 6A, and RAB15. However, a few presumed synaptic vesicle associ-ated genes were up-regulassoci-ated (SYN 16, SNAP 23, HSP70, HSP40).
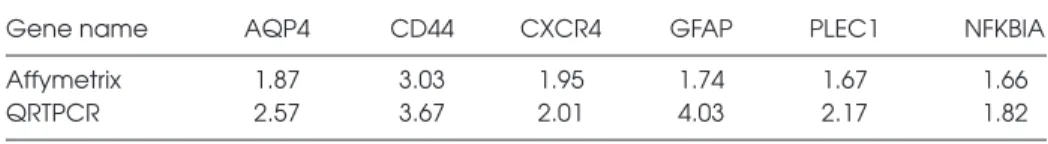
Validation of Candidate Genes A small number of genes that were dif-ferentially expressed in microarray anal-ysis were chosen for validation by QRT-PCR and comparison to microarray data. They were AQP4, CXCR4, CD44, PLEC1, GFAP, and NKKBIA. QRT-PCR
con-firmed the changes observed by microar-ray expression analysis, and suggested that microarray analysis tended to un-derestimate expression levels (Table 4).
Immunohistochemical localization val-idated the expression of the correspon-ding proteins of GFAP, DMD, AQP4,
PLEC1, CD44, and CXCR4 in tissue sec-tions of the hippocampus (Figure 3). GFAP, AQP4, DMD, CD44, and PLEC1 proteins were localized in astrocytes, whereas CXCR4 was predominantly lo-calized in microglia and a small popula-tion of astrocytes. The localizapopula-tion of
these molecules showed different pat-terns in the sclerotic and non-sclerotic hippocampi in preliminary immunohis-tochemical studies. The localization of AQP4 (Figure 3A & B) and dystrophin (DMD) (Figure 3C&D) was as described previously on astrocyte end feet. In Table 3. List of genes up or down-regulated 1.5 fold in the 12 most significant canonical pathways according to Ingenuity Pathways Analysis
Canonical Pathways Up-regulated Genes Down-regulated Genes
Glutamate Receptor Signaling CALM3, DLG4, GRIA1, GRIA2, GRIA3, GRIN1, GRM5,
HOMER1, SLC1747
GABA Receptor Signaling DNM1, GABRA2, GABRA5, GABRB3, GABRG2, GPR51, NSF
Antigen Presenting Pathway CD74, HLA-DPA1, HLA-DQA1,
HLA-DRA, HLA-DRB1, HLA-DRB3, HLA-E
G-protein-coupled Receptor Signaling NFKBIA DUSP4, DUSP6, GRM5, HTR2A, MAPK1, PDE2A, PLCB1,
PRKAR2B, PRKCB1, PTK2B, RGS2, RGS4, RGS7
Chemokine signaling CCL2, CXCR4, CALM3, MAPK1, PLCB1, PRKCB1, PTK2B
Glycosphingolipid Metabolism GAL3ST1, GALC, PPAP2C, UGT8 SMPD3
Prostaglandin and Leukotriene AKR1C3, CYP4F3, PRDX6, PTGDS PTGS2, YWHAZ
Metabolism
Amyloid Processing CAPN2, PSEN1 MAPK1, PRKAR2B
Integrin Signaling ARHGAP5, CAPN2, COL1A1, ACTN1, ARF3, MAP2K4, MAPK1, PAK3
ITGB4, LAMA4, RHOQ
Purine Metabolism ADCY7, AK1, ATP6V0E, ENPP2, AK5, ATP6V1G2, DLG3, DLG4, PDE2A
GMPR, PDE8A, TJP2
IL Signaling COL1A1, NFKBIA MAP2K4, MAPK1, PTK2B
Apoptosis Signaling CAPN2, NFKBIA MAP2K4, MAPK1
Abbreviations: ACTN1, Actinin α 1; ADCY7, Adenyl cyclase 7; AK1, Adenylate kinase 1; AK5, Adenyl kinase 5; AKR1C3, Ado-keto reductase family 1, member C3; ARF3, ADP-ribosylation factor 3; ARHGAP5, Rho GTPase activating protein 5; ATP6V0E, ATPase, H + transporting, lysosomal V0 subunit E; ATP6V1G2, ATPase, H + transporting, lysosomal 13kDa, V1 subunit G isoform 2; CALM3, Calmodulin 3 (phosphorylase kinase, delta); CAPN2, Calpain 2; CCL2, Chemokine (C-C motif) ligand 2; CD74, CD74 antigen (invariant polypeptide of MHLA, class II antigen-associated); COL1A1, Collagen α 1(I) chain precursor; CXCR4, Chemokine (C-X-C motif) receptor 4; CYP4F3, Cytochrome P450, family 4, subfamily F, polypeptide 3; DLG3, Discs, large homolog 3 (neuroendocrine-dlg, Drosophila); DLG4, Discs, large homolog 4 (Drosophila); DNM1, Dynamin 1; DUSP4, Dual specificity phosphatase 4; ENPP2, Ectonucleotide pyrophosphatase/phosphodiesterase 2; GABRA2, γ-aminobutyric acid (GABA) A receptor, α 2; GABRA5, γ-aminobutyric acid (GABA) A receptor, α 5; GABRB3, γ-aminobutyric acid (GABA) A receptor, β 3; GABRG2, γ-aminobutyric acid (GABA) A receptor, γ 2; GALC, Galactosylceramidase; GAL3ST1, Galactose-3-O-sulfotransferase 1; GMPR, Guanosine monophosphate reductase; GPR51, G protein-coupled receptor 51; GRIA1, Glutamate receptor, ionotropic, AMPA 1; GRIA3, Glutamate receptor, ionotropic, AMPA 3; GRIN1, Glutamate receptor, ionotropic, N-methyl D-aspartate 1; GRM5, Glutamate receptor, metabotropic 5; HLA-DPA1, Major histocompatibility complex, class II, DP α 1; HLA-DQA1, Major
histocompatibility complex, class II, DQ α 1; HLA-DRA, Major histocompatibility complex, class II, DR alpha; HLA-DRB1, Major
histocompatibility complex, class II, DP α 1; HLA-DRB3, Major histocompatibility complex, class II, DP α 3; HLA-E, Major histocompatibility complex, class I, E; HOMER1, Homer homolog 1 (Drosophila); HTR2A, 5-hydroxytryptamine (serotonin) receptor 2A; ITGB4, Integrin β 4; LAMA4, Laminin, α 4; MAP2K4, Mitogen-activated protein kinase kinase 4; MAPK1, Mitogen-activated protein kinase 1; NFKBIA, Nuclear factor kappa light polypeptide gene enhancer in B-cells inhibitor, alpha; NSF, N-ethylmaleimide-sensitive factor; PAK3, p21 (CDKN1A)-activated kinase 3; PDE2A, Phosphodiesterase 2A, cGMP-stimulated; PDE8A, Phosphodiesterase 8A; PLCB1, Phospholipase C, β 1 (phosphoinositide-specific); PPAP2C, Phosphatidic acid phosphatase type 2C; PRDX6, Peroxiredoxin 6; PRKAR2B, Protein kinase, cAMP-dependent, regulatory, type II, beta; PRKCB1, Protein kinase C, β 1; PSEN1, Presenilin 1 (Alzheimer disease 3); PTGDS, Prostaglandin D2 synthase; PTGS2, Prostaglandin-endoperoxide synthase 2 (prostaglandin G/H synthase and cyclooxygenase); PTK2B, Protein tyrosine kinase 2 beta; RGS2, Regulator of G-protein signaling 2, 24kDa; RGS4, Regulator of G-protein signaling 4; RGS7, Regulator of G-protein signaling 7; RHOQ, Ras homolog gene family, member Q; SLC1747, Solute carrier family 14 (urea transporter), member 1 (Kidd blood group); SMPD3, Sphingomyelin phosphodiesterase 3, neutral membrane (neutral sphingomyelinase II); TJP2, Tight junction protein 2; UGT8, UDP
MTLE AQP 4 expression was increased on the end feet while DMD was de-creased (35,36). In the non-sclerotic hip-pocampi, CD44 was localized in fine fiber-like extensions, which had globular profiles along their length and often ended in cone-like structures. These processes extended into the CA1 pyram-idal cell body region from the stratum oriens border. Intermingled among them were immunoreactive astrocytes, whose processes also extended for 100 μm or greater distances within the pyramidal layer (Figure 3E). It was difficult, only on the basis of the light microscopic ap-pearances of these processes to deter-mine definitively whether they were ex-clusively astrocyte extensions or some were axonal processes. In the sclerotic CA1 region, CD44 immunoreactivity was seen very easily to be throughout the astrocytes and their processes and their perivascular staining strongly out-lined the microvasculature (Figure 3F). The astrocytes formed an intricate net-work. Elongated fiber-like processes seen in the non-sclerotic specimens were not seen in sclerotic regions of CA1. PLEC1, which was only weakly ex-pressed in astrocytes in the non-sclerotic CA1 region, was more strongly ex-pressed in the astrocytes and their perivascular endfeet in the sclerotic hippocampus (Figure 3G&H). CXCR4 immunoreactivity, which was barely de-tectable in the CA1 region of the non-sclerotic hippocampus, was prominent in microglia and a small population of astrocytes in the sclerotic hippocampus (Figure 3 I&J).
DISCUSSION
Gene Expression and Astrocytes The identification of a set of genes showing differential expression only in the MTLE hippocampi opens the door to unraveling more fully the molecular mechanisms underlying hippocampal sclerosis. Area CA1 of the MTLE hip-pocampus differs in its cellular composi-tion from the MaTLE and PTLE hip-pocampi in distinct ways. The MTLE Figure 2. A pathway diagram developed using the Ingenuity Pathways Analysis and
Knowl-edge Base in which all genes changed by more than 1.5 fold were queried. This diagram shows one of the relational networks in which all up-regulated genes (green) were those re-lated to astrocyte structure or function. This network is very significant with a score of 40, which means that the association by chance alone is less than 99.99%. Those genes with a significant increase in fold change in our study are shaded green, while those with a decrease are shaded in red. In the diagram, the vertical diamond shape represents an enzyme, a horizontal diamond is a peptidase, downward pointing triangle is a kinase, horizontal rectangle is a nu-clear receptor, the oval a transcription factor, and the round other genes. Lines with arrow head = acts on; line with short perpendicular line at end = inhibits; plain line = binds only.
Abbreviations of gene names: ADAMTS3, Disintegrin-like and metalloprotease with throm-bospondin type 1 motif, 3; AHNAK, AHNAK nucleoprotein (desmoyokin); CAPN2, Calpain 2; CAPN3, Calpain 3; CAST, Calpastatin; CD44, CD44 antigen (homing function and Indian blood group system); CRYAB, Crystallin α B; CSPG2, Chondroitin sulfate proteoglycan 2 (Versican); CSPG3, Chondroitin sulfate proteoglycan 3 (neurocan); FBXW7, F-box and WD-40 domain protein 7; FGF1, Fibroblast growth factor 1 (acidic); FGFR2, Fibroblast growth factor receptor 2; G3PB2, Ras-GTPase activating protein SH3 domain-binding protein 2; GFAP, Glial fibrillary acidic protein; KIAA0992, Palladin; MET, Met proto-oncogene (hepatocyte growth factor receptor); MSN, Moesin; NET1, Neuroepithelial cell transforming gene 1; NFKBIA, Nuclear factor kappa light polypeptide gene enhancer in B-cells inhibitor, alpha; PCTK3, PCTAIRE protein kinase 3; PDE8A, Phosphodiesterase 8A; PLEC1, Plectin 1, intermediate fila-ment binding protein 500kDa; PPFIA1, Protein tyrosine phosphatase, receptor type f, inter-acting protein (liprin), α 1; PSEN1, Presenilin 1 (Alzheimer disease 3); PTGS2, Prostaglandin-endoperoxide synthase 2 (G/H synthase and cyclooxygenase); RDX, Radixin; S100A6, S100 calcium binding protein A6 (calcyclin); S100B, S100 calcium binding protein, β (neural); TNC, Tenascin-C; TTN, Titin; VCAM1, Vascular cell adhesion molecule 1; VIL2, Villin 2 (ezrin); YWHAZ, Tyrosine 3-monooxygenase/tryptophan 5-monooxygenase activation protein, zeta.
hippocampi are characterized by a sig-nificant loss of neurons and an increase in astrocytes and microvasculature. It was thus not surprising to find promi-nent among the differentially expressed genes several related to many aspects of astrocyte function. However, the up-reg-ulated genes are not merely a reflection of increased astrocyte numbers. Im-munohistochemical localization of the proteins produced by the differentially expressed genes shows distinct differ-ences in their cellular compartmental-ization (this paper and 35). Several of the molecules observed to be up-regu-lated in this study have been shown previously to be expressed only in “re-active astrocytes” compared with rest-ing astrocytes (37).
Among the astrocyte-related genes up-regulated in MTLE were those associated with changes in astrocyte morphology. GFAP is associated with astrocytic pro-cess extension, Palladin (KIAA0992) reg-ulates the shape of astrocytes (38) and the plectin gene (PLEC1), and its protein serves as a structural protein (39), the lat-ter was also previously reported elevated in sclerotic hippocampi (40). The genes Ezrin (VIL2), Radixin (RDX), and Moesin (MSN) control three closely related pro-teins (ERM propro-teins), which constitute the machinery for the association of actin filament with the plasma membrane (41).
The amino terminal region of the ERM proteins is directly associated with the cytoplasmic domain of CD44 (42). The CD44 gene and protein were also increased in our study and localized in astrocytes. CD44 is a family of surface glycoproteins and is a receptor for hyaluronan (HA), the latter of which is
also elevated in the hippocampus of patients with mesial temporal lobe epilepsy (43).
The up-regulation of the proteins of two extracellular matrix protein genes – the glycoprotein Tenascin-C (TNC) and the glycosoaminoglycan CSPG2
(Veriscan) were also previously reported in the sclerotic hippocampus (43, 44). Both of these extracellular matrix pro-teins are secreted by astrocytes (45).
The S100 proteins are a family of pro-teins involved in Ca2+ regulation in a
va-riety of intracellular functions. In this study, the gene expression for two of these, S100A6 and S100B, was increased. A major and specific target protein for S100B is the giant phosphoprotein AHNAK (46) whose gene expression was up-regulated in the MTLE hippocampi in the present study.
It was reported as early as 1899 (47) that there is a proliferation of the mi-crovasculature in the sclerotic Ammon’s horn. Our microarray studies point to a quite complex molecular reorganization of the sclerotic microvasculature. Gene expression of several molecules associ-ated with the BBB was changed. They in-clude AQP4, AHNAK, CD44, dystro-brevin A, and PLEC1. It is shown that human brain microvessels have chemokine receptors CCR1 and CCR2 on the parenchymal surface of the ves-sels (48). The genes for the ligands of these receptors, CCL3 and CCL2, were increased in expression in MTLE in the present study.
Astrocytes and microglia may play a central role in immune processes in the brain. Astrocytes are known to con-tribute to the inflammatory environment
of the central nervous system by produc-ing a wide range of immunologically rel-evant molecules (49,50). Among these are class II major histocompatibility complex antigens (49) HLA-DPA1, HLA-DQA1, HLA-DRA, HLA-DRB1, and HLA-DRB3 which were up-regulated in this study. Astrocytes also produce a variety of chemokines and cytokines and their re-ceptors (49,50), in addition to those demonstrated in this paper. Additionally, we have demonstrated the presence of activated microglia that express CXCR4 in the sclerotic hippocampus. Such acti-vated microglia may be an important source of TNF and IL-1β (51).
An obvious question that arises is whether such gene responses were due to some intervention other than sclerosis, such as surgical manipulation of tissue or injury due to depth electrode inser-tion. This appears not to be the case, as none of the sclerotic patients used in this study had depth electrodes placed in them, whereas four patients with non-sclerotic hippocampi had.
An Integrating Hypothesis
One of the functions of microarray analyses is the generation of new or al-ternative hypotheses to guide future re-search, and one such hypothesis can be proposed based on these data.
High levels of glutamate release by neurons at a seizure focus as the mecha-nism for the initiation and maintenance of seizures has been a popular hypothe-sis with much experimental data in sup-port. In favor of such a mechanism, in vivo dialysis studies of hippocampal seizure foci in TLE patients show higher than baseline levels of extracellular glu-tamate and excitotoxic levels during ictus (52) as well as high cellular levels (53) in the sclerotic hippocampus com-pared with the non-sclerotic hippocam-pus. However, the source of such ele-vated extracellular levels of glutamate in sclerotic hippocampi have been a puzzle because the sclerotic hippocampus is conspicuously depleted of glutamatergic neurons, long thought to be the source of extracellular glutamate.
Table 4. Gene Expression Fold Changes*
Gene name AQP4 CD44 CXCR4 GFAP PLEC1 NFKBIA
Affymetrix 1.87 3.03 1.95 1.74 1.67 1.66
QRTPCR 2.57 3.67 2.01 4.03 2.17 1.82
*The fold change for genes obtained by both microarray and ORT-PCR. The fold change refers to the change in gene expression level in MTLE subjects relative to PTLE and MaTLE combined. For microarray the average fold change for all transcripts is shown; for QRT-PCR the average of triplicate measurements for each subject was used. MTLE n = 6, non-MTLE n = 6.
However, recent studies have shown that astrocytes can be a non-neuronal source of glutamate (54). Ca2+elevations in astrocytes induce the exocytotic re-lease of glutamate from astrocytes (55). More recently it has been shown in hip-pocampal slice models of epilepsy that astrocytic glutamate can generate parox-ysmal depolarization shifts (PDSs) in neurons (56) suggesting that they may play an important role in interictal events related to seizures. Fellin et al. (57) confirmed the results of Tian et al. (56) in showing that astrocytes are acti-vated during a period of epileptiform ac-tivity and their activation results in in-creased glutamate release. However, Fellin et al. conclude from their studies (57) that the astrocytic glutamate is not necessary for the initiation of epilepti-form activity, although it may modulate and enhance the duration of ictal seizure-like events.
Whereas the experimental slice models of epilepsy discussed above provide clear support for the possibility of Ca2+ -induced glutamate release by astrocytes, these models differ significantly from what prevails at a sclerotic hippocampal seizure focus in TLE. At such sclerotic foci, in addition to a lack of neurons, the astrocytes are “reactive” and behave dif-ferently (58). Indeed, we even found pre-viously that astrocytes in primary cul-tures from human sclerotic hippocampi compared with those from non-sclerotic hippocampi show an increased oscillat-ing frequency of Ca2+waves, suggesting increased intracellular Ca2+release (55) and perhaps increased glutamate release. Cortical astrocytes isolated from epileptic foci in childhood epilepsies (59) and epileptogenic cortical mass lesion in TLE (60) also exhibit elevated Ca2+oscillation frequency).
The hypothesis suggested by our mi-croarray expression data and some previ-ously reported complementary molecu-lar changes in sclerotic hippocampi by others (16,43) is that in the astrocytes in sclerotic foci are present the molecular mechanisms for calcium dependent glu-tamate release (Figure 4). In particular, Figure 3. This figure shows photomicrographs of the localization in area CA1 pyramidal
layer of non-sclerotic (non-MTLE, A, C. E. G, I) and sclerotic (MTLE, B, D, F, H, J) hippocampi of some proteins whose genes showed changes in expression in this study. A & B show the immunolocalization of AQP4 (Aquaporin 4). Note the reduction in immunoreactivity in as-trocytic foot processes around blood vessels in MTLE and increase in asas-trocytic processes throughout the pyramidal layer. C & D show reduction in DMD (Dystrophin) around blood vessels in MTLE. E & F show localization of CD44 (CD44 antigen). In the non-sclerotic hip-pocampus (E) immunoreactivity is seen on fiber-like processes (arrow) extending into the pyramidal layer from the stratum oriens. Scattered among these fibers are CD44 positive astrocyte cell bodies (not shown). In MTLE, many more astrocytes are immunoreactive and form a dense network throughout the region with more intense staining in perivascu-lar foot processes (arrow in F). G & H show PLEC1 (Pectin 1, intermediate filament binding protein 500kDa) immunoreactivity, which is increased in expression in astrocyte cell bodies and perivascular foot processes (arrow). I & J show an increase in CXCR4 (Chemokine (C-X-C motif) receptor 4) expression on microglia in the sclerotic hippocampus (arrow). CXCR4 is increased on a small proportion of astrocytes as well.
that intracellular Ca2+ release in the scle-rotic hippocampus is possible through stimulation by immune factors such as interleukin-1β and chemokines such as stromal derived factor 1α (SDF-1α). IL-1β levels are elevated in MTLE patients, and IL-1β acting through interleukin receptors can induce cyclooxygenase-2 (COX-2)
and prostaglandin-E2(PGE2) through the activation of the transcription factor NFκB (61). Several other molecules pro-duced by the activation of the NFκB pathway can also directly or indirectly result in intracellular Ca2+ release. These
include S100B (62); hyaluronan, which, acting on its receptor CD44, could trigger
Ca2+ release through NFκB and the PGE2 pathway (63); and the chemokine stro-mal derived factor 1 (SDF-1), which, by binding to the CXCR4 receptor, can lead to calcium-dependent release of gluta-mate through a complex signaling path-way also involving PGE2 (64) (Figure 4). An increase in CXCR4 receptors on acti-vated microglia (shown in this paper) could allow for increased SDF-1 binding, thereby inducing microglia to release TNFα, which potentiates prostaglandin-dependent Ca2+ activation and glutamate release. Up-regulation of CD44, S100B and CXCR4 gene expression in sclerotic tissue are demonstrated in this paper, while NFκB and hyaluronan increases have been shown in previous studies re-ported in the literature (16,43).
Ca2+dependent glutamate release from astrocytes is shown to be a SNARE pro-tein-dependent process that requires the presence of functional vesicle-associated proteins, and the glutamate being re-leased from vesicles through an exocy-totic pathway (65). Querying the gene expression levels of vesicle-associated proteins in our study reveals that SNAP23 (+ 1.57 fold) and Syntaxin-16 ( + 1.7 fold) were up-regulated. SNAP23 is an ana-logue of SNAP25 and is expressed in as-trocytes (66). This provides evidence that astrocytes in sclerotic regions may pos-sess vesicular mechanisms involving SNARE proteins for glutamate release.
In the context of a sclerotic hippocam-pal seizure focus elevated levels of gluta-mate, if produced by astrocytes, could initiate seizure activity in the brain by functioning as a paracrine agent, exciting neurons in the subicular region, which is in very near proximity and has an intact population of pyramidal neurons. The subiculum is the main source of output pathways from the hippocampus to the rest of the brain.
Furthermore, the immunological re-sponsiveness of astrocytes may provide clues as to how a variety of initial precip-itating factors contributing to TLE (4) may be associated with the common pathological substrate of hippocampal sclerosis. It is established that an early Figure 4. Hypothesized molecular pathways for glutamate release from astrocytes in
scle-rotic hippocampi. This diagram is constructed on the basis of molecules produced by genes whose expression was found to increase (outlined in red) in this study and those re-ported in other studies (outlined in blue; also see text) of human TLE. The figure also shows that many of the pathways could be activated through known initial precipitating factors of TLE. Abbreviations: CCL2, CCL3, and CCL4, CC family chemokines; CD44, CD44 anti-gen (homing function and Indian blood group system); CX3CL1, fractalkine; CXCR4, α-chemokine receptor; COX-2, cyclooxygenase-2; EP1,3, calcium mobilizing receptors for PGE2; ERK1,2, extracellular signal-related kinases; HA, hyaluronan; IL-1β, interleukin-1β; HSV, herpes simplex virus; HHV6, human herpes virus 6; IL-1R, interleukin 1 receptor; PGE2, prostaglandin E2; SDF1, stromal derived factor 1, also known as CXCL12; TLR, Toll-like re-ceptor; TNFR, tumor necrosis factor rere-ceptor; TNF-α, tumor necrosis factor α.
childhood febrile seizure can be a predis-posing factor for TLE (67). Febrile seizures have been shown to be associ-ated with increased IL-1β levels in CNS and blood plasma (68,69), and such IL-1β levels associated with a genetic polymor-phism (70,71). IL-1β can act on the inter-leukin receptors on astrocytes and via the transcription factor NFκB induce a variety of molecules including the chemokines, cytokines and ERM proteins that are up-regulated in the sclerotic hip-pocampus.
Infections of the brain such as menin-gitis (72), Human Herpes Virus 6, and Herpes Simplex Virus (73) are shown to be associated with TLE. It is possible that the causal link in this association may also be via the astrocytes. Human astro-cytes are shown to express Toll-like re-ceptors (TLR) (74). TLRs are rere-ceptors that recognize pathogen-specific molecu-lar patterns (75) and a wide range of TLRs is expressed by astrocytes, includ-ing those that respond to viruses and bacteria (76). Both IL-R1 and TLRs in-duce signal transduction pathways lead-ing mainly to activation of the transcrip-tion factor NFκB (77) and presumably of molecular pathways that could lead to enhanced release of glutamate by the sclerotic hippocampus.
The proposed hypothesis, while viding an integrative framework, pro-vides the basis for future experimental ex-ploration of the pathophysiology of TLE.
ACKNOWLEDGMENTS
We thank Ms. Ilona Kovacs for expert assistance with immunohistochemistry and Dr. Robert Mann with molecular bi-ology. We also thank Dr. Joseph Cubels for valuable discussions during the course of this work. This work was sup-ported by R21-NS48434.
REFERENCES
1. Gloor P. (1991) Mesial temporal sclerosis: Histori-cal background and an overview from a modern perspective. In: Luders H (ed.) Epilepsy Surgery. Raven Press, New York, pp. 6703–889. 2. Sommer W. (1880) Erkrankung des
Ammon-shorns als aetiologisches Moment der Epilepsie.
Arch. Psychiatr. Nervenkr. 10:631–75.
3. de Lanerolle NC, Kim JH, Williamson A, et al. (2003) A retrospective analysis of hippocampal pathology in human temporal lobe epilepsy: Evi-dence for distinctive patient subcategories.
Epilepsia. 44:677–87.
4. Mathern GW, Babb TL, Armstrong DL. (1997) Hippocampal sclerosis. In: Engel J, Pedley TA (eds.) Epilepsy: A Comprehensive Textbook. Lippincott-Raven, Philadelphia, pp.133–55. 5. Babb TL, Lieb JP, Brown WJ, Pretorius J, Crandall
PH. (1984) Distribution of pyramidal cell density and hyperexcitability in the epileptic human hip-pocampal formation. Epilepsia 25:721–8. 6. Spencer DD. (1994) Classifying the epilepsies by
substrate. Clin. Neurosci. 2:104–9.
7. Bower SPC, Kilpatrick CJ, Vogrin SJ, Morris K, Cook MJ. (2000) Degree of hippocampal atrophy is not related to a history of febrile seizures in patients with proved hippocampal sclerosis.
J. Neurol. Neurosurg. Psychiatr. 69:733–8.
8. Kothare SV, Sotrel A, Duchowny M, Jayakar P, Marshall PC, Smith TW. (2001) Absence of hip-pocampal sclerosis in children with multiple daily seizures since infancy. J. Child Neurol. 16:562–4.
9. Thom M, Zhou J, Martinian L, Sisodiya SM. (2005) Quantitative post-mortem study of the hippocampus in chronic epilepsy: seizures do not invariably cause neuronal loss. Brain. 128:1344–57.
10. de Lanerolle NC. (2001) The pathology of the epilepsies: insights from pathology to mecha-nisms of causation of temporal lobe epilepsy. In: Pellock JM, Dodson WE, Bourgeois B (ed.)
Pedi-atric Epilepsy: Diagnosis and Therapy. Demos, New
York, pp. 45–60.
11. Spencer SS, Berg AT, Vickrey BG et al. (2005) Pre-dicting long-term seizure outcome after resective epilepsy surgery: The Multicenter Study.
Neurol-ogy. 65:912–8.
12. O’Connor ER, Sontheimer H, Spencer DD, de Lanerolle NC. (1998) Astrocytes from human hippocampal epileptogenic foci exhibit action potential-like responses. Epilepsia. 39:347–54. 13. Schroder W, Hinterkeuser S, Seifert G et al.
(2000) Functional and molecular properties of human astrocytes in acute hippocampal slices obtained from patients with temporal lobe epilepsy. Epilepsia. 41:S181–4.
14. Seifert G, Schroder W, Hinterkeuser S, Schu-macher T, Schramm J, Steinhauser C. (2002) Changes in flip/flop splicing of astroglial AMPA receptors in human temporal lobe epilepsy.
Epilepsia. 43(Suppl. 5):162–7.
15. Eid T, Thomas MJ, Spencer DD et al. (2004) Loss of glutamine synthetase in the human epilepto-genic hippocampus: a possible mechanism for el-evated extracellular glutamate in mesial tempo-ral lobe epilepsy. Lancet. 363:28–37.
16. Crespel A, Coubes P, Rousset M-C et al. (2002) Inflammatory reactions in human medial tempo-ral lobe epilepsy with hippocampal sclerosis.
Brain Res. 952:159–69.
17. Spencer DD, Spencer SS, Mattson RH, Williamson PD, Novelly R. (1984) Access to pos-terior medial temporal lobe structures in the sur-gical treatment of temporal lobe epilepsy.
Neuro-surg. 15:667–71.
18. de Lanerolle NC, Kim JH, Robbins RJ, Spencer DD. (1989) Hippocampal interneuron loss and plasticity in human temporal lobe epilepsy. Brain
Res. 495:387–95.
19. Kim JH, Guimaraes PO, Shen M-Y, Masukawa LM, Spencer DD. (1990) Hippocampal neuronal density in temporal lobe epilepsy with and with-out gliomas. Acta Neuropathol. 80:41–5. 20. Grotzer MA, Patti R, Geoerger B, Eggert A, Chou
TT, Phillips PC. (2000) Biological stability of RNA isolated from RNAlater-treated brain tumor and neuroblastoma xenografts. Med. Pediatr.
Oncol. 34:438–42.
21. Li C, Wong WH. (2001) Model-based analysis of oligonucleotide arrays: Expression index compu-tation and outlier detection. Proc. Natl. Acad. Sci.
U. S. A. 98:31–6.
22. Venables WN, Ripley BD. (1999) Modern applied
statistics with S-plus. Springer, New York.
23. Eisen MB, Spellman PT, Brown PO, Botstein D. (1998) Cluster analysis and display of genome-wide expression patterns. Proc. Natl. Acad. Sci.
U. S. A. 95:14863–8.
24. Hastie T, Tibshirani R, Friedman J. (2001) The
ele-ments of statistical learning: Data mining inference prediction. Springer, New York.
25. Williamson A. (1994) Electrophysiology of epileptic human neocortical and hippocampal neurons maintained in vitro. Clin. Neurosci. 2:47–52.
26. Zaatreh MM, Firlik KS, Spencer DD, Spencer SS. (2003) Temporal lobe tumoral epilepsy: charac-teristics and predictors of surgical outcome.
Neu-rology. 61:636–41.
27. Li JZ, Vawter MP, Walsh DM et al. (2004) System-atic changes in gene expression in postmortem human brains associated with tissue pH and ter-minal medical conditions. Human Mol. Gen. 13:609–16.
28. Calvano SE, Xiao W, Richards DR et al. (2005) A network-based analysis of systemic inflammation in humans. Nature. 437:1032–7.
29. Dash PK, Kobori N, Moore AN. (2004) A molecu-lar description of brain trauma pathophysiology using microarray technology: an overview.
Neu-rochem. Res. 29:1275–86.
30. Luo Z, Geschwind D. (2001) Microarray applica-tions in neuroscience. Neurobiol. Dis. 8:183–93. 31. Hsu S, Raine L, Fanger H. (1981) The use of
avidin-biotin-peroxidase complex (ABC) in im-munoperoxidase techniques: a comparison be-tween ABC and unlabeled antibody (PAP) proce-dures. J. Histochem. Cytochem. 29:577–80. 32. Benjamini Y, Hochberg Y. (1995) Controlling the
false discovery rate: a practical and powerful ap-proach to multiple testing. J. R. Stat. Soc. [Ser B]. 57:289–300.
Mol-ecular diversity of astrocytes with implications for neurological disorders. Proc. Natl. Acad. Sci.
U. S. A. 101:8384–9.
34. Südhof TC. (2004) The synaptic vesicle cycle.
Annu. Rev. Neurosci. 27:509–47.
35. Eid T, Lee T-SW, Thomas MJ et al. (2005) Loss of perivascular aquaporin 4 may underlie deficient water and K+ homeostasis in the human epilepto-genic hippocampus. Proc. Natl. Acad. Sci. U. S. A. 102:1193–8.
36. Lee TS, Eid T, Mane S et al. (2004) Aquaporin-4 is increased in the sclerotic hippocampus in human temporal lobe epilepsy. Acta. Neuropathol. 108:493–502.
37. Eddleston M, Mucke L. (1993) Molecular profile of reactive astrocytes – implications for their role in neurologic disease. Neuroscience. 54:15–36. 38. Boukhelifa M, Hwang SJ, Valtschanoff JG,
Meeker RB, Rustioni A, Otey CA. (2003) A critical role for palladin in astrocyte morphology and re-sponse to injury. Mol. Cell. Neurosci. 23:661–8. 39. Foisner R, Wiche G. (1991) Intermediate filament
associated proteins. Curr. Opin. Cell. Biol. 3:75–81. 40. Lie AA, Schroder R, Blümcke I, Magin TW,
Wiestler OD, Elger CE. (1998) Plectin in the human central nervous system: predominant ex-pression at pia/glia interfaces. Acta. Neuropathol. 96:215–21.
41. Tsukita S, Yonemura S, Tsukita S. (1997) ERM proteins: head-to-tail regulation of actin-plasma membrane interaction. TIBS. 22:53–8. 42. Tsukita S, Oishi K, Sato, N, Sagara J, Kawai A,
Tsukita S. (1994) ERM family members as molec-ular linkers between the cell surface glycoprotein CD44 and actin-based cytoskeletons. J. Cell Biol. 126:391–401.
43. Perosa SR, Porcionatto MA, Cukiert A et al. (2002) Glycosaminoglycan levels and proteogly-can expression are altered in the hippocampus of patients with mesial temporal lobe epilepsy.
Brain Res. Bull. 58:509–16.
44. Scheffler B, Faissner A, Beck H et al. (1997) Hip-pocampal loss of Tenascin boundaries in Ammon’s horn sclerosis. Glia 19:35–46. 45. Nishio T, Kawaguchi S, Yamamoto M, Iseda T,
Kawasaki T, Hase T. (2005) Tenascin-C regulates proliferation and migration of cultures astrocytes in a scratch wound assay. Neuroscience. 132:87–102.
46. Gentil BJ, Delphin C, Mbele GO et al. (2001) The giant protein AHNAK is a specific target for the calcium- and Zinc-binding S100B protein. J. Biol.
Chem. 276:23253–61.
47. Bratz E. (1899) Ammonshornbefunde bei Epilep-tikern. Arch. Psychiatr. Nervenkr. 32:820–35. 48. Andjelkovic AV, Pachter JS. (2000)
Characteriza-tion of binding sites for chemokines MCP-1 and MIP-1alpha on human brain microvessels. J.
Neu-rochem. 75:1898–906.
49. Dong Y, Benveniste EN. (2001) Immune function of astrocytes. Glia. 36:180–90.
50. John GR, Lee SC, Song X, Rivieccio M, Brosnan
CF. (2005) IL-1-Regulated responses in astrocytes: relevance to injury and recovery. Glia. 49:161–76. 51. Aloisi F. (2001) Immune function of microglia.
Glia. 36:165–79.
52. During MJ, Spencer DD. (1993) Extracellular hip-pocampal glutamate and spontaneous seizure in the conscious human brain. Lancet. 341:1607–10. 53. Petroff OA, Errante LD, Rothman DL, Kim JH,
Spencer DD. (2002) Neuronal and glial metabo-lite content of the epileptogenic human hip-pocampus. Ann. Neurol. 52:635–42.
54. Volterra A, Meldolesi J. (2005) Astrocytes, from brain glue to communication elements: the revo-lution continues. Nat. Rev. Neurosci. 6:626–40. 55. Bezzi P, Carmignoto G, Pasti L et al. (1998)
Prostaglandins stimulate calcium-dependent glu-tamate release in astrocytes. Nature. 391:281–5. 56. Tian G-F, Azmi H, Takano T et al. (2005) An
as-trocytic basis of epilepsy. Nat. Med. 11:973–81. 57. Fellin T, Gomez-Gonzalo M, Gobbo S,
Carmignoto G, Haydon PG. (2006) Astrocytic glutamate is not necessary for the generation of epileptiform neuronal activity in hippocampal slices. J. Neurosci. 26:9312–22.
58. de Lanerolle NC, Lee TS. (2005) New facets of the neuropathology and molecular profile of human temporal lobe epilepsy. Epilepsy Behav. 7:190–203.
59. Manning TJ, Sontheimer H. (1997) Spontaneous intracellular calcium oscillations in cortical astro-cytes from a patient with intractable childhood epilepsy (Rasmussen’s encephalitis). Glia. 21:332–40.
60. Cornell-Bell AH, Williamson A. (1993) Hyperex-citability of Neurons and astrocytes in epileptic human cortex. In: Fedoroff (ed.) Biology and
Pathology of Astrocyte-Neuron Interactions. Plenum
Press, New York, pp. 51–65.
61. Molina-Holgado E, Ortiz S, Molina-Holgado F, Guaza C. (2000) Induction of COX-2 and PGE2 biosynthesis by IL-1beta is mediated by PKC and mitogen-activated protein kinases in murine as-trocytes. Br. J. Pharmacol. 131:192–9.
62. Barger SW, Van Eldik LJ. (1992) S100B stimulates calcium fluxes in glial and neuronal cells. J. Biol.
Chem. 267:9689–94.
63. Puré E, Cuff CA. (2001) A crucial role for CD44 in inflammation. Trends Mol. Med. 7:213–21. 64. Bezzi P, Domercq M, Brambilla L, et al. (2001)
CXCR4-activated astrocyte glutamate release via TNFα: amplification by microglia triggers neuro-toxicity. Nat. Neurosci. 4:702–10.
65. Araque A, Li N, Doyle T, Haydon PG. (2000) SNARE protein-dependent glutamate release from astrocytes. J. Neurosci. 20:666–73. 66. Hepp R, Perraut M, Chasserot-Golaz S et al.
(1999) Cultured glial cells express the SNAP-25 analogue SNAP-23. Glia. 27:181–7.
67. Holthausen H. (1994) Febrile convulsions, mesial temporal sclerosis and temporal lobe epilepsy. In: Wolf P (ed.) Epileptic Seizures and Syndromes. John Libbey & Company Ltd., London.
68. Haspolat S, Mihci E, Coskun M, Gumuslu S, Ozben T, Yegin O. (2002) Interleukin-beta, tumor necrosis factor-alpha, and nitrite levels in febrile seizures. J. Child Neurol. 17:749–51.
69. Virta M, Hurme M, Helminen M. (2002) In-creased plasma levels of pro- and anti-inflamma-tory cytokines in patients with febrile seizures.
Epilepsia. 43: 920–3.
70. Kanemoto K, Kawasaki J, Miyamoto T, Obayashi H, Nishimura M. (2000) Interleukin (IL)-1beta, IL-1alpha, and IL-1 receptor antagonist gene polymorphisms in patients with temporal lobe epilepsy. Ann. Neurol. 47:571–4.
71. Virta M, Hurme M, Helminen M. (2002) In-creased frequency of interleukin-1beta (-511) al-lele 2 in febrile seizures. Pediatr. Neurol. 26:192–5. 72. Ounsted C, Glaser GH, Lindsay J, Richards P.
(1985) Focal epilepsy with mesial temporal scle-rosis after acute meningitis. Arch. Neurol. 42:1058–60.
73. Uesugi H, Shimizu H, Maehara T, Arai N, Nakayama H. (2000) Presence of human herpes virus 6 and herpes simplex virus detected by polymerase chain reaction in surgical tissue from temporal lobe epileptic patients. Psychiatry Clin.
Neurosci. 54:589–93.
74. Bsibsi M, Ravid R, Gveric D, van Noort JM. (2002) Broad expression of Toll-like receptors in the human central nervous system. J. Neuropath.
Exp. Neurol. 61:1013–21.
75. Medzhitov R. (2001) Toll-like receptors and in-nate immunity. Nat. Rev. Immunol. 1:135–45. 76. Carpentier PA, Begolka WS, Olson JK, Elhofy A,
Karpus WJ, Miller SD. (2005) Differential activa-tion of astrocytes by innate and adaptive im-mune stimuli. Glia. 49:360–74.
77. May MJ, Ghosh S. (1998) Signal transduction through NF-kappa B. Immunol. Today. 19:80–8.