Simple extensions for a reparameterised IBM Model 2
Douwe Gelling
Department of Computer Science The University of Sheffield [email protected]
Trevor Cohn
Computing and Information Systems The University of Melbourne [email protected]
Abstract
A modification of a reparameterisation of IBM Model 2 is presented, which makes the model more flexible, and able to model a preference for aligning to words to either the right or left, and take into account POS tags on the target side of the corpus. We show that this extension has a very small impact on training times, while obtain-ing better alignments in terms of BLEU scores.
1 Introduction
Word alignment is at the basis of most statistical machine translation. The models that are gener-ally used are often slow to train, and have a large number of parameters. Dyer et al. (2013) present a simple reparameterization of IBM Model 2 that is very fast to train, and achieves results similar to IBM Model 4.
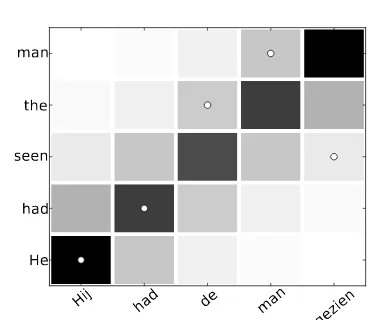
While this model is very effective, it also has a very low number of parameters, and as such doesn’t have a large amount of expressive power. For one thing, it forces the model to consider alignments on both sides of the diagonal equally likely. However, it isn’t clear that this is the case, as for some languages an alignment to earlier or later in the sentence (above or below the diagonal) could be common, due to word order differences. For example, when aligning to Dutch, it may be common for one verb to be aligned near the end of the sentence that would be at the beginning in En-glish. This would mean most of the other words in the sentence would also align slightly away from the diagonal in one direction. Figure 1 shows an example sentence in which this happens. Here, a circle denotes an alignment, and darker squares are more likely under the alignment model. In this case the modified Model 2 would simply make both directions equally likely, where we would re-ally like for only one direction to be more likely.
Hij had de man
gezien He
[image:1.595.315.499.208.368.2]had seen the man
Figure 1: Visualization of aligned sentence pair in Dutch and English, darker shaded squares have a higher alignment probability under the model, a circle indicates a correct alignment. The English sentence runs from bottom to top, the Dutch sen-tence left to Right.
In some cases it could be that the prior probability for a word alignment should be off the diagonal.
Furthermore, it is common in word alignment to take word classes into account. This is commonly implemented for the HMM alignment model as well as Models 4 and 5. Och and Ney (2003) show that for larger corpora, using word classes leads to lower Alignment Error Rate (AER). This is not implemented for Model 2, as it already has an alignment model that is dependent on both source and target length, and the position in both sen-tences, and adding a dependency to word classes would make the the Model even more prone to overfitting than it already is. However, using the reparameterization in (Dyer et al., 2013) would leave the model simple enough even with a rela-tively large amount of word classes.
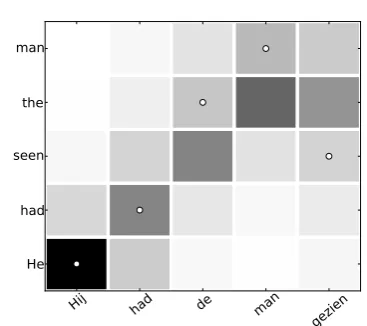
Figure 2 shows an example of how the model extensions could benefit word alignment. In the example, all the Dutch words have a different
Hij had de man
gezien
[image:2.595.82.266.70.233.2]He had seen the man
Figure 2: Visualization of aligned sentence pair in Dutch and English, darker shaded squares have a higher alignment probability under the model, a circle indicates a correct alignment. The English sentence runs from bottom to top, the Dutch sen-tence left to Right.
word class, and so can have different gradients for alignment probability over the english words. If the model has learned that prepositions and nouns are more likely to align to words later in the sen-tence, it could have a lower lambda for both word classes, resulting in a less steep slope. If we also split lambda into two variables, we can get align-ment probabilities as shown above for the Dutch word ’de’, where aligning to one side of the diag-onal is made more likely for some word classes. Finally, instead of just having one side of the di-agonal less steep than the other, it may be useful to instead move the peak of the alignment prob-ability function off the diagonal, while keeping it equally likely. In Figure 2, this is done for the past participle ’gezien’.
We will present a simple model for adding the above extensions to achieve the above (splitting the parameter, adding an offset and conditioning the parameters on the POS tag of the target word) in section 2, results on a set of experiments in sec-tion 3 and present our conclusions in secsec-tion 4.
2 Methods
We make use of a modified version of Model 2, from Dyer et al. (2013), which has an alignment model that is parameterised in its original form solely on the variable λ. Specifically, the proba-bility of a sentenceegiven a sentence f is given as:
m
Y
i=1
n
X
j=0
δ(ai|i, m, n)·θ(ei|fai)
here,mis the length of the target sentencee,n the same for source sentencef,δis the alignment model andθ is the translation model. In this pa-per we are mainly concerned with the alignment modelδ. In the original formulation (with a minor tweak to ensure symmetry through the center), this function is defined as:
δ(ai=j|i, m, n ) =
p0 j = 0
(1−p0)·eZh((i,j,m,ni,m,n)) 0< j ≤n
0 otherwise
where,h(·)is defined as
h(i, j, m, n) =−λmi+ 1−n+ 1j
and Zλ(i, m, n) is Pnj0=1eλh(i,j0,m,n), i.e. a
normalising function. Like the original Model 2 (Brown et al., 1993), this model is trained us-ing Expectation-Maximisation. However, it is not possible to directly update theλparameter during training, as it cannot be computed analytically. In-stead, a gradient-based approach is used during the M-step.
Two different optimisations are employed, the first of which is used for calculating Zλ. This
function forms a geometric series away from the diagonal (for each target word), which can be computed efficiently for each of the directions from the diagonal. The second is used during the M-step when computing the derivative, and is very similar, but instead of using a geometric series, an arithmetico-geometric series is used.
In order to allow the model to have a different parameter above and below the diagonal, the only change needed is to redefineh(·)to use a different parameter forλabove and below the diagonal. We denote these parameters asλandγ for below and above the diagonal respectively. Further, the offset is denoted asω.
h(i, j,m, n) =
−λ i m+ 1−
j n+ 1+ω
j <=j↓
−γmi+ 1−n+ 1j +ω otherwise
j↓is the point closest to or on the diagonal here,
calculated as:
max(min(bi·m(n+ 1+ 1)+ω·(n+ 1)c, n),0)
Here, ω can range from−1 to1, and thus the calculation for the diagonalj↓ is clamped to be in
a valid range for alignments.
As the partition function (Z(·)) used in (Dyer et al., 2013) consists of 2 calculations for each tar-get positioni, one for above and one for below the diagonal, we can simply substituteγ for the geo-metric series calculations in order to use different parameters for each:
s↓(eλh(i,j↓,m,n), r) +sn−↑(eγh(i,j↑,m,n), r)
wherej↑isj↓+ 1.
2.1 Optimizing the Parameters
As in the original formulation, we need to use gradient-based optimisation in order to find good values forλ, γ andω. Unfortunately, optimizing ωwould require taking the derivative ofh(·), and thus the derivative of the absolute value. This is unfortunately undefined when the argument is 0, however we work around this by choosing a sub-gradient of0at that point. This means the steps we take do not always improve the objective function, but in practice the method works well.
The first derivative of Lwith respect to λat a single target word becomes:
∇λL= j↓
X
k=1
p(ai =k|ei,f, m, n)h(i, k, m, n)
−
j↓
X
l=1
δ(l|i, m, n)h(i, l, m, n)
And similar for finding the first derivative with respect to γ, but summing fromj↑ to n instead.
The first derivative with respect toωthen, is:
∇ωL= n
X
k=1
p(ai =k|ei,f, m, n)h0(i, k, m, n)
−
j↓
X
l=1
δ(l|i, m, n)h0(i, l, m, n)
Where h0(·) is the first derivative of h(·) with
respect to ω. For obtaining this derivative, the arithmetico-geometric series (Fernandez et al., 2006) was originally used as an optimization, and for the gradient with respect toomegaa geometric series should suffice, as an optimization, as there is no conditioning on the source words. This is not done in the current work however, so timing results will not be directly comparable to those found in (Dyer et al., 2013).
Conditioning on the POS of the target words then becomes as simple as using a differentλ,γ, andωfor each POS tag in the input, and calculat-ing a separate derivative for each of them, uscalculat-ing only the derivatives at those target words that use the POS tag. A minor detail is to keep a count of alignment positions used for finding the derivative for each different parameter, and normalizing the resulting derivatives with those counts, so the step size can be kept constant across POS tags.
3 Empirical results
The above described model is evaluated with ex-periments on a set of 3 language pairs, on which AER scores and BLEU scores are computed. We use similar corpora as used in (Dyer et al., 2013): a French-English corpus made up of Europarl ver-sion 7 and news-commentary corpora, the Arabic-English parallel data consisting of the non-UN portions of the NIST training corpora, and the FBIS Chinese-English corpora.
Model Fr-En Ar-En Zh-En Tokens 111M 46M 17.3M (after) 110M 29.0M 10.4M average 1.64 0.76 0.27 Model 4 15.5 6.3 2.2
Table 1: Token counts and average amount of time to train models (and separately training time for Model 4) on original corpora in one direction in hours, by corpus.
used as in (Dyer et al., 2013), with stepsize for up-dates to λ andγ during gradient ascent is 1000, and that forωis0.03, decaying after every gradi-ent descgradi-ent step by 0.9, using 8 steps every iter-ation. Bothλandγ are initialised to6, andω is initialised to0. For these experiments the pos and pos & split use POS tags generated using the Stan-ford POS tagger (Toutanova and Manning, 2000), using the supplied models for all of the languages used in the experiments. For comparison, Model 4 is trained for 5 iterations using 5 iterations each of Model 1 and Model 3 as initialization, using GIZA++ (Och and Ney, 2003).
For the comparisons in AER, the corpora are used as-is, but for the BLEU comparisons, sen-tences longer than 50 words are filtered out. In Table 2 the sizes of the corpora before filtering are listed, as well as the time taken in hours to align the corpora for AER. As the training times for the different versions barely differ, only the aver-age is displayed for the models here described and Model 4 training times are given for comparison. Note that the times for the models optimizing only λandγ, and the model only optimizingωstill cal-culate the derivatives for the other parameters, and so could be made to be faster than here displayed. For both the BLEU and AER results, the align-ments are generated in both directions, and sym-metrised using the grow-diag-final-and heuristic, which in preliminary tests had shown to do best in terms of AER.
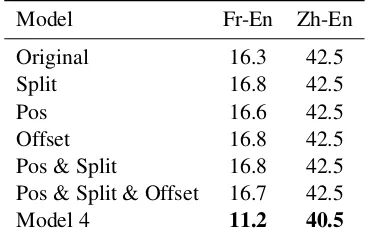
The results are given in Table 2. These scores were computed using the WMT2012 data as gold standard. The different extensions to the model make no difference to the AER scores for Chinese-English, and actually do slightly worse for French-English. In both cases, Model 4 does better than the models introduced here.
Model Fr-En Zh-En
Original 16.3 42.5
Split 16.8 42.5
Pos 16.6 42.5
Offset 16.8 42.5
Pos & Split 16.8 42.5 Pos & Split & Offset 16.7 42.5
Model 4 11.2 40.5
Table 2: AER results on Chinese-English and French-English data sets
Model Fr-En Ar-En Zh-En Original 25.9 43.8 32.8
Split 25.9 43.2 32.8
Pos 25.9 43.9 32.9
Offset 26.0 43.9 32.8
Pos & Split 26.0 44.1 33.2 Pos & Split & Offset 26.0 44.2 33.3 Model 4 26.8 43.9 32.4
Table 3: BLEU results on Chinese-English and French-English data sets
For the comparisons of translation quality, the models are trained up using a phrase-based trans-lation system (Koehn et al., 2007) that used the above listed models to align the data. Language models were augmented with data outside of the corpora for Chinese-English (200M words total) and Arabic-English (100M words total). Test sets for Chinese are MT02, MT03, MT06 and MT08, for Arabic they were MT05, MT06 and MT08, and for French they were the newssyscomb2009 data and the newstest 2009-2012 data.
The results are listed in Table 31. BLEU scores
for Arabic-English and Chinese-English are com-puted with multiple references, while those for French-English are against a single reference. Al-though the different models made little difference in AER, there is quite a bit of variation in the BLEU scores between the different models. In all cases, the models conditioned on POS tags did better than the original model, by as much as0.5BLEU points. For Arabic-English as well as Chinese-English, the full model outperformed
1The difference in these results compared to those
[image:4.595.96.267.64.148.2]Model 4, in the case of Chinese-English by 0.9 BLEU points.
The low impact of the split and offset models are most likely due to the need to model all align-ments in the corpus. The distributions can’t skew too far to aligning to one direction, as that would lower the probability of a large amount of align-ments. This is reflected in the resulting parame-tersλ,γ andωthat are estimated, as the first two do not differ much from the parameters estimated when both are kept the same, and the second tends to be very small.
As for the Pos model, it seems that only vary-ing the symmetrical slope for the different POS tags doesn’t capture the differences between dis-tributions for POS tags. For example, theλ and γ parameters can differ quite a lot in the Pos & Split model when compared to the Pos model, with one side having a much smaller parameter and the other a much larger parameter for a given POS tag in the first model, and the single parameter being closer to the model average for the same POS tag in the second model.
The low variation in results between the differ-ent models for French-English might be explained by less word movement when translating between these languages, which could mean the original model is sufficient to capture this behaviour.
4 Conclusion
We have shown some extensions to a reparame-terized IBM Model 2, allowing it to model word reordering better. Although these models don’t improve on the baseline in terms of AER, they do better than the original in all three languages tested, and outperform M4 in two of these lan-guages, at little cost in terms of training time. Fu-ture directions for this work include allowing for more expressivity of the alignment model by using a Beta distribution instead of the current exponen-tial model.
5 Acknowledgments
Dr Cohn is the recipient of an Australian Re-search Council Future Fellowship (project number FT130101105).
References
Peter F. Brown, Vincent J. Della Pietra, Stephen A. Della Pietra, and Robert. L. Mercer. 1993.
The mathematics of statistical machine translation:
Parameter estimation. Computational Linguistics,
19:263–311.
Chris Dyer, Victor Chahuneau, and Noah A Smith. 2013. A simple, fast, and effective
reparameteri-zation of ibm model 2. InProceedings of
NAACL-HLT, pages 644–648.
P. A. Fernandez, T. Foregger, and J. Pahikkala. 2006. Arithmetico-geometric series.
Philipp Koehn, Hieu Hoang, Alexandra Birch, Chris Callison-Burch, Marcello Federico, Nicola Bertoldi, Brooke Cowan, Wade Shen, Christine Moran, Richard Zens, Chris Dyer, Ondˇrej Bojar, Alexandra Constantin, and Evan Herbst. 2007. Moses: Open source toolkit for statistical machine translation. In
Proceedings of the 45th Annual Meeting of the ACL on Interactive Poster and Demonstration Sessions, ACL ’07, pages 177–180, Stroudsburg, PA, USA. Association for Computational Linguistics.
Franz Josef Och and Hermann Ney. 2003. A sys-tematic comparison of various statistical alignment
models. Comput. Linguist., 29:19–51, March.
Kristina Toutanova and Christopher D. Manning. 2000. Enriching the knowledge sources used in a
maximum entropy part-of-speech tagger. In