Leaching of Rare-Earth Elements and Their Adsorption
by Using Blue-Green Algae
Jung-Ah Kim
1;*, Gjergj Dodbiba
1, Yuji Tanimura
2, Kohei Mitsuhashi
2,
Naoki Fukuda
2, Katsunori Okaya
1, Seiji Matsuo
1and Toyohisa Fujita
11Department of Systems Innovation, Graduate School of Engineering, The University of Tokyo, Tokyo 113-8656, Japan 2Research and Development, Nittetsu Mining Co., Ltd., Tokyo 190-0182, Japan
In the present study, REEs were leached from a Vietnamese ore, by using (NH4)2SO4and REEs were adsorbed from this leachate by
blue-green algae (phormidium). In addition, the biosorption characteristics of phormidium for the adsorption of Nd has been studied.
When the concentration of ammonium sulfide was 1%, leaching time was 3 h, and S/L ratio was 0.09, the leaching ratio of Nd was 67.3%. In the adsorption process, when dosage of phormidium was 0.2 kg/L, the contact time was 30 min, and the temperature was 298 K, while pH was kept at the initial value (i.e. pH 5.6), the adsorption density of Nd was 182 mg/kg. These results were similar with the adsorption density of other absorbents, such as: activated carbon, Fe-based absorbent, and calcinated dolomite. Moreover, the equilibrium sorption isotherm of Nd onto phormidium was described by the Langmuir isotherm equation and the pseudo-second-order kinetic model fits the experimental data well. [doi:10.2320/matertrans.M2011111]
(Received April 13, 2011; Accepted June 13, 2011; Published July 27, 2011)
Keywords: rare-earth elements (REEs), leaching, biosorption, blue-green algae
1. Introduction
The rare earth elements (REEs) include 15 lanthanide elements (Z¼57through 71) and yttrium (Z¼39).1)As the number of technological applications of REE has been multiplied over the past several decades, demand for several of the less abundant REE has increased dramatically. The diverse nuclear, metallurgical, chemical, catalytic, electrical, magnetic and optical properties of the REE have led to an ever increasing variety of applications. These uses range from mundane to high-tech to futuristic. China now produces over 95% of the world’s rare earth supply.2) To cope with
monopoly of China and to expand and develop the use of the rare earths, the search for new mineral sources is important.
Considering the main disadvantages of conventional process like sulfuric acid roasting and sodium hydroxide treatment, one of the emerging techniques for extracting rare earth involves ammonium compounds.3)The chemical reaction equation is as follow;4)
fAl4[Si4O10](OH)8gmnRE(s)3þþ3nNH4(aq)þ
$ fAl4[Si4O10](OH)8gm3nNH4(s)þþnRE(aq)3þ
where, s and aq stand for solid phase and liquid phase, respectively. In the present study, REEs was leached from ore, which was imported from Vietnam by using (NH4)2SO4
and the effects of concentration, leaching time and S/L ratio were investigated. In addition, REEs was adsorbed from this leachate by biosorption. Biosorption is an innovative method that employs inactive and dead biomass for the recovery of metals from aqueous solution. As an alternative to traditional methods, its application in various cases is now widely considered by the scientific community.5) A biosorption-based process offers a number of advantages when compared to the conventional methods used. These include low operating costs, minimization of the volume of chemical
and/or biological sludge to be handled and high efficiency in detoxifying effluents.6,7) In particular, phormidium used in this study is a kind of cyanobacteria. Nearly 200 species of phormidium are found worldwide and certain species inhabit the thermal springs. In Japan, which is well-known for thermal springs, phormidium is affordable material. By the way, because the phormidium produces a hydrogen sulfide which leads to anoxic conditions, the corals die. Therefore the phormidium was used for REEs adsorption and the possibility of the phormidium to be used as an adsorbent was investigated. In addition, the biosorption characteristics of phormidium for the adsorption of Nd ions from aqueous solution were also evaluated.
2. Experimental
2.1 Leaching method
The ore was crushed and screened to less than 3 mm in size, before being imported from Vietnamese mine to Japan. The leaching process of REEs from the ore was carried out in a 0.1 L flask and temperature was adjusted at room temperature (i.e. 293 K). Stirring of leaching solution and ore was achieved by using magnetic bar driven by a variable speed motor. (NH4)2SO4 was used for REEs leaching.
The concentration of (NH4)2SO4 was varied between 1 and
10 mass%. The leaching time was kept constant between 0.5 and 18 h. The solid/liquid ratio was fixed in the range between 0.03 and 0.20. At the end of each test, the leachate was analyzed for REE ions by using an inductive coupled plasma-optical emission spectroscopy (ICP-OES: Optima 5300 DV, PerkinElmer).
2.2 Preparation of phormidium adsorbent
The phormidium was collected around hot spring in Akita, Japan. The collected phormidium was washed 3 times by distilled water and dried at 358 K for 48 h. After drying, the product was ground by using a mortar and pestle to less 74mmin size. The product was used for adsorption.
*Graduate Student, The University of Tokyo
the Nd-adsorbed concentration (i.e. mass of Nd/mass of adsorbent), which is also known as adsorption density. The adsorbed amount of Nd,qwas calculated using the following equation (eq. (1)):
q¼ ðC0C1Þ
V
M ðmg/gÞ ð1Þ
where C0 and C1 are aqueous concentration of adsorbate
(in mg/L) before and after adsorption, respectively.Vis the volume of sample (in L); M is the mass of the adsorbent (in g).
2.4 Analysis method
Chemical composition of REEs ore was analyzed by X-ray fluorescence (XRF: Supermini, RIGAKU) and ICP-OES. In addition, the structure of the synthesized adsorbents was analyzed by means of an X-ray diffractometer (XRD: MO3XHF, Mac Science). Scanning electron microscope equipped with an energy dispersive X-ray spectroscope (SEM-EDS: JSM-7000FX, JEOL) was also used to analyze the morphology of the ore.
3. Experimental Results
3.1 Characterization of REEs ore
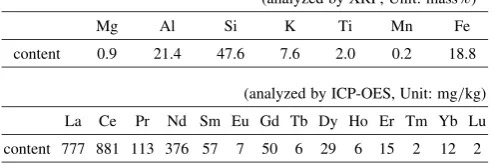
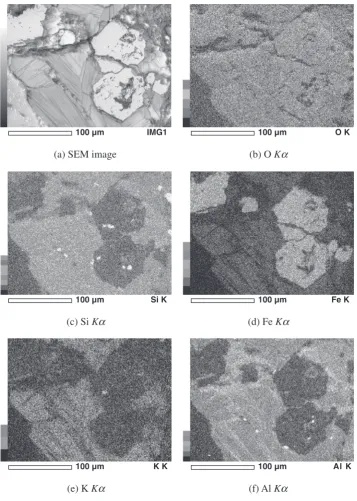
The elemental composition of the REEs ore is given in Table 1. The results of the XRF analysis showed that the ore contained about 21.4 mass% Al, 47.6 mass% Si, 7.6 mass% K and 18.8 mass% Fe. REEs content is lower than detecting limit of this XRF. Therefore, the ore was dissolved in acid and analyzed by ICP-OES. It can be noted that REEs ore contained 777 mg/kg La, 881 mg/kg Ce, 113 mg/kg Pr, 376 mg/kg Nd, 57 mg/kg Sm, 50 mg/kg Gd and 29 mg/kg Dy. Figure 1 shows SEM image and EDS elemental maps of REEs ore. It was observed that silicon [Si], iron [Fe], Potassium [K] and aluminium [Al] occupy the greater part of the ore. Because the detecting limit of EDS is about 1000 ppm, REEs were not detected.
Figure 2 shows the X-ray diffraction pattern of REEs ore. X-ray diffraction analysis indicated that quartz [SiO2],
kaolinite [Al2Si2O5(OH)4] and Gibbsite [Al(OH)3] were
the main crystalline phases and no crystalline structure of REEs was observed, suggesting that REEs concentration is below the detection limit. Chi and Tian3) reported that in the weathered crust elution-deposited rare earth ore, RE is mainly adsorbed on clay minerals 85% RE exists as ion phase, adsorbed by alumino-silicate mineral such as kaolinite and mica, which is a kind of RE carrier. So it was thought that REEs exist as ion phase into kaolinite in this sample.
3.2 REEs leaching using ammonium sulfide
Leaching ratio of REEs according to the concentration of (NH4)2SO4 is given in Fig. 3(a). Leaching time is 24 h and
S/L ratio is 0.1 (2 kg/20 L). In order to confirm effect of (NH4)2SO4, the sample was leached by distilled water. REEs
were not leached by (NH4)2SO4and leaching ratio of REEs is
about 0%. Leaching ratio of REEs increased with increasing the concentration of (NH4)2SO4 up to 3%; after that, it is
decreased with increasing the concentration of (NH4)2SO4.
When concentration of (NH4)2SO4 is 3%, the leaching ratio
of La is 59.9% and one of Pr is 62.8%, one of Nd is 69.5%, one of Sm is 74.4%, one of Gd is 47.3% and one of Dy is 51.6%. In case of Ce, in spite of high content in ore, leaching ratio by (NH4)2SO4 is just about 2.5%. Figure 3(b), on the
other hand, shows the concentration of leached impurities according to the concentration of (NH4)2SO4. K and Fe were
not leached and the concentration of Mn was not affected by concentration of (NH4)2SO4. The concentration of Al
increased, but Mg and Si decreased with increasing concen-tration of (NH4)2SO4. Although the highest leaching ratio is
indicated at 3% (NH4)2SO4, there is not big difference of
leaching ratio between 1 and 5%.
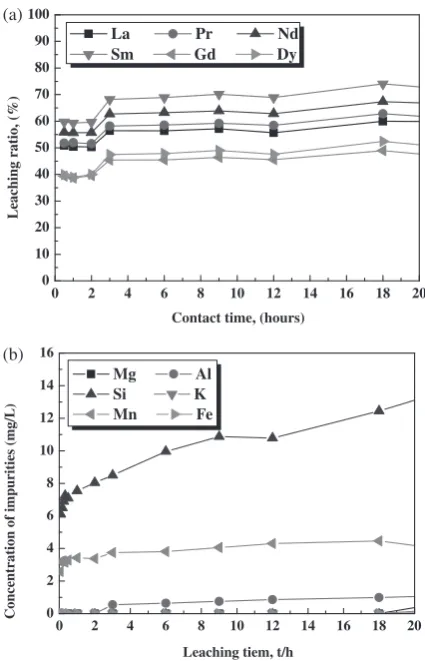
Figure 4 shows the leaching ratio of REEs and leaching concentration of impurities as a function of leaching time. Then, concentration of (NH4)2SO4 is kept at 1% and S/L
ratio was 0.1. There is difference between increasing rate, leaching ratio of increased with increasing leaching time, (Fig. 4(a)). In case of Sm, leaching ratio of Sm was 52.2% at 30 min leaching time. When leaching time was 3 h, one of Sm was 61.0%. And when leaching time was 18 h, one of Sm was 65.2%. Mg, K Fe were not leached. The concentration of Al, Si and Mn showed the same pattern, since these values increased continuously with increasing leaching time. When leaching time was 3 h, concentration of Al was 0.6 mg/L, one of Si was 8.0 mg/L and one of Mn was 3.7 mg/L. We found that these concentration increased by 1.0, 5.5 and 4.5 mg/L when leaching time was 18 h. Not only the leaching ratio of REEs increased with increasing leaching time, but also the concentration of impurities. Therefore, the optimum leaching time was 3 h.
A look at Fig. 5 shows that the leaching ratio of REEs; then, concentration of (NH4)2SO4was 1% and leaching time
[image:2.595.304.552.91.173.2]Dy was 47.0%. In case of the concentration of impurities, it was showed continuous increasing with increasing in S/L ratio. Considering the results, the authors suggest that leaching of REEs should be carried out at the S/L ratio range of about 0.09.
As results of leaching experiments, the optimum condition for leaching REEs from Vietnamese ore using by (NH4)2SO4
was like that; concentration of (NH4)2SO4 is 1%, leaching
time is 3 h and S/L ratio was 0.09.
3.3 REEs adsorption using phormidium
After leaching, the experiment of REEs adsorption was carried out by using phormidium. In the adsorption exper-imental, the leachate was produced after 18 h by using 2% (NH4)2SO4 at 0.09 S/L ratio. The adsorption density of
10 0 500 1000 1500 2000 2500 3000 3500 4000 4500 5000 5500
K GK K K
Q Q Q Q Q Q Q Q Q Q
Q
Intensity (cps)
Diffraction angle, 2-Theta [CuKα] Q Quart - SiO2
K Kaolinite - Al2Si2O5(OH)4 G Gibbsite - Al(OH)3
80 70 60 50 40 30 20
Fig. 2 X-ray diffraction pattern of REEs ore.
(b) O K
(a) SEM image
(c) Si Kα (d) Fe Kα
(e) K Kα (f) Al Kα
IMG1
100 µm 100 µm O K
Si K
100 µm 100 µm Fe K
K K
100 µm 100 µm Al K
α
[image:3.595.120.478.69.571.2] [image:3.595.61.278.614.768.2]phormidium on REE was compared with other adsorbents used generally including activated carbon, Fe-based adsorb-ent, Mn2O3 and calcinated dolomite (at 983 K for 5 min),
and the results are given in Fig. 6. The dosage of adsorbent was kept at 100 g/L, whereas the sample volume was 0.01 L. In addition, the adsorption was carried out for 30 min at about 298 K. The adsorption density of Mn2O3 is the lowest
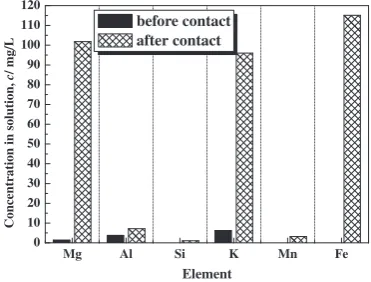
but one of other adsorbents is quite similar with one of phormidium. Especially, activated carbon shows the highest adsorption density; adsorption density of La is 409 mg/kg, one of Pr is 60 mg/kg, one of Nd is 231 mg/kg, one of Sm is 37 mg/kg, one of Gd is 20 mg/kg and one of Dy is 14 mg/kg. In case of phormidium, adsorption density of La is 375 mg/kg, one of Pr is 57 mg/kg, one of Nd is 217 mg/kg, one of Sm is 35 mg/kg, one of Gd is 20 and one of Dy is 14 mg/kg. These results proved the effectiveness of phormi-dium as an adsorbent for REEs. Additionally adsorption behavior of impurities was investigated. Figure 7 shows the concentration of impurities before and after contact with phormidium. It was noted that impurities don’t adsorbed onto phormidium. The other way, concentration of impurities increased after contact with phormidium, because impurities were leached from phormidium.
In previous experiment, it was confirmed that phormidium is a good adsorbent for adsorbing REEs. Next, the adsorption conditions of phormidium were investigated. Figure 8 shows the concentration of REEs after contacting phormidium as
a function of dosage of adsorbent; then, contact time was kept for 2 h, temperature was 293 K and pH was about 5.6. The concentration of REEs after contact with phormidium decreased with increasing the dosage of absorbent, in other words, adsorbed concentration increased. When dosage was 200 g/L, concentration after contact of La is 4.82 mg/L, one of Pr is 0.28 mg/L, one of Nd is 1.77 mg/L, one of Sm is 0.33 mg/L, one of Gd is 0.04 mg/L and one of Dy is 0.08 mg/L. About 4.8 mg/L La and 1.8 mg/L Nd were remained so far, but it was thought that this value was the limitation.
The concentration of REEs after contact with phormidium as a function of contact time was given in Fig. 9. When contact time was 120 min, the concentration of REEs except Nd was 0 mg/L, then one of Nd was 1.59 mg/L. Moreover it was found that adsorption was occurred for a short time at early stage. As a result of contacting for 30 min, the concentration of Gd and Dy was 0 mg/L and one of La was 7.00 mg/L, one of Pr was 0.60 mg/L and one of Sm was 0.10 mg/L. One of Nd was 2.35 mg/L.
Figure 10 shows adsorption density of REEs after contact with phormidium as a function of temperature. Then dosage of adsorbent was 200 g/L, contact time was 30 min and pH was 5.6. When temperature increased, adsorption density also increased. However the change was insignificant. Despite the changes of adsorption density of La and Nd are larger than other elements, the adsorption density of La was
0 0 10
Pulp density of leaching solution, (%)
0 0 2 4 6 8 10 12 14 16
Mg Al Si K Mn Fe
Concentration of impurities (mg/L)
Concentration of ammonium sulfate (%)
(b)
20 18 16 14 12 10 8 6 4 2
20 18 16 14 12 10 8 6 4 2
Fig. 3 Leaching ratio of REEs (a) and leaching concentration of impurities
(b) according to the concentration of ammonium sulfate, (Experimental conditions: Leaching time: 24 h;S/L ratio: 1/10;Temperature: 293 K).
0 0 10
Contact time, (hours)
0 0 2 4 6 8 10 12 14 16
Leaching tiem, t/h
Concentration of impurities (mg/L)
Mg Al
Si K
Mn Fe
(b)
20 18 16 14 12 10 8 6 4 2
20 18 16 14 12 10 8 6 4 2
Fig. 4 Leaching ratio of REEs (a) and leaching concentration of impurities
[image:4.595.319.532.71.402.2] [image:4.595.63.276.72.398.2]changed 295 to 329 mg/kg and one of Nd was changed 182 to 193 mg/kg according as temperature was changed from 293 to 373 K. Considering energy for raising temperature, controlling temperature is not necessary to adsorb REEs.
Finally, effect of pH was investigated. Adsorption density of phormidium on REEs as a function of pH was given in Fig. 11. During this set of experiments, dosage of adsorbent was 200 g/L, contact time was 30 min and temperature was 293 K. At pH 1, the adsorption density of La was 63 mg/kg, one of Pr was 15 mg/kg, one of Nd was 61 mg/kg, one of Sm
was 12 mg/kg and all one of Gd and Dy was 4 mg/kg. Adsorption density was increased sharply from pH 1 to pH 2 and this value was equilibrium from pH 2. When pH was 5.6, adsorption density of La was 335 mg/kg, one of Pr was 50 mg/kg, one of Nd was 193 mg/kg, one of Sm was 0.02 0 10 20 30 40 50 60 70 80 90 100
La Pr Nd
Sm Gd Dy
Leaching ratio, (%)
S/L ratio, (-)
(a) 0.02 0 1 2 3 4 5 6 7 8 9 10
S/L ratio (g/L)
Concentration of impurities (mg/L)
Mg Al
Si K
Mn Fe
(b) 0.22 0.20 0.18 0.16 0.14 0.12 0.10 0.08 0.06 0.04 0.22 0.20 0.18 0.16 0.14 0.12 0.10 0.08 0.06 0.04
Fig. 5 Leaching ratio of REEs (a) and leaching concentration of impurities
(b) according to S/L ratio, (Experimental conditions: ammonium sulfate concentration: 1%;Leaching time: 3 h;Temperature: 293 K).
0 50 100 150 200 250 300 350 400 450 La Pr Nd Sm Gd Dy Calcined dolomite Mn2O3
Fe-based adsorbent Activated carbon Adsor ption density , q / mg/kg Phormidum
Fig. 6 Adsorption density of each adsorbent on REEs, (Experimental
conditions: Dosage of adsorbent: 100 g/L;Contact time: 30 min; Temper-ature: 293 K).
Mg 0 10 20 30 40 50 60 70 80 90 100 110 120
Concentration in solution,
c / mg/L Element before contact after contact Fe Mn K Si Al
Fig. 7 Concentration of impurities before and after contact with
phormi-dium, (Experimental conditions: Dosage of adsorbent: 100 g/L;Contact
time: 30 min;Temperature: 293 K).
0 0 5 10 15 20 25 30 35 40
Concentration after contact (mg/L)
Dosage of adsorbent (g/L)
La Pr Nd Sm Gd Dy 200 180 160 140 120 100 80 60 40 20
Fig. 8 Concentration of REEs after contact with phormidium as a function
of dosage of adsorbent, (Experimental conditions: Contact time: 120 min; Temperature: 293 K;pH: 5.6).
0 0 5 10 15 20 25 30 35 40 45
Concentration after contact (mg/L)
Contact time, t/min
La Pr Nd Sm Gd Dy 120 100 80 60 40 20
Fig. 9 Concentration of REEs after contact with phormidium as a function
[image:5.595.333.519.74.215.2] [image:5.595.64.274.74.393.2] [image:5.595.319.531.277.439.2] [image:5.595.66.273.457.607.2] [image:5.595.319.532.502.666.2]33 mg/kg, one of Gd was 18 mg/kg and one of Dy was 13 mg/kg. Because the initial pH in leachate was 5.6, controlling pH is not necessary to adsorb REEs.
4. Discussions
4.1 Adsorption isotherm of Nd ion onto the phormidium
Kinetic studies involve effect of major parameters such as adsorbent dosage and contact time on the uptake of REEs by phormidium. The production volume of Nd has dramatically increased since the development of a Nd-Fe-B permanent magnet, which had the strongest magnet power, in the 1980s. Presently, more than 10,000 tons of Nd-Fe-B alloy magnets are annually produced in Japan. Therefore, the kinetic studies were focused on Nd ion.8,9) Adsorbent dosage has a great
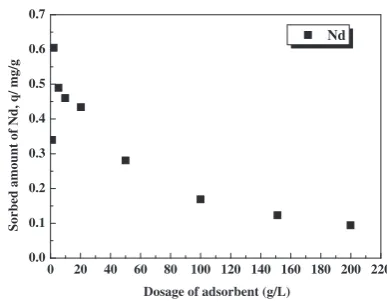
influence on the biosorption process and determines the potential of sorbent through the number of binding sites available to remove metal ions at an initial concentration.10) Figure 12 shows the adsorption density of Nd ions as a function of dosage of phormidium. In this test, the initial Nd concentration (20.6 mg/L) and the pH value (pH 5.6) were kept constant. The dosage of phormidium was tested at between 1 and 200 g/L. At a given equilibrium
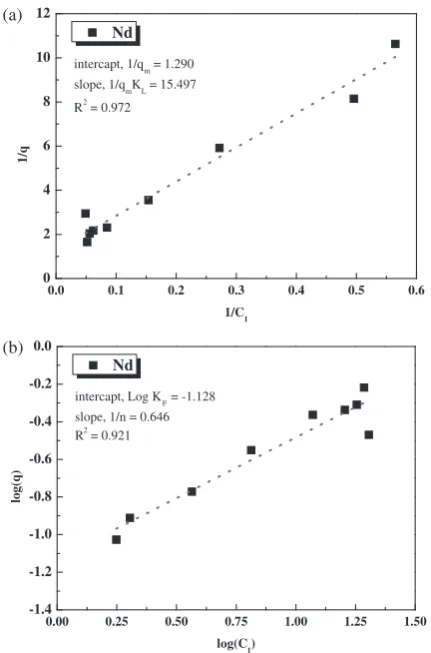
concen-tration, the phormidium took up more Nd ions at lower than at higher cell densities. Adsorption density is the highest, 610 mg/kg at 2 g/L of phormidium dosage. This result can be due to the concentration gradient between the sorbent and the adsorbate, an increase in phormidium concentration causes a decrease in the amount of metal adsorbed onto a unit weight of the phormidium. Moreover, the increase in biosorption of metals by increasing the biomass dosage is due to an increase in the number of active sites and available surface area. Generally speaking, the analysis of the isotherm data is important to develop an equation, which could represent the results and be used for designing purposes. Sorption models were chosen for comparison with experimental data. The Langmuir model which was characterized by linear adsorption at low surface coverage:11)
1
q ¼
1
qmKL
1
C1
þ 1
qm
ð2Þ
where qm is he maximum capacity of the adsorbent for
adsorbate (mass adsorbate/mass adsorbent, mg/g); and KL
(L/mg) is a measure of affinity of adsorbate for adsorbent. Figure 13(a) shows 1=q versus 1=C1 for adsorption of Nd
ions onto the phormidium. The data have then been extrapolated using the least-squared linear regression in order to calculate the maximum capacity of the adsorbent (qm). The experimental date were well fitted to the linear
form of Langmuir equation, (eq. (2)) with a correlation coefficient R2¼0:972, indicating the applicability of the
model. It was found that the Langmuir isotherm gives qm¼775mg/kg andKL ¼0:083L/mg, (Fig. 13(a)).
Freundlich model has generally been considered an empirical relationship and has been used widely to fit experimental data.12) The linearized form of Freundlich
isotherm is given as, (eq. (3)):
lnq¼lnKFþ
1
nlnC1 ð3Þ
whereKF (mg/g), which indicates the adsorption capacity,
and n is empirical constant. The value of n indicates a favorable adsorption for1<n<10.
lnðqÞ versus lnðC1Þ for adsorption of Nd onto the
phormidium was indicated in Fig. 13(b). The data have then 290
0 50
Adsor
Temperature, T/K
[image:6.595.327.521.70.221.2]360 350 340 330 320 310 300
Fig. 10 Concentration of REEs after contact with phormidium as a
function of temperature, (Experimental conditions: Dosage of adsorbent:
200 g/L;Contact time: 30 min;pH: 5.6).
1 0 50 100 150 200 250 300 350 400 450 500
La Pr Nd
Sm Gd Dy
Adsor
ption density
,
g
/ mg/kg
pH
[image:6.595.62.277.71.234.2]8 7 6 5 4 3 2
Fig. 11 Adsorption density of phormidium on REEs as a function of pH,
(Experimental conditions: Dosage of adsorbent: 200 g/L;Contact time:
30 min;Temperature: 293 K).
0 0.0
Dosage of adsorbent (g/L)
220 200 180 160 140 120 100 80 60 40 20
Fig. 12 Concentration of Nd ion after contact with phormidium as a
function of dosage of adsorbent, (Experimental condition: Contact time:
[image:6.595.61.278.293.457.2]been extrapolated using the least-squared linear regression in order to calculateKFandn. It was found that the Freundlich
isotherm gives KF¼74mg/kg and n¼1:548, (Fig. 2(b)).
Regression correlation coefficients for Nd ions is very high. Especially, the experimental data fitted better the shape of the Langmuir isotherms with high values of theR2.
4.2 Adsorption kinetics of REEs onto the phormidium
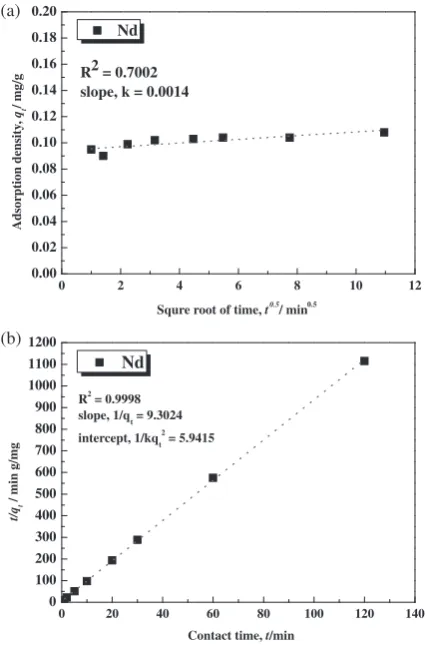
The rate of adsorption is a very important factor in the reactor design and the optimization process in industry. The effect of contact time on the equilibrium uptake of Nd ions on the phormidium is shown in Fig. 14. According to this figure, adsorption density increased with increasing contact time and almost 82% of Nd was adsorbed by dried phormidium in the first 1 min of contact time. This behavior suggests that the sorption takes place rapidly on the external surface of the adsorbent where the binding may be through interaction with the functional groups located on the surface of the adsorbent.
Kinetic study provides valuable information about the mechanism of adsorption and subsequently investigation of the controlling mechanism of the biosorption process as either mass transfer or chemical reaction in order to obtain the optimum operating conditions for industrial-scale batch processes.10,13)Many adsorption kinetic models have been reported. The intraparticle diffusion model14) and the pseudo-second-order kinetic15) are among the most widely
applied.11)
A functional relationship common to most treatments of intraparticle diffusion is that uptakeqtvaries almost with the square root of timet0:5. The linear form of the intraparticle
diffusion equation is given as:
qt¼kit0:5 ð4Þ
where ki is the intraparticle diffusion rate constant, (mg/
g min0:5).tis the contact time (in min). Thekivalue is then
calculated from the slope of the straight line. Figure 15(a) shows the intraparticle diffusion plot, which do not pass through the origin, indicating that the intraparticle diffusion is not the only operative mechanism. As it can be seen in Fig. 15(a), the external surface adsorption (i.e. the first portion or segment of the plot) is absent; apparently it is completed before the first 5 min. It was found that the correlation coefficientR2 was 0.7002 and this value was not
as great as might have been expected.
The pseudo-second-order model considers that the rate of occupation of biosorption sites is proportional to the square of the number of unoccupied sites (eq. (5)):
dqt
dt ¼kðqeqtÞ
2 ð5Þ
where qe (mg/g) is the amount of metal ion sorbed at
equilibrium, qt (mg/g) shows uptake capacity at t and k (g/mg min) shows the equilibrium rate constant of pseudo-second-order adsorption. After being integrated and rear-ranged, (eq. (6)):
t qt
¼ 1
kq2
e
þ 1
qe
t ð6Þ
wherekandqecan be determined from the linear plot oft=qt versust.15)
Figure 15(b) shows a plot of eq. (6) for the sorption of Nd using phormidium. The results indicate a very significant linear relationship between t=qt and t, with very high correlation coefficient, R2, it was found that the pseudo-second-order reaction givesqe¼108mg/kg andk¼0:0146
kg/mg min.
This sorption system was better described by pseudo-second-order rate equation than by intraparticle diffusion model. The perfect fit of the experimental data indicates the applicability
0 0.00 0.02 0.04 0.06 0.08 0.10 0.12
Nd
Sorbed amount of Nd,
q
/ mg/g
Contact time, t/min
[image:7.595.61.277.71.398.2]140 120 100 80 60 40 20
Fig. 14 Concentration of REEs after contact with phormidium as a
function of contact time,(Experimental condition: Dosage of adsorbent:
200 g/L;Temperature: 293 K;pH: 5.6).
0.0
0 2 4 6 8 10 12
intercapt, 1/qm = 1.290
slope, 1/qmKL = 15.497 R2
= 0.972
Nd
1/q
1/C1 (a)
0.00
-1.4 -1.2 -1.0 -0.8 -0.6 -0.4 -0.2 0.0
intercapt, Log KF = -1.128
slope, 1/n = 0.646 R2 = 0.921
Nd
log(q)
log(C1) (b)
0.6 0.5 0.4 0.3 0.2 0.1
1.50 1.25 1.00 0.75 0.50 0.25
Fig. 13 Linear graph of (a) the Langmuir isotherm and (b) the Freundlich
isotherm (Experimental condition: Contact time: 120 min;Temperature:
[image:7.595.320.528.74.225.2]of the pseudo-second-order kinetic model for the adsorption of the Nd ions onto the phormidium. The pseudo-second-order kinetics indicates that the adsorption of Nd onto adsorbent is involved in a rate determining step, which might be a chemical sorption or chemisorption.9,16)And the sorption
takes place rapidly on the external surface of the adsorbent where the binding may be through interaction with the functional groups located on the surface of the adsorbent.
5. Conclusions
As results of leaching experiments, the optimum con-ditions for leaching of REEs were: (1) concentration of
Acknowledgments
This study was supported in part through contract research from Japan Oil, Gas and Metals National Corporation (JOGMEC), JST Crest of Innovation Technology and System for Sustainable Water Use Research area (Shibusawa group) and JSPS Scientific Research (A), No. 22246118.
REFERENCES
1) K. A. Gschneidner and L. Eyring: Handbook on the physics and
chemistry of rare earths, (Elsevier, 2001).
2) G. B. Haxel, J. B. Hedrick and G. J. Orris:Rare earth elements critical
resources for high technology, (Reston (VA): United States Geological Survey, 2006).
3) R. Chi and J. Tian:Weathered Crust Elution-Deposited Rare Earth
Ores, (Nova Science Publishers, Inc., New York, 2008).
4) J. Tian, Y. Jingqun, C. Ruan, R. Guohua, J. Mintao and O. Kexian:
Hydrometallurgy101(2010) 166–170.
5) E. Romera, F. Gonzalerz, A. Ballester, M. L. Blazquez and J. A.
Munoz: Bioresource Technol.98(2007) 3344–3353.
6) D. H. Cho and E. Y. Kim: Bioprocess Biosyst. Eng.25(2003) 271–277.
7) P. A. Marques, H. M. Pinheiro, J. A. Teixeira and M. F. Rosa:
Desalination124(1999) 137–144.
8) M. Sagawa: Mater. Japan40(2001) 943–946.
9) O. Takeda, T. H. Okabe and Y. Umetsu: J. Alloy. Compd.408–412
(2006) 387–390.
10) M. M. Montazer-Rahman, P. Rabbani, A. Abdolali and A. R. Keshtkar:
J. Hazard. Mater.185(2011) 401–407.
11) G. Dodbiba, T. Fujita, T. Kikuchi, J. Manjanna, S. Matsuo, H.
Takahashi and K. Tohji: Chem. Eng. J.166(2011) 496–503.
12) F. Luo, Y. Liu, X. Li, Z. Xuan and J. Ma: Chemosphere64(2006)
1122–1127.
13) B. Alytiz and S. Veli: J. Hazard. Mater.167(2009) 482–488.
14) J. Crack:The Mathematics of Diffusion, (Clarendon Press, Oxford,
1979).
15) H. Pahlavanzadeh, A. R. Keshtkar, J. Safdari and Z. Abadi: J. Hazard.
Mater.175(2010) 304–310.
16) J. S. Ho and G. A. McKay: Trans. Int. Chem. Eng.768(1998) 332–
340.
0
0.00 0.02
Squre root of time, t0.5 / min0.5
0
0 100 200 300 400 500 600 700 800 900 1000 1100 1200
Nd
t/q
t
/ min g/mg
Contact time, t/min R2 = 0.9998
slope, 1/qt = 9.3024
intercept, 1/kqt 2
= 5.9415 (b)
12 10 8 6 4 2
[image:8.595.62.276.73.398.2]140 120 100 80 60 40 20
Fig. 15 (a) Intraparticle diffusion kinetics and (b) Pseudo-second order