Effect of Rare-Earth Elements Y and Dy on the Deformation Behavior
of Mg Alloy Single Crystals
Seiji Miura
*1, Shigeki Imagawa
*2, Takeshi Toyoda
*3, Kenji Ohkubo and Tetsuo Mohri
Division of Materials Science and Engineering, Graduate School of Engineering, Hokkaido University, Sapporo 060-8628, Japan
Effect of rare-earth elements (Y and Dy) on the mechanical properties of Mg solid solution single crystal is investigated. Comparing with the effect of other elements reported by previous studies, the solid solution strengthening by Y and Dy are much higher than that of other additives such as Zn for basal slip operation, while the isotropic strain by Zn atoms is higher than those of Y and Dy. Strain-rate changing tests were conducted for a further understanding of the dislocation motion and it revealed that the activation volumes estimated for Mg alloys with Y and Dy are much smaller than that of Zn-added alloy, while the activation enthalpy is almost the same. It was confirmed that the high strengthening effect by Dy addition is also found by Y addition, while the elastic interaction based on neither isotropic or anisotropic distortion are sufficient to explain the origin of the strengthening effect by Y and Dy addition. [doi:10.2320/matertrans.MC2007109]
(Received October 22, 2007; Accepted February 18, 2008; Published April 9, 2008)
Keywords: solid solution hardening, activation volume, activation enthalpy, lattice constant
1. Introduction
For the development of high performance Mg alloys, addition of rare-earth elements has been thought to be one of the most effective routes with enough amount of precip-itates.1–4)Although Y is not included in Lanthanoid group, it is generally classified as one of the rare-earth elements because of the similarity of physical properties with Lanthanoid group elements. The effect of Y on the creep behavior of Mg polycrystals have been also investigated and the improvement of creep properties by Y addition is significant.5,6) Recently, Mg-Y-Zn alloys attract a broad attention because they attain an excellent high strength without the loss of ductility.7,8) As the Mg solid solution in the alloy is strengthened by Y and Zn, it is important to understand the effect of Y addition on the deformation behavior of Mg crystals for further improvement of this alloy group.
Ninomiyaet al.evaluated the effect of rare-earth elements on the Vickers hardness of Mg alloys. They found that the effect of atomic radius of rare-earth elements is much higher than that of Ca, Al and Zn.9)Similar tendency was also found in the deformation of Mg alloy single crystals by present authors.10)In the present study, the mechanical behavior of Mg-Y single crystals deformed by the basal slip system is studied and compared with that of Mg-Dy and Mg-Zn alloys previously reported by authors.10)
2. Experimental Procedures
For obtaining a homogeneous single crystal ingot of Mg-1.0 at%Y, a certain amount of pure Mg was first melted in a Bridgman-type crucible made of high purity graphite placed in an induction heater under an Ar atmosphere, and immediately solidified in the crucible. For addition of Y, a
Mg-8.1 at%Y ingot prepared by casting was set on the pure Mg in the Bridgman-type crucible and a single crystal alloy was grown by Bridgman method with a growth rate of 2 mm/hr. After the crystallographic orientation determina-tion using back-Laue method and electron back scattering diffraction method, a homogenization treatment was con-ducted at 773 K for 24 hrs in a glass tube filled with Ar gas. Compression test specimens with a dimension of about
448mm3 were cut by wheel cutter from an ingot. The
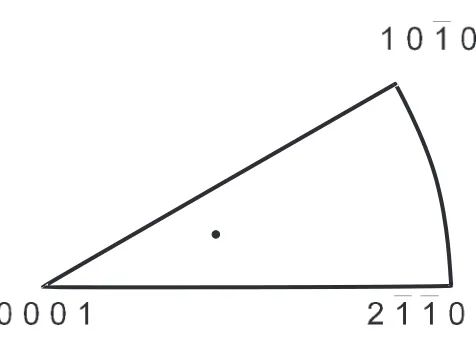
stress axis of compression test specimens is shown in Fig. 1. All the specimens were subjected to a cyclic annealing (523 K–623 K, 2 hrs for a cycle, 5 cycles) to eliminate dislocations introduced during specimen preparations, fol-lowed by a solution treatment at 723 K for 6 hrs. Oxides on the specimen surface were removed by 20%HNO3-H2O
solution. Compression tests were conducted using an Instron testing machine at a temperature range from 77 K to 473 K with a strain rate of 2:3104s1. Strain-rate changing
tests were also conducted to understand the nature of dislocation motion. Lattice parameters along a-axis and
c-axis of a Mg-2 at%Y ingot, which was homogenized at 823 K for 24 h followed by quenching, were also evaluated
Fig. 1 The stress axis for the compression tests.
*1Corresponding author, E-mail: [email protected]
*2Undergraduate Student, Hokkaido University
*3Graduate Student, Hokkaido University
[image:1.595.308.546.317.486.2]using XRD. The composition of the ingot was confirmed using X-ray fluorescence analysis.
3. Results and Discussion
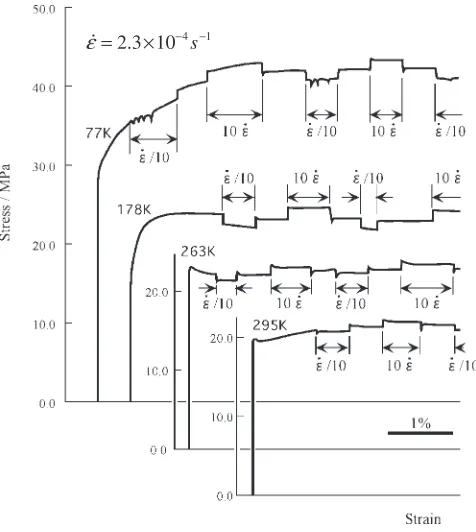
By the slip trace analysis, it was confirmed that the basal slip system operates at all the test conditions. Stress-strain curves at several test temperatures are shown in Fig. 2. Within the compression strain range in the present study, no significant strain hardening was observed and an easy glide region is recognized in all the stress-strain curves, regardless of the test temperature. As seen in all the curve tested, a transition region with a yield drop is recognized when the strain rate is increased. For the following analysis the stress at the steady-state deformation after the yield drop was employed. At 473 K, a serrated flow was observed in the present Mg-Y alloy. Similar behavior was also observed in Mg-Dy and Mg-Zn alloys,10) and Cu-Al alloys12) at the similar T/Tm range (Tm is the melting point of alloy), presumably due to the solute dragging motion of dislocations. Figure 3 shows the temperature dependence of the critical resolved shear stress (CRSS) calculated from the 0.2% flow stress with the nominal strain rate, together with the data reported previously.10,11)The CRSS decreases with increas-ing temperature, and at a temperature range higher than room temperature, the temperature dependence of the strength becomes very small.
According to the classical solid-solution strengthening model, the isotropic strain introduced by a solute atom is primarily important. In order to clarify the effect of the lattice strain on the solution strengthening by additives on the basis of the isotropic strain model, an average lattice strain for Mg alloys is evaluated by using following equation:
"a¼ j"0j ¼ ln
aVaVcV
aMaMcM
1=3
( )
¼ ln
aMþ
da dX
2
cMþ
dc dX
aMaMvM
0 B B B @
1 C C C A
1=3
8 > > > > < > > > > :
9 > > > > = > > > > ;
; ð1Þ
¼ 2
3ln 1þ 1
aM
da dX
þ1
3ln 1þ 1
cM
dc dX
[image:2.595.49.287.71.337.2]
where a andc are lattice parameters of a-axis and c-axis, respectively, and V andM mean additive element and Mg, respectively.Xis the concentration of a solute element.
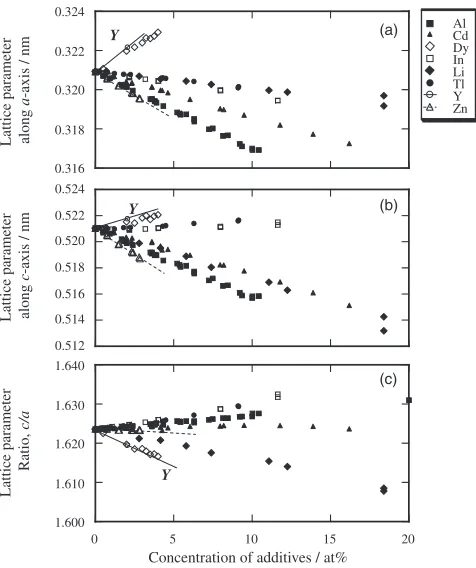
Figure 4 shows the change in the lattice parameters along
a-axis and c-axis, and the lattice parameter ratio c=a with addition of solute elements.10,13–17) In the present study the lattice parameters of an ingot with a composition of Mg-2.04 at%Y were evaluated. From the slope of the lattice parameters ofa-axis andc-axis it is obvious that the effect of Y on the lattice parameters is similar to that of Dy, and the absolute values of the isotropic strain of Y and Dy are rather smaller than that of Zn, while the change in c=a is much larger. As the strengthening by distortion is proportional to
ð"aÞ3=2in the classical theory, the relationship betweenð"aÞ3=2
and the solution strengthening per one percent of a solute,
d=dX, at room temperature is shown in Fig. 5. Previous data obtained by using single crystal Mg alloys are also shown in the figure.11,18) According to the previous data, the solid solution hardening of Mg alloys containing Tl, In, Cd, Al and
Zn10,11,18)can be explained by adopting the isotropic strain
model. On the other hand, the effect of rare-earth elements, Y and Dy, on solution strengthening is tremendously higher than other elements including Zn and it is obvious that the isotropic strain model is not suitable to explain the strengthening by rare-earth elements.
In order to examine the details of the dislocation motion, stain rate sensitivity of the yield stress is investigated through the strain-rate changing tests to evaluate the activation volume and the activation energy for the deformation. The applied stressconsists of the athermal componentathermal and the thermal componentðT;_Þ,
1 4 − − = 2.3×10 s ε
Fig. 2 Stress-strain curves of Mg-Y single crystals at several test temperatures.
0.0 2.0 4.0 6.0 8.0 10.0 12.0 14.0 16.0 18.0 20.0
0 100 200 300 400 500
Temperature / K
CRSS / MP
a
0.5Dy(10) 1.0Y 0.5Zn(10) 0.45Zn(11) 0.15Zn(11) pure Mg(11)
[image:2.595.310.548.76.235.2] [image:2.595.332.551.288.413.2]¼athermalþðT;_Þ; ð2Þ
where T is the temperature and _ the shear strain rate. Although the serrated flows observed in some of the samples at high temperature range may affect the accuracy, the values of the athermal componentathermalfor Mg-1.0Y, Mg-0.5Dy and Mg-0.5Zn alloys were estimated to be 9.5 MPa, 2.7 MPa and 1.5 MPa, respectively. As relatively higher stacking fault energy is expected for the Mg alloy with rare-earth elements than for Mg-Zn alloy,19)Suzuki effect20)or the strengthening by dipoles formed by the cross-slip of dislocations21) may be responsible for the higher athermal value for Mg-Dy and Mg-Y alloys.
From the measurements of the change in flow stress by strain-rate changing tests, the activation volumeV and the activation enthalpyHare evaluated by following equations:
V ¼kT @ln _
@
T
; ð3Þ
H¼ TV @
@T
_
; ð4Þ
where k is the Boltzmann constant. The results of V were shown in Fig. 6 with the recalculated results of Mg-0.5Dy and Mg-0.5Zn alloys. V at ¼0 is about 2000 b3 for Mg-1.0Y and V for Mg-0.5Dy is higher than 2000 b3, while V for Mg-0.5Zn is higher than 3000 b3.
Akhtar and Teghtsoonian estimated V to be 3000 b3 for
Mg-0.45Zn,11)which is in good agreement with the present results. However, a large scatter of calculated values forH
can be recognized in Fig. 7. This is attributed to a small experimental errors, but theHfor Mg-1.0Y alloy seems to be rather smaller than those of other alloys.
Generally, smaller V means a larger interaction of dis-location with obstacles. Basinski showed experimentally that the higher the flow stress the lower the activation volume of
Y
Dy
Zn
0.0 2.0 4.0 6.0 8.0 10.0
0.0 0.1 0.2 0.3 0.4
Al Cd Dy In Li Tl Y Zn
d
τ
/dX / MP
a
/at.%
ε
03/2Fig. 5 The relationship betweenð"aÞ3=2and the solution strengthening per
one percent of a solute, d=dX, at room temperature. Previous data obtained by using single crystal Mg alloys are also shown.
0 500 1000 1500 2000 2500 3000
0.0 2.0 4.0 6.0 8.0
0.5Dy(10)
1.0Y 0.5Zn(10)
Acti
v
ation v
olume,
v
/ b
3
Thermal stress,
τ
/ MPaFig. 6 The dependence of the activation volume on the thermal stress.
0 5 10 15 20
Concentration of additives / at%
Lattice parameter along
a
-axis / nm
Lattice parameter along
c
-axis / nm
Lattice parameter
Ratio,
c/a
1.600 1.610 1.620 1.630 1.640 0.512 0.514 0.516 0.518 0.520 0.522 0.524 0.316 0.318 0.320 0.322 0.324
Al Cd Dy In Li Tl Y Zn
Y
Y
Y (a)
(b)
(c)
Fig. 4 The change in (a) the lattice parameters alonga-axis and (b)c-axis, and (c) the lattice parameter ratioc=a with addition of various solute elements.10,13–17)
0 20 40 60 80 100 120 140
0.0 1.0 2.0 3.0 4.0
0.5Dy(10)
1.0Y
0.5Zn(10)
Acti
v
ation Enthalp
y,
H
/ kJ
mol
-1
Thermal stress, τ / MPa
[image:3.595.50.288.71.355.2] [image:3.595.309.546.76.257.2] [image:3.595.307.546.304.484.2] [image:3.595.50.289.416.577.2]Cu-based solid solution alloy single crystals.22) This is consistent with the present results on Y added alloy. Although strengthening by solid solution in metallic crystals has been explained mainly in terms of the atomic size effect, the isotropic strain model may not explain the solid solution strengthening of Mg as shown in Fig. 5. In metals with the hcp structure, the lattice parameters alonga-axis andc-axis change with the solute atom concentration independently, which reflects an anisotropic distortion by solute atoms. Such an anisotropic distortion around solute atoms also may affect the plastic deformation behavior through the additional interaction with not only edge but also screw dislocations as has been pointed out for bcc-Fe with interstitial C atoms.23) The anisotropic distortion model was also applied to explain the effect of off-stoichiometry on the strength of Ni3Al
intermetallic compound.24)As can be seen in Fig. 4, Dy and Y have relatively large change in c=a and the effect of anisotropic tetragonal distortion on the interaction between solute atom and edge dislocation is examined. Assuming the slip plane (0001) is denoted as xz-plane and y-axis corresponds to [0001]c-axis, the distortions can be estimated as follows because the solute atom changes the lattice parameters alonga-axis andc-axis independently;
"x¼"z¼ln
aV
aM
¼ln 1þ 1
aM
da
dX
; ð5Þ
"y¼ln
cV
cM
¼ln 1þ 1
cM
dc dX
: ð6Þ
Also a ratio of c=a, referred to as a distortion ratio , is employed to evaluate the effect of anisotropic tetragonal distortion around solute atoms, which changec=aratio of Mg lattice, on the interaction between edge dislocation and solute atoms. The distortion ratiois defined as follows:
¼ cV
aV
cM
aM
¼ 1þ 1
cM
dc dX
1þ 1
aM
da dX
: ð7Þ
Then the distortions can be rewritten by the distortion ratio and the average lattice strain"0as follows;
"x¼"z¼ln
aVaVcV
aMaMcM
cM=aM
cV=aV
1=3
( )
¼"0
1
3ln; ð8Þ
"y¼ln
aVaVcV
aMaMcM
cV=aV
cM=aM
2!1=3
8 < :
9 =
;¼"0þ
2
3ln: ð9Þ
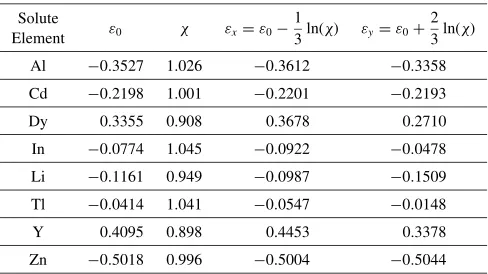
The evaluated values for"0,and tetragonal strains,"xand
"y, of various elements are shown in Table 1. The distortion
ratiois close to unity regardless of the solute element, and
lnis much smaller than the absolute value of the average lattice strain"0even for Y and Dy, which shows a relatively
large change inc=aratio. Moreover, the absolute value of the average lattice strain"0of Zn is far much larger than"xand"y of Y and Dy, and it is clear that the effect ofis not sufficient to explain the strengthening effect by Y and Dy addition quantitatively.
In this calculation the effect of the change in the elastic constants by solute atoms is not taken into account. Although some combined parameters to take the both effects of strain and elastic modulus change into account,25)it was reported that there is no difference in Young’s modulus of pure Mg
and various commercial Mg alloys. It is noted that the elastic stiffness of pure Zn having a lower melting point (420C) than those of Mg (650C), Dy (1412C) and Y (1522C) is higher than those of Mg, Dy and Y.26,27) This implies that the effect of elastic constants is not significant for explaining the strengthening of Mg. For the further understanding, an theoretical approach based on such as the molecular dynamics should be applied to obtain an answer whether the elastic interaction between a dislocation and a single solute atom is the essential for the strengthening of Mg alloys by solute atoms. Ninomiya et al. applied the Mk parameter, which is an s-orbital energy level existing above the Fermi energy level of the cluster and has a correlation to the atomic radius, to explain the strengthening of Mg by various solute elements.9)Although the correlation of the Vickers hardness with a parameter derived from theMkparameters is reported to be good, it doesn’t provide an explanation of the higher strengthening effect by Y addition because theMkfor Y in Mg is rather smaller than that for Zn. Although above discussion is based on the interaction of dislocation with a single solute atom, Marukawa recently proposed a new model of solution hardening in fcc metals based on the interaction of a dislocation with plural solute atoms in a single activation event.28) The model explains a larger interaction, and an investigation on the difference in the distribution of elements or the lattice scale structures such as a short-range ordering in Mg solid solution with various solute elements may be needed to confirm such contribution. Suzukiet al. reported that the creep properties of Mg is improved by Y addition.5,6) They found non-basal slip operation which acts as the forest dislocations for primary slip systems, and also found cross-slip motion of a-dislocation on basal slip at high temperature. Also it was pointed out by Akhtar and Teghtsoonian that the dislocation density in Mg-Zn single crystals increases with solute concentration.11) The nature of dislocations is also needed to be clarified by TEM observations.
4. Conclusions
[image:4.595.305.549.93.230.2]Effect of rare-earth elements (Y and Dy) on the mechanical properties of Mg solid solution single crystal is investigated. Comparing with the effect of other elements reported by previous studies, the solid solution strengthening by Y and Dy are much higher than that of other additives such as Zn for
Table 1 The evaluated values for"0,and tetragonal strains"xand"y, of
various elements.
Solute
Element "0 "x¼"0
1
3lnðÞ "y¼"0þ 2 3lnðÞ
Al 0:3527 1.026 0:3612 0:3358
Cd 0:2198 1.001 0:2201 0:2193
Dy 0.3355 0.908 0.3678 0.2710
In 0:0774 1.045 0:0922 0:0478
Li 0:1161 0.949 0:0987 0:1509
Tl 0:0414 1.041 0:0547 0:0148
Y 0.4095 0.898 0.4453 0.3378
basal slip operation, while the isotropic strain by Zn atoms is larger than those by the rare-earth elements. Strain-rate changing tests revealed that the activation volumes estimated for Mg alloys with Y and Dy are much smaller than that of Zn-added alloy, which implies larger interaction between a dislocation and a solute atom. The elastic interaction based on isotropic or anisotropic distortion strains by solute atoms are evaluated, and it is concluded that these strains are insufficient to explain the strengthening effect by Y and Dy addition quantitatively.
REFERENCES
1) S. E. Bohn: Light metals (1955) 268–271.
2) K. H. Eckelmeyer and R. W. Hertzberg: Met. Trans.1(1970) 3411– 3414.
3) S. Kamado, S. Iwasawa, K. Ohuchi, Yo Kojima and R. Ninomiya: J. Japan Inst. Light Metals42(1992) 727–730.
4) T. Sato, I. Takahashi, H. Tezuka and A. Kamio: J. Japan Inst. Light Metals42(1992) 804–810.
5) M. Suzuki, H. Sato, K. Maruyama and H. Oikawa: Mat. Sci. Eng. A252
(1998) 248–255.
6) M. Suzuki, H. Sato, K. Maruyama and H. Oikawa: Mat. Sci. Eng. A319
(2001) 751–755.
7) Y. Kawamura, K. Hayashi, A. Inoue and T. Masumoto: Mat. Trans.42
(2001) 1172–1176.
8) E. Abe, Y. Kawamura, K. Hayashi and A. Inoue: Acta Mat.50(2002) 3845–3857.
9) R. Nimomiya, H. Yukawa, M. Morinaga and K. Kubota: J. Alloys Comp.215(1994) 315–323.
10) S. Miura, S. Yamamoto, K. Ohkubo and T. Mohri: Materials Science Forum350–351(2000) 183–188.
11) A. Akhtar and E. Teghtsoonian: Acta Met.17(1969) 1339–1349. 12) H. Suzuki and E. Kuramoto: Trans. JIM9(1968) supplement, 697–702. 13) G. V. Raynor: Proc. Roy. Soc. London A174(1940) 457–471. 14) F. Foote and E. R. Jette: Trans. AIME143(1941) 124–133. 15) G. V. Raynor: Proc. Roy. Soc. London A180(1942) 107–121. 16) G. V. Raynor:The Physical Metallurgy of Magnesium and Its Alloys,
(Pergamon Press, 1959, London).
17) P. Villars and L. D. Calvert:Pearson’s handbook of Crystallographic data for intermetallic phases, (American Society for Metals, Metals Park, OH, 1985).
18) E. D. Levine, W. F. Sheely and R. R. Nash: Trans. Met. Soc. AIME215
(1959) 521–526.
19) B. Legrand: Phil. Mag. B49(1984) 171–184.
20) H. Yoshinaga and R. Horiuchi: Trans. JIM4(1963) 134–141. 21) P. B. Hirsch and J. S. Lally: Phil. Mag.12(1965) 595–648. 22) Z. S. Basinski, R. A. Foxall and R. Pascual: Scripta Met.6(1972)
807–814.
23) A. W. Cochardt, G. Shoeck and H. Wiedersich: Acta Met.3(1955) 533. 24) S. Miura, S. Takizawa, T. Suzuki, Y. Mishima and T. Mohri: Acta Mat.
53(2005) 5175–5181.
25) R. L. Fleischer: Acta Met.11(1963) 203–209.
26) E. A. Brandes and G. B. Brook: in Smithels Metals Reference Book, 7th ed. (1992, Butterworth-Heinemann, Oxford).
27) H. Okamoto: Desk Handbook, Phase diagrams for Binary Alloys, (ASM International, 2000, Materials Park, OH).