A Simple Model for Examining Composition Effects in Eutectic Nucleation
J. R. Morris
1;2, F. Jiang
2and P. K. Liaw
21Materials Science & Technology Division, P.O. Box 2008, Oak Ridge National Laboratory, Oak Ridge, TN 37831, USA 2Department of Materials Science and Engineering, University of Tennessee, Knoxville, TN 37996, USA
We present a simple thermodynamic calculation for a strongly partitioning eutectic system, to examine how the critical nucleus energy changes, depending upon assumptions of the chemical diffusion. The calculations show that for strongly partitioning systems, the maximum undercooling may occur at a composition significantly different than the eutectic composition, particularly if the rate of diffusion is slow in the undercooled state. These simple calculations emphasize the role that partitioning and composition may play in determining optimal compositions in metallic glass systems, which typically occur near (but not at) deep eutectic compositions.
[doi:10.2320/matertrans.MJ200778]
(Received December 1, 2006; Accepted February 16, 2007; Published June 25, 2007)
Keywords: metallic glass, nucleation, phase diagram, nickel, niobium
1. Introduction
In recent years, the interest in bulk metallic glass (BMG) materials has grown rapidly, due to the discovery of compositions with significantly smaller critical cooling rates, and the formation of amorphous samples with larger cross sections. There are a number of guidelines that have been developed that have been suggested to help glass formation, including: (1) negative, large magnitude heats of mixing between the major elements in the liquid phase; (2) compositions are close to a ‘‘deep eutectic’’ where the composition stabilizes the liquid to a low temperature; (3) large numbers of element types, particularly with different sizes that may frustrate the crystalline phase. These ideas are clearly focused on the phase diagram of the material, attempting to control the driving force for crystallization.
From a theoretical standpoint, the theory of glass forma-tion has had a somewhat different focus. In particular, the role of dense packing,1–5)size effects,6–8)and local structure
[particularly icosahedral order9,10)] have dominated the
literature. Simulations have typically used single-component or binary systems, often with little characterization of melting temperatures or phase diagrams. These issues are compelling, and much has been learned, but some of the ideas are difficult to probe experimentally. In practice, these theories have not been broadly used to guide the determi-nation of optimal glass-forming compositions. Another approach to understanding BMG behaviors has been to use various parameters that attempt to correlate glass formability with thermodynamic quantities (including the melting tem-perature, the glass formation temtem-perature, and the crystal-lization onset temperatures during devitrification).11) Such
correlations have had various degrees of success, but typically can only be used after the glass composition has been determined.
In this work, we pose the following question: If all of the thermodynamic behavior was known, including not only the phase diagram but the underlying free energiesGðx;TÞfor all phases, how could we use this information to guide the choice of compositions that may form good glass formers? Of the guidelines above, the simplest choice would be to choose the
composition with the deepest eutectic temperature. This approach would incorporate the heat of mixings, and the size, chemistry, and number of components would be reflected in the phase diagram (as a function of all relevant compositions). However, it is well known that simply choosing the deepest eutectic temperature does not necessa-rily produce the optimal composition. Given this, how could the thermodynamic information be used to guide the alloy development?
The problem of glass formation can be considered as a problem of nucleation and growth: the simplest view of glass formation is that it is the absence of crystal nucleation.12–14)
In this paper we discuss the role of chemical partitioning on the energetics of critical nuclei. The dynamics of nucleation where the formation of crystalline order strongly couples to the local composition are poorly understood, and depend very much on the magnitude of segregation, the diffusion rates, and the free energies.15,16)
We demonstrate these issues, by using two calculations of the free energies of critical nuclei, with differing assumptions about the chemical diffusion. In the limit that diffusion is fast, chemical equilibrium may be reached quickly, and the energy of the nucleus is a true saddle point in the free energy.17) However, in the limit of very slow diffusion, the appropriate crystal nucleus may have thesamechemical composition as the surrounding liquid, and have a much higher free energy. We calculate the energies in these two limits, and show that they are significantly different, and change the ‘‘ideal’’ glass-forming composition.
2. Calculations of Critical Nucleus Energetics
For homogeneous nucleation, the free energy of the critical nucleus is given by
G¼16
3 3
2G2: ð1Þ
Here,is the solid-liquid interfacial free energy, andis the solid phase molar density. When the solid and liquid phases have the same equilibrium composition,G¼GliqGsolis
the difference in free energies (per mole) between the liquid
Special Issue on Bulk Metallic Glasses —Selected Papers from the Fifth International Conference on Bulk Metallic Glasses (BMGV)
and bulk phases. For small undercoolingsT ¼TmT, the driving force,G, for a pure system may be written as
G¼LT
Tm ð2Þ
whereLis the latent heat of the system andTmis the melting temperature. The latent heat is related to the change in
entropy at the transition by L¼TmS, where S is the
change in entropy at melting. Typical values ofSare close to the ideal gas constant R. This relationship is known as ‘‘Richards’ law.’’
In the case where there is a strong change in composition between the solid and liquid phases, the situation is more complex. One can envision two limits: if diffusion is very fast, then the nucleus and surrounding liquid will be in chemical equilibrium.17)To be in chemical equilibrium, the
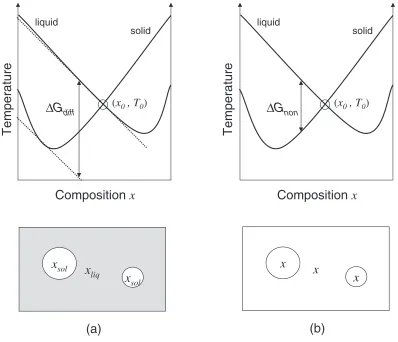
chemical potential differenceABmust be equal in both the solid phases. The driving force for crystallization,G, is then given by the difference in chemical potentials ofA(or B) as shown in Fig. 1(a). The opposite limit is that diffusion is very slow. In the limit that diffusion may be neglected, the crystal nucleus has thesamecomposition as the surrounding liquid, and the free energy is the difference between the liquid and solid phases at the same concentration. This free
energy difference is shown schematically in Fig. 1(b). Note that in the second case, the driving force is less than the first case. In fact, the metastable liquid phase can have a lower free energy than the solid phase at the same composition. In this case, without diffusion, there is no driving force for nucleation, and crystallization may not occur.
Conventionally, the temperature where the free energies of the two phases cross at a given composition is termedT0ðxÞ, which occurs between the solidus and liquidus temperatures, TsolðxÞandTliqðxÞ(for a given solid phase). This is the highest
temperature where partitionless nucleation or growth may occur at a given composition. The effect on growth has been discussed previously, and rapid solidification studies have shown that at sufficiently high growth rates, the diffusion rate is too slow for eutectic growth, and an amorphous phase may occur.18) Essentially, in this case, the amorphous phase
becomes sufficiently stable that growth of the crystal phases can not occur, due to the absence of diffusion. More generally, the competition between primary phase growth, coupled eutectic growth, and the formation of an amorphous phase is dependent on both the composition and cooling rate. Nucleation in the more realistic case is significantly more complicated: the rejected solute from the formation of the crystal nucleus will form a solute-rich region around the
Composition
x
Temperature
liquid
solid
∆
G
diffx
liqx
solx
sol(a)
x
x
x
(b)
(
x
0, T
0)
Composition
x
Temperature
liquid
solid
∆
G
non(
x
0, T
0)
Fig. 1 Schematic diagram of the free energies of solid and liquid phases. The temperatureT0ðxÞis defined as the temperature where these
free energies are equal. (a) The difference between the chemical potentials in the liquid and those in the solid phase with the same value of
ABas the liquid is given byGdiff. When diffusion is rapid, the nuclei will have a different composition than the surrounding liquid.
[image:2.595.100.498.71.413.2]nucleus, impeding further growth of the nucleus. The solute profile will depend on the diffusion rate in both phases, and on how much of the solute is rejected from the forming nucleus. The composition in the nucleus may be different than the equilibrium concentration as well. This is a rich area; for examples of models of coupled nucleation, see refs. 15, 16).
Rather than treating the dynamics explicitly, we consider the energetics of the critical nucleus. We are interested primarily in the case where the crystal phase preferentially has a different composition from the liquid phase, i.e., the case of solute partitioning. The lowest energy nucleus occurs when the driving force is the largest, i.e. when the solid nucleus is in chemical equilibrium with the surrounding liquid. However, when diffusion rates are slow, kinetically the transformation may occur with a different concentration in the nucleus. As indicated above, in the limit where the composition does not change (the zero diffusion limit), the nuclei have the same composition as the surrounding liquid. In the fast diffusion limit, the driving force isGdiff, and
we estimate this quantity by the difference between the liquid free energy and the free energy of the solid system in chemical equilibrium with the liquid (shown in Fig. 1(a)), each at the compositionx. For the nucleus to be in chemical equilibrium with the surrounding liquid, the chemical potential difference,AB, must be the same in both the original liquid, and in the nucleus. For temperatures above T0, the nucleating solid has no driving force for nucleation, unless solute flow can occur. In the non-diffusive limit, the driving force is Gnon¼GliqðxÞ GsolðxÞ, as indicated in
Fig. 1(b), and is positive only below the temperatureT0. In all cases, these free energies satisfyGnonGdiff. From
eq. (1), we immediately see that the critical nucleus energy in
the non-diffusive case, G
non, is therefore usually
signifi-cantly greater than that that of the diffusive case, G
diff.
This is not surprising, of course; it simply says that the critical nucleus with a constraint has a higher energy than that of the unconstrained case.
3. Calculations and Results for Model Eutectic System
To illustrate these points, consider a model eutectic system, based roughly on the Ni-Nb system, considering only the face-centered cubic (FCC) Ni, body-centered cubic (BCC) Nb, and liquid phases. We assume that the solid phases behave as regular solutions,i.e.their free energy has the form
GðT;xA;xBÞ ¼xAG0ðTÞ þxBG0ðTÞ þHmix xAxB
þRTðxAlnxAþxBlnxBÞ
GðT;xA;xBÞ ¼xAG
0ðTÞ þxBG 0ðTÞ þH
mixxAxB
þRTðxAlnxAþxBlnxBÞ ð3Þ
Here, G
0 and G
0 are the molar free energies of the pure
(monatomic) and phases, respectively. The molar
concentrations are given byxA andxB, satisfyingxAþxB¼
1, and the heat of mixing between the A and B atoms isHmix
per mole. The final term in eq. (3) corresponds to an ideal entropy of mixing, with the ideal gas constantR. The latent heat for the pure phases is estimated to be L¼TmR (per
mole), which is approximately true for most metals. For small undercoolings, the temperature dependence ofG0Gliqand
G0Gliq are well approximated by eq. (2), and this
expression is used at all temperatures.
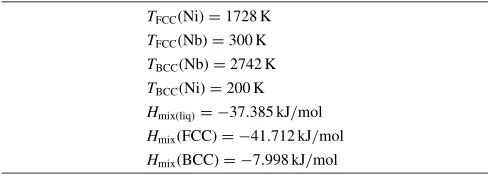
The melting temperatures of the pureand purephases are chosen to be those of Ni and Nb, respectively. Other parameters are given in Table 1. In particular, the heats of mixing are all negative, and have been chosen to roughly equal those in Ref. 19). The parameters in Ref. 19) include temperature-dependent enthalpies of mixing, and more realistic descriptions of the free energies of the pure phases than we have included here. Furthermore, terms beyond the ‘‘regular solution model’’ of eq. (3) have been included to better describe the concentration dependence of the enthalpy of mixing. Calculations using more accurate thermodynamics are currently in progress.20,21)We have chosen to omit these
complications for the present work, to examine the
qual-itative behavior of nucleation in deep eutectics. Therefore, the results presented below should not be taken as quanti-tative predictions for the real Ni-Nb system. With the differences in parameters from Ref. 19), we have also chosen much lower melting temperatures for the pure metastable phases (BCC Ni and FCC Nb) than in Ref. 19), to give a qualitatively correct ‘‘deep eutectic’’ behavior.
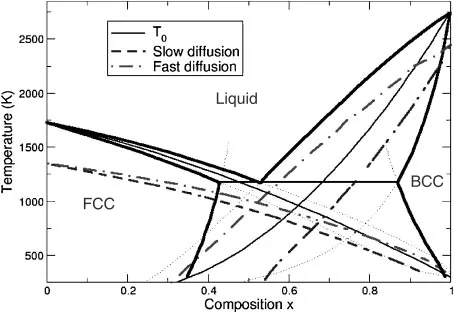
The resulting phase diagram is shown in Fig. 2. The eutectic composition occurs nearxB¼0:5. TheT0 lines for both solid phases are also shown, and intersect nearxB¼0:6. Immediately, these results show that partitionless growth can be suppressed to the lowest temperature at a composition significantly off-eutectic. Above the T0ðxÞ lines, the liquid phase has a lower free energy than the corresponding solid phasewith the same composition, and neither nucleation nor growth can occur without composition changes. This calculation also indicates that at large undercoolings, primary
growth may occur, even at compositions larger than the
eutectic composition.18)
For the pure phases, the critical nucleus energiesGhave
been calculated using eq. (1), assuming the interfacial free energy follows the Turnbull form12,13)
¼CTTmS2=3 ð4Þ
with CT¼1=2 for the FCC phase, and 1/3 for the BCC
phase. The product TmS is simply the latent heat. This
relects a lower value for a BCC phase, which may have a significantly lower interfacial free energy.22–24)Nucleation is
expected to occur rapidly once G drops below
approx-imately 50RT.17) For the pure phases (xB¼0 and xB ¼1), with the value ofgiven by eq. (4), this calculation predicts
[image:3.595.304.548.94.182.2]a maximum undercoolingT=Tm0:2for the FCC phase,
Table 1 Parameters used for calculating the phase diagram shown in Fig. 2.
in accordance with experimental observations.12–14) For the
binary case, the appropriate choice is not clear. We have assumed that the above formula works, but with a scaledTm:
TmðxÞ ¼xTmBþ ð1xÞTmA: ð5Þ
All other parameters in eq. (4) are independent ofx, except for the density term which cancels out. This is the simplest assumption that gives the correct limits for the pure case.
In Fig. 2, the temperatures whereG ¼50RT are plotted. For the slower nucleating non-diffusive case, at a composi-tion near xB¼0:65, the critical nucleus energy is above 50RT for bothandphases until temperatures near 700 K (where the curves cross). This suggests that at this compo-sition, nucleation may be suppressed well below the eutectic solidification temperature (1200K). In contrast, the fast diffusion calculation predicts rapid nucleation above 1000 K at this composition. In the latter case, the ideal composition where the critical nucleus free energy is maximized is closer to the eutectic composition; at this composition, the predicted maximum undercooling occurs near 1000 K.
4. Conclusions
The calculations demonstrate that different assumptions concerning the composition of the crystal nucleus has a dramatic effect on the critical nucleus free energy, and, therefore, on the rate of nucleation. The effect of diffusion is particularly strong for strongly segregating systems, where the equilibrium composition change upon crystallization is large. In the limit that diffusion is very slow, the nucleus must have the same composition as the surrounding liquid phase, and the driving force for nucleation is significantly reduced from the ‘‘diffusive’’ value where the nucleus is in chemical equilibrium with its surrounding liquid.
In the case where diffusion rates are low (as may be expected for a deeply undercooled system, particularly for a ‘‘deep eutectic system’’), the critical nucleus energies are much higher than that for the fast diffusion rate, and nucleation is suppressed. This difference in energy is demonstrated by Fig. 2, where the ‘‘fast diffusion’’ curves
intersect at a much higher temperature than the ‘‘slow diffusion’’ case. To maximize the barrier to nucleation, it is preferable to choose compositions that can be significantly different than the eutectic composition. The intersection of theT0lines occurs nearx¼0:6, 10% higher than the eutectic composition. In the slow diffusion limit, the intersection of the isoenergy lines for the critical nucleus was found (in this case) to have even a higher composition than that given by the intersection of theT0lines, close tox¼0:65.
Interestingly, with the parameters chosen here, rapid quenching is predicted to favor nucleation of the FCC phase over a large composition range, even at hypereutectic compositions where BCC is the primary solidification phase. This is true despite the lower interfacial free energy of the BCC phase. In the case of fast diffusion, the crossover from rapid FCC nucleation to rapid BCC nucleation occurs near the eutectic point. If diffusion is slow, however, BCC nucleation is suppressed, due to the low mutual solubility in BCC and high solubility in the FCC phase. Thus, suggestions that the competition between nucleating BCC or FCC phases is dominated by interfacial free energies25)are not complete.
While this clearly plays an important role, the full thermo-dynamics and kinetics of nucleation must also be considered. The simple calculation here may be improved in a number of ways that would provide quantitative differences, though the qualitative results would be the same. While we have roughly based the calculations on the Ni-Nb system, the chosen free energies are not accurate, and the intermetallic phases have been ignored, to present the ideas more clearly. For Ni-Nb, more accurate free energies of the pure phases are available.19–21)These free energies would include the proper
latent heats, as well as the full temperature-dependence of the free energies rather than relying on the approximation of eq. (2). The free energies of the intermediate phases are also available. Often, the glass formability is controlled by ‘‘metastable’’ eutectics, due to the slow nucleation dynamics of highly ordered compounds, and therefore the intermediate
phases may not play a significant role.26) The Turnbull
coefficient that controls the interfacial free energy should be specific to the crystal structure,22–24) and the appropriate
coefficients have been used here for the BCC and FCC phases; however, the coefficients are not known for the intermetallic phases. More difficult to treat is the composi-tion-dependence of the interfacial free energy; little is known about this dependence.27)A full treatment of nucleation rates also requires the knowledge of the viscosity, as a function of temperature and composition.28)
The approach may be generalized to ternary or higher-order systems as well. In general, combining the types of calculations performed here with ‘‘assessed’’ phase diagrams and associated free energies may provide a practical method to better predict in advance what compositions may be the best glass formers. While the ‘‘rules of thumb’’ described in the introduction may help select possible additions, the calculations presented here provide more quantitative pre-dictions.
Acknowledgements
JRM would like to thank H. Choo, L. Granasy, M. Kramer, FCC
Liquid
BCC
Fig. 2 Phase diagram for the model system. Also shown are theT0ðxÞ
curves for both solid phases (light solid lines). TheG¼50RTcontours
[image:4.595.55.284.73.229.2]R. E. Napolitano and G. Toth for useful comments. JRM’s contribution has been sponsored by the Division of Materials Sciences and Engineering, Office of Basic Energy Sciences, U.S. Department of Energy under contract with DE-AC05-00OR-22725 with UT-Battelle. This work is also supported by the National Science Foundation International Materials Institute (IMI) Program under the grant number of DMR-0231320 with Dr. C. Huber as the program director.
REFERENCES
1) J. D. Bernal and J. L. Finney: Nature214(1967) 265. 2) J. L. Finney and J. D. Bernal: Nature213(1967) 1079. 3) G. S. Cargill: Journal of Applied Physics41(1970) 2248. 4) D. B. Miracle: Nature Materials3(2004) 697–702. 5) D. B. Miracle: Acta Materialia54(2006) 4317–4336.
6) T. Egami and Y. Waseda: Journal of Non-Crystalline Solids64(1984) 113–134.
7) M. D. Eldridge, P. A. Madden, P. N. Pusey and P. Bartlett: Molecular Physics84(1995) 395–420.
8) P. Jalali and M. Li: Phys. Rev. B71(2005) 014206.
9) P. J. Steinhardt, D. R. Nelson and M. Ronchetti: Phys. Rev. Lett.47
(1981) 1297–1300.
10) S. Sachdev and D. R. Nelson: Phys. Rev. B32(1985) 4592–4606. 11) Z. P. Lu and C. T. Liu: Phys. Rev. Lett.91(2003) 115505.
12) D. Turnbull: J. Appl. Phys.21(1950) 1022.
13) D. Turnbull and R. E. Cech: J. Appl. Phys.21(1950) 804. 14) K. F. Kelton: Solid State Physics45(1991) 75–177.
15) K. F. Kelton: Journal of Non-Crystalline Solids274(2000) 147–154. 16) K. F. Kelton: Acta Materialia48(2000) 1967–1980.
17) J. W. Cahn and J. E. Hilliard: The Journal of Chemical Physics31
(1959) 688–699.
18) W. Boettinger:Rapidly Solidified Amorphous and Crystalline Alloys, ed. by B. H. Kear, B. C. Giessen and M. Cohen, (Elsevier Science, 1982) pp. 15.
19) Z. Kejun, Z. Xianzhang and J. Zhanpeng: J. Alloys and Compounds
179(1992) 177–185.
20) Z. Kejun and J. Zhanpeng: Scripta Metallurgica et Materialia26(1992) 417–422.
21) H. Okamoto: Journal of Phase Equilibria and Diffusion27(2006) 314– 314.
22) D. Y. Sun, M. Asta, J. J. Hoyt, M. I. Mendelev and D. J. Srolovitz: Phys. Rev. B69(2004) 020102.
23) R. L. Davidchack and B. B. Laird: Phys. Rev. Lett.94(2005) 086102. 24) J. J. Hoyt, M. Asta, T. Haxhimali, A. Karma, R. E. Napolitano, R. Trivedi, B. B. Laird and J. R. Morris: MRS Bulletin29(2004) 935–939. 25) A. L. Greer and I. T. Walker: Journal of Non-Crystalline Solids317
(2003) 78–84.
26) W. H. Wang, J. J. Lewandowski and A. L. Greer: Journal of Materials Research20(2005) 2307–2313.
27) C. A. Becker, D. Olmsted, M. Asta, J. J. Hoyt and S. M. Foiles: Phys. Rev. Lett.98(2007) 125701.