Munich Personal RePEc Archive
Investigating the Role of Extensive
Margin, Intensive Margin, Price and
Quantity Components on Turkey’s
Export Growth during 1998-2011
Türkcan, Kemal
Akdeniz University, Department of Economics
30 January 2014
Online at
https://mpra.ub.uni-muenchen.de/53292/
1
Investigating the Role of Extensive Margin, Intensive Margin, Price and Quantity
Components on Turkey’s Export Growth during 1998-2011
Kemal Türkcan1
January 2014
Abstract: Recent empirical research in international trade emphasizes the role of the extensive and intensive margin to the export growth. This paper examines the sources of export growth in Turkey. For this purpose, the study decomposes Turkey’s export growth into extensive and intensive margins by using two methodologies, the count method and the decomposition method of export growth shares. The intensive margin into price and quantity components is further decomposed in order to evaluate the role of changes in price and changes in quantity. Detailed bilateral trade data, BACI, from CEPII are employed to analyze Turkey’s export statistics with 209 countries at the HS-6 level over the period 1998–2011. Additionally, these methods are employed for different categories of goods (final goods and intermediate goods exports). The results suggest that the extensive margin, particularly geographic diversification, plays the most important role in Turkey’s total goods export growth. Further, the growth in Turkey’s total goods exports is mainly explained by quantity rather than price growth. The results further point out that growth in Turkey’s final goods was driven by price growth, whereas growth in intermediate goods exports was mainly explained by quantity growth. Yet the results also suggested that product and geographic diversification of Turkey’s have not been fully realized and thus many more opportunities exist for Turkey to expand product range or expand into new markets, which in turn will bring significant benefits in the form of stable, sustainable economic growth.
JEL Codes: F12, F14, F15
Keywords: Turkey, export margins
1 Akdeniz University, Department of Economics, Antalya, Turkey. Tel: +90 (242)-310-6427. Email:
2 1. Introduction
The decisions of 24 January 1980 have led to significant changes in the structure of
Turkish exports. Through the 24 January decisions, Turkey adopted an export-led growth
strategy to encourage exports by means of; tax rebates; export credits; export subsidies; and a
more realistic (flexible) exchange rate system. In addition, Turkey became a member of the
World Trade Organization in 1995. Another important development affecting the structure of
Turkish exports since the trade liberalization measures in the 1980s (Saygılı, 2011), was the
customs union (CU) between Turkey and the European Union (EU), which came into force in
1996. With the establishment of the CU, Turkey had to eliminate all tariffs and quantitative
restrictions on the imports of industrial goods originating from members of the EU, which in
turnguaranteed free access for its exporters to the EU market. An important component of the
CU (which was expected to have a major impact on the Turkish export structure), was the
process Turkey chose in order to align itself to the EU’s commercial policy. To enable this,
there was the expectation that Turkey adopt the preferential trade agreements (PTAs) and free
trade agreements (FTAs) of the EU with third countries within a five year time frame,
starting from 1996 (Çalışkan, 2009).2 Harrison et al. (1997) suggest that improved access to
third country markets are quantitatively the most important gains to Turkey from the CU
arrangement, as PTAs and FTAs with third countries normally consist of reciprocal
reductions in trade barriers by member countries.
Since the trade liberalization measures in the 1980s, Turkey’s World Trade
Organization membership and the establishment of the CU, Turkish exports have increased
substantially. From 1998 to 2011, in particular, Turkey’s exports have increased more than
fivefold, (27.1 billion US dollars to 137.9 billion US dollars), at an annual compound rate of
13.31 percent (see Table 1). As noted by Amurgo-Pacheco and Pierola (2008), exports can
3
grow due to a variety of reasons; exporting existing products to old destinations at higher
volumes and/or higher prices (intensive margin) or by exporting existing products to new
destinations or exporting new products to old and/or new destinations (extensive margin).
Despite strong growth in exports, with the exception of Aldan and Çulha (2013) and
Ekmen-Özçelik and Erlat (2013), empirical evidence on the role of extensive and intensive margins
on Turkish export growth remains sparse. To bridge this gap in empirical evidence this study
investigates therole of extensive and intensive margins to explain the substantial growth in
Turkey’s exports across different product types, and thereby adds to an increasing number of
studies which consider in detail the export performance of a single country (Amiti and
Freund, 2008;Bingzhan, 2011; Minondo and Requena, 2012).
This paper analyzes the sources of export growth in Turkey. For this purpose, it
decomposes Turkey’s exports to 209 importing countries over the period of 1998–2011 into
extensive and intensive margins using two methods; the count method3 and the decomposition
method of export shares, developed by Hummels and Klenow (2005). The intensive margin is
further broken down into price and quantity components to determine whether the rise in
Turkey’s exports is due to changes in price or to changes in quantity. Using two techniques
allows robust and clear-cut results to be obtained on the role of extensive and intensive
margins in the growth of Turkey’s exports.
From a policy perspective, it is important to establish whether Turkish export growth
is driven by the extensive or the intensive margin. Dutt et al. (2008) show export growth
coming from the extensive margin can lead to more stable and sustainable economic growth
through the diversification of risks across a wider range of products and markets.45 However,
3 This method was used by Dutt et al. (2011) and Bingzhan (2011).
4
if the intensive margin, particularly the quantity component, plays a significant role in the
growth of a country’s exports, this would generally be seen as an unpleasant outcome in terms
of sustainable economic growth. This is due to the growing demand for resources; such as,
capital, labor, natural resources and imported inputs, as export quantities increase, putting
further pressure on its current account balance. By contrast, if the price component of the
intensive margin accounts for the most important share of export growth, (assuming higher
prices are regarded as evidence of higher quality), this can be considered to be a helpful
development for achieving sustainable economic growth, given the fact that research and
development (R & D) spending, the level of human capital and technological innovation
activities are key ingredients in improving the level of product quality. Hence, determining
the true nature of Turkey’s export growth assists policy-makers to make rational policy
decisions to increase the global competitiveness of the country.
The remainder of the paper is organized as follows. Section 2 provides a brief
literature review of the topic. Section 3 outlines the two methods used in the calculation of
export margins; that is, the count method and the decomposition method of export shares.
Section 4 presents the data used to calculate the export margins. The results from the two
methods of calculation for Turkey’s total goods exports (as well as for final and intermediate
goods exports), are discussed in section 5. Section 6 summarizes the main findings and finally
section 7 presents the conclusions from the research.
2. Literature Review
There is ongoing discussion in the trade literature about the relative importance of
extensive and intensive margins in explaining export growth. For example, using data on
shipments by 126 exporting countries to 59 importing countries, and involving 5000 product
categories, Hummels and Klenow (2005) show that the extensive margin accounts for 60
5A statistically significant long-run relationship between export diversification and economic growth for Turkey
5
percent of the increase in exports of larger economies. The importance of the extensive
margin in export growth was also documented by; Evenett and Venables (2002) for exports of
23 developing countries; Berthou and Fontagne (2008) for French exports to the euro area
countries; Bernard et al. (2009) for US exports; and Dutt et al. (2011) for more than 150
countries’ exports. In contrast, several other studies have found that intensive margins played
a more important role in export growth than the extensive margin.
Using data from 158 countries over the period 1970 to 1997, Helpman et al. (2008)
show that the rapid growth of trade was mostly driven by the intensive margin. Further
examples of studies that have shown the importance of the intensive margin in export growth
include; Felbermayr and Kohler (2006) for world trade; Eaton et al. (2008) for Colombian
exports; Amiti and Freund (2010) for Chinese exports; Amurgo-Pacheco and Pierola (2008)
for the export growth of 24 developed and developing countries; Besedes and Prusa (2010)
for manufacturing exports of 46 countries; and Bingzhan (2011) for Chinese exports. Overall,
the empirical literature so far predominantly suggests that the growth of exports comes mainly
from exporting more in existing products rather than from exporting new products
Besedes and Prusa (2010) suggest thiscontradictoryevidence maybe due to the use of
different definitions of extensive and intensive margins through the empirical literature. There
are many ways to measure the extensive and the intensive margins of exports. One of the
most commonly used methods for calculation of the extensive and intensive margin is the
count method. In this method, the extensive margin is defined as the count of the number of
products or the number of trading partners to which a country exports, while the intensive
margin is defined as average exports per product (Dutt et al., 2011). In a dynamic setting
(time series context), however, the extensive and intensive margins are defined slightly
differently; where the extensive margin refers to the growth of exports in new categories
6
goods that are already being exported in both periods (Flam and Nordström, 2006; Amiti and
Freund, 2008; Bernard et al., 2009; Besedes and Prusa, 20106; and Bingzhan, 2011). Time
series measures changes in the extensive and intensive margins, therefore, more or less
explain the relative contribution of each margin to the country’s trade (export) growth over
time. Recently, Amurgo-Pacheco and Pierola (2008) have added the geographic dimension
into the calculation of the extensive and intensive margins in the time series context.
Therefore in this study, the extensive margin refers to old products (existing varieties) being
exported to new destinations, or new products being exported to old destinations or new
products to new destinations. On the other hand, the intensive margin refers to old products
being exported to old destinations in both periods.
As noted in Hummels and Klenow (2005), one drawback of the count method is that it
gives equal weight to small and large products (markets), thereby assigning a large
importance to product categories in which only a single country exports large quantities.
Hummels and Klenow (2005) have proposed a method where each product is weighted
according to its share in world trade (exports). Building on the methodology of Feenstra
(1994), Hummels and Klenow (2005) decompose the shares of one country’s exports in the
world market into two margins; the extensive margin and intensive margin, (the intensive
margin being further divided into price (quality) and quantity components). In this
decomposition, the extensive margin is defined as a weighted count of the categories
(products) in which a country exports relative to the categories exported by the rest of the
world. In contrast, the intensive margin is defined as a country’s nominal exports relative to
world’s nominal exports in a set of categories in which the country also exports. Therefore,
the extensive margin can be thought of as a measure of export variety while the intensive
7
margin as measure of the trade volume of each variety.7 This method has two advantages; firstly, it takes into account the differences in the importance of product groups (in terms of
market shares); secondly, it enables researchers to further decompose the intensive margin
into price and quantity component, which is not possible when using the count method.
Researchers who have employed this approach include; Bergin and Lin (2008, 2012), Van
Hove (2010), Dutt et al. (2011), and Foster et al. (2011). Some empirical studies, however,
have utilized both methods to check the robustness of their empirical calculations (Dutt et al.,
2011; Kehoe and Ruhl, 2013).
Another method proposed by Amiti and Freund (2008) and further developed by
Bingzhan (2011) to measure the extensive margin and intensive margin is mainly an
extension of the decomposition in Hummels and Klenow (2005). Bingzhan (2011) extendthe
approach of the Hummels and Klenow’s method by decomposing export growth into the
extensive margin growth rate and the intensive margin growth rate, with the later being
further decomposed into price growth rate and quantity growth rate. The major difference
between these two methods is that the Hummels and Klenow method accurately decomposes
the export shares, whereas Bingzhan’s method accurately decomposes export growth.
From a theoretical perspective, traditional trade theories have been considered to be
inadequate in explaining the source of the export growth. This is due to these traditional trade
theories assuming goods are perfectly homogenous, that is, there is no trade in horizontally
differentiated goods or vertically differentiated goods. Consequently, a country’s export
growth is solely the result of a higher quantity of exported goods, as there is no extensive
margin, or price (quality) component of the intensive margin incorporated into these models.
However, it is known that products have two attributes – variety and quality. Armington
7Dutt et al. (2011) have examined the results of the count method and the Hummels and Klenow (2005) method
8
(1969) emphasize the role of the intensive margin in explaining the growth of exports. In his
model, it is assumed that products traded internationally are differentiated on the basis of their
country of origin. He also assumes that each country produces only one variety in each
category of goods and that product is different from the product of the same category from
any other country, so that there is no export growth at the extensive margin. In addition this
model suggests countries can only export more by decreasing their prices relative to those
charged by other countries, leading to unfavorable terms of trade effects. On the other hand,
the monopolistic competition model developed by Krugman (1979, 1980, and 1981) explains
horizontal intra-industry trade by emphasizing the importance of economies of scale, product
differentiation, and demand for variety within the setting of monopolistic competition type
markets. The Krugman monopolistic competition model assumes each country specializes in a
range of varieties and predicts that the number of varieties produced in a country is
proportional to country size. In contrast with the Armington model, the Krugman model
predicts that a country can only export more through the extensive margin (a greater range of
varieties) in the sense that it exports the same quantity per variety and exports at the same unit
prices. 8
As suggested by Flam and Helpman (1987) and Falvey and Kierzkowski (1987),
countries also engage in two-way trade (intra-industry trade) in vertically differentiated goods
that are different in terms of quality. In particular, Falvey and Kierzkowski (1987) suggest
that the amount of capital relative to labor used in the production of vertically differentiated
goods indicates the quality of good. As a consequence, in an open economy, higher-quality
products are produced in capital abundant countries whereas lower-quality products are
produced in labor abundant countries. This will give rise to intra-industry trade in vertically
9
differentiated goods; the capital abundant country exports higher-quality varieties and labor
abundant country exports lower-quality products. The models of vertical intra-industry trade
thus suggest that export growth can be result of the quality (price) differences of the traded
products.9
More recently, based on the Krugman’s (1980) model, Melitz (2003) has developed a
dynamic industry model with heterogeneous firms to analyze the intra-industry effects of
international trade.10 According to this model, the firm participation in export markets is
solely dependent on a firms productivity and export (or trade) costs (a combination of both
fixed export costs and variable export costs). The model shows that the existence of export
costs allows only the most productive firms to enter export markets when a country opens up
to trade, forcing the least productive firms to exit. In this model, a fall in both variable and/or
fixed export costs between all countries have a number of implications for export growth,
which can be decomposed into extensive margin (that is, number of firms) and intensive
margin (that is, average exports per firm). The Melitz model predicts that a decline in variable
export costs raises the extensive margin because falling variable export costs allows new and
less productive firms, those just below the productivity threshold, to enter the export markets.
Moreover, a reduction in variable export costs enables existing exporters to increase their
sales to export markets (intensive margin). On the other hand, reductions in both fixed and
variable export costs also induces new and less efficient firms to enter the export markets,
thus implying a drop in average sales per firm (intensive margin). As a result, a fall in export
costs has an ambiguous effect on the intensive margin. In addition, a decline in the fixed
9While Flam and Helpman (1987) also study vertical differentiation in products there is a slight difference from Falvey and Kierzkowski’s (1987) model. In their model, labor is the only factor used to produce the differentiated goods and it is assumed that labor input per unit output of the differentiated product differs across countries, whereas in Falvey and Kierzkowski (1987) model, the capital is the major factor used to determine the quality of product. These labor-input requirements determine the level of quality. The pattern of trade is thus determined by cross-country differences in technology (labor-input requirements per unit of output), income and income distribution.
10
export costs will not affect the sales of existing exporters (intensive margin). Hence, the
Melitz model predicts that a fall in both fixed and variable export costs have a positive effect
on the extensive margin. However, the prediction of the model for the intensive margin is
ambiguous (Lawless, 2010).
3. Decomposition methodologies
In this section the alternative decomposition methods employed are presented; the
count method and the decomposition method of export shares by Hummels and Klenow
(2005). Each method has its strengths and weaknesses. The count method is relatively easy to
implement but gives only a rough indication of the role of each margin in export growth,
since it assigns equal weight to all observed product categories. The approach by Hummels
and Klenow (2005) addresses this shortcoming by weighting categories of goods by their
overall importance in exports to a given country; hence, it prevents a category from appearing
important solely because an exporter exports a large quantity in a certain category. Given that
there is no particular approach (preferable priori), on theoretical grounds, and given the
variety of results obtained in previous studies which have employed different approaches, the
present paper investigates the evolution of Turkish exports using both approaches, allowing to
identify results that are robust to the method used.
For both approaches, bilateral export relationships are classified as in
Amurgo-Pacheco and Pierola (2008), accounting for both product diversification (introduction of new
varieties) and geographic diversification (introduction of new export partners). More
specifically, a bilateral export relationship is created when a country begins to export an
existing product (variety) to a new destination country or a new product to old destination or
new destination in both periods. With this comprehensive definition of the extensive margin,
the estimated contributions of the extensive and intensive margin should be regarded as upper
11
To give clarity to the description of the methods employed in this study, some of the
notations used for the Turkish export data are listed. Individual product categories are indexed
by =, … , , time periods by = 1,2, … , , and destination countries by m= 1, … , , and
regions (that is, larger groups of countries) by = 1, … , . The variable is the price (in
US dollars) of product exported from Turkey to destination country m in period and is
calculated as the ratio of the export value to the quantity exported ( ). Since the focus is on
a single exporter country (Turkey) in the empirical part of the paper, the index (j) for the
exporting country is omitted for notational simplicity.
3.1 Count method
The count method essentially uses a descriptive approach by giving equal weight to all
product categories and destination countries. The (static) bilateral extensive margin in year t,
referred to as , is then defined as the number of products that have been exported from
Turkey to trading partner :
= ∑∈ , = 1 0 ℎ > 0 (1)
is the set of the products for which bilateral export data between Turkey and destination
country are available in period .11 In addition, Turkey’s multilateral extensive margin
( ) is computed to each of the seven following destination regions : (i) Europe, (ii)
Asia, (iii) Africa, (iv) America, (v) Commonwealth of Independent States (CIS), (vi) Middle
East and (vii) World. It is obtained accordingly, using partner regions r instead of individual
partner countries m in definition (1).
Underlying equation (1) is a static concept, depicting the level of the extensive margin
at a given point in time. Taking a dynamic perspective, the extensive margin refers to
12
the annual compound growth rate (ACGR) of number of product categories exported by
Turkey to destination country (or regions ) between years t and t+1, i.e.,
= − 1 (2)
where is the number of years in the period being considered.
In contrast, the bilateral intensive margin ( ) is defined as the export value of
‘common’ products that were exported by Turkey to country in both periods, period and
period + 1, i.e.,
= ∑∈ (3)
where = ( ∩ ) represents the set of products that were exported to country m in
both periods. Hence, the intensive margin is the value of ‘common’ products being exported
to ‘old’ destinations.
Taking a dynamic perspective, the growth of intensive margin ( ) is given by
= ∑∈ + (4)
where = − 1 and = − 1 represent the price and quantity
growth of exports of product to destination country , and =∑
∈
gives the export value shares of product category in Turkey’s total exports to country in
period + 1, with ∑∈ = 1.
Hence, in equation (4) growth of intensive margin is decomposed into two parts;
growth of price margin and growth of quantity margin. Thus, the overall growth rate of the
bilateral intensive margin can be seen as export value share-weighted average of the growth
rates of the price and quantity margins of all product categories exported to country
between the two periods. The growth rates of the multilateral price margin and quantity
13
the bilateral margins. Furthermore, the same calculations are also carried out for the
intermediate and final goods to see whether their growth rates are quite different. Obviously,
the growth rates of the extensive and intensive margin do not add up to the overall growth rate
of the value of exports, given that the extensive margin is calculated by assigning the same
weight to each product category.
3.2 Decomposition method of export shares
An alternative to the export value-based count approach to decompose bilateral
exports into the extensive and intensive margins has been devised by Hummels and Klenow
(2005). Their method is a cross-country analogue to Feenstra’s (1994) approach to
incorporate new varieties into a country’s import price index. Using to denote the
quantity of exports and to denote the price (unit values), the bilateral extensive margin of
Turkey’s exports to country in period is defined by
=∑∈
∑∈ (5)
where is the set of observable categories in which Turkey has positive exports to country
m in period . As a reference country, the rest of the world ( ) is used throughout, such that
denotes all categories imported by the destination country in period . Hence, the
extensive margin can be interpreted as a refined measure of the fraction of categories in which
Turkey exports to country , where each category is weighted by the importance of rest of
world exports to destination country , or, equivalently, by the importance of country ’s
imports from the rest of the world. is positive and can take values between 0 and
below 1.
The bilateral intensive margin, on the other hand, is defined as Turkey’s nominal
exports to country , relative to exports from the rest of the world, summing over those
14
= ∑∈
∑∈ (6)
Hence, the bilateral intensive margin calculates Turkey’s export share in the rest of world
exports to country in those products in which Turkey exports to country . also can
take values between 0 and 1. Note that the extensive margin will be large if Turkey exports
many different products to country , while the intensive margin will be large if Turkey
exports large amounts of a few categories to .
Following Hummels and Klenow (2005), the present paper further decomposes the
bilateral intensive margin into a price (quality) and quantity component as follows:
= × (7)
where is the implicit quantity index and is the price index. As in Hummels and
Klenow (2005), a bilateral aggregate price index is constructed based on the contribution of
Feenstra (1994). This price index is given by:
= ∏∈ (8)
where is the logarithmic mean of (the share of category in Turkey’s exports to
country ) and (the share of category in world (k) exports to country ):
=∑
∈ (9a)
=∑
∈ (9b)
= ∑
∈ (9c)
On the other hand, the implicit quantity index, , can be simply obtained by dividing the
bilateral intensive margin over the price index. It should be added, however, that the
decomposition into a price and quantity index relies on stronger assumptions than the
decomposition into extensive and intensive margin, namely that quality and within-category
15
Note that the multiplication of the extensive and the intensive margin gives the
bilateral overall market share of Turkey’s exports relative to rest of world exports to
country :
= × (10)
Using equations (5) to (10) allows computing the overall share of bilateral exports, bilateral
extensive margins, bilateral intensive margins, and the bilateral price and quantity
components (margins) for Turkey’s exports. The calculations for final goods and intermediate
goods are carried out in the samemanner.
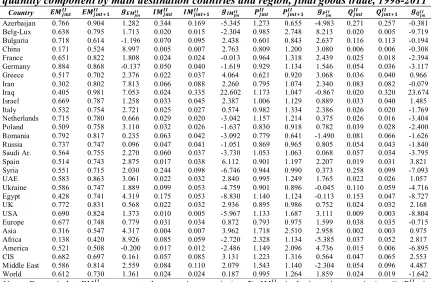
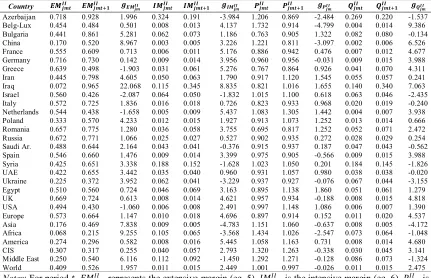
Finally, as a multilateral measure of Turkey’s export margins and components for each
region , weighted averages of the multilateral (extensive and intensive) margins and the
multilateral (price and quantity) components over the set of destination countries belonging
the same region for period are calculated.12
These measures are static measures, decomposing Turkey’s bilateral exports into the
extensive and intensive margin at a point in time. To get an idea of the growth of export
shares of Turkey over time, annual growth rates of export shares of Turkey between 1998 and
2011 are also calculated. To do this, the bilateral extensive margin, the intensive margin and
the price and quantity components for each destination country in 1998 and 2011 are
computed and the compound annual growth rates of each margin, using a method similar to
one given in the equation (2), is obtained. This exercise is also carried out at the regional level
to compute the compound annual growth rates of multilateral margins. Note that the growth
rate of the overall margin and that of export values are not exactly the same since the rest of
12Note that at the country and regional level, the intensive margin may not equal to the product of the price and
16
the world is the reference rather than the whole world, and since there is time variation in the
rest of world exports to country m.13
Summing up, two different methodologies will be used to decompose Turkish export
values (shares, growth) into the extensive and the intensive margins (including both bilateral
dimension and multilateral dimension), the latter is further decomposed into price and
quantity margins. Allcalculationswill be carried out for total trade and for the subgroups of
final goods and intermediate goods trade. The following section provides detailed information
about Turkish export data and the categorization into final and intermediate goods trade,
before discussion of the results.
4. Data
The BACI international trade database from the CEPII, which contains data for 245
countries and 5,066 product categories classified according to the Harmonized System (HS,
Revision 1996) at the 6-digit level14, was used in the decomposing of Turkey’s export growth
along the extensive and intensive margins, Data availability in the BACI HS-1996 database
spans from 1998 to 2011. This database, constructed using the United Nations Commodity
Trade Statistics original database (UN COMTRADE), provides detailed annual bilateral trade
data for commodity exports in value (in thousands of US Dollarsat the current prices), and in
quantities at the 6-digit level of the HS 1996, which allows calculation of unit values for each
product or item. As compared to the original database (UN COMTRADE), working with the
BACI database has several advantages. Firstly, the BACI database reconciles mirror flows
(for both values and quantities), which is reported by at least one of the partners, thus
providing a more complete and refined geographical coverage. Secondly, unlike the UN
COMTRADE database (where quantities are reported in different units of measure, such as
13 Hence, if the size of the destination market m grows (in terms of rest of world exports) a constant market share (overall margin) is associated with positive growth of export to country m.
14 The BACI database is available for researchers already subscribing to the United Nations COMTRADE
17
meters, square meters, number of items, kilograms, liters, and such like), the quantities in the
BACI database are registered in the same unit (tons) so that unit values are comparable at the
world and product level.15 Therefore, the BACI database is particularly convenient to
decompose the Turkey’s export growth into margins. It would be ideal to use intra-firm trade
statistics to measure the growth in export margins. Unfortunately, these data are not available
at the detail needed. Thus, data on exports by Turkey to 209 importing countries over the
period 1998 to 2011, comprising of 5066 items at the 6-digit level of the HS-1996 was used
(for a list of countries and information about each region, see Table A1).16
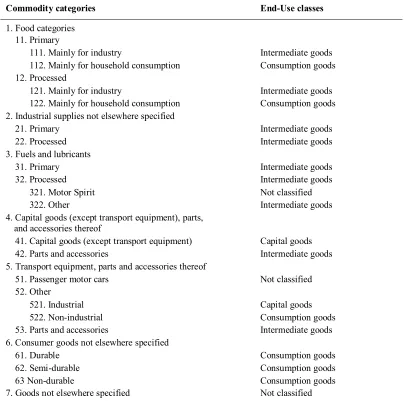
To distinguish intermediate goods from final goods, the United Nations Broad
Economic Categories (BEC) classification scheme, as in Hummels et al. (2001), was used.
Shown in Table A2, the BEC includes 19 basic categories, which are classified as capital
goods (categories 41 and 521), consumption goods (categories 112,122, 522, and 6),
intermediate goods (categories 111,121, 2, 31, 322, 42, and 53), and not classified (categories
321, 51 and 7). Categories, 321 (motor spirit) and 51 (passenger motor cars) could be
consumed directly by consumers or used as intermediates; category 7 includes, among others,
a range of military equipment, postal packages and special transactions and commodities not
classified according to end-use classes. To address this issue, category 321, category 51, and
category 7 are excluded from the calculations of the export margins for final goods and
intermediate goods. In order to select the final and intermediate goods from the trade data, the
correspondence table by the United Nations Statistics Division is used to map the HS-1996
codes to the BEC codes (http://unstats.un.org/unsd/default.htm). As a consequence, about
1238 items are considered as final goods and 3177 items are considered as intermediate goods
out of 5066 items from the 6-digit level of the HS-1996.
5. Overview of the export values of Turkey
15A detailed description of the BACI database can be given by Gaulier and Zignago (2010).
18
Before presenting the results of the export margins, an overview of Turkey’s exports
to the selected destination countries and regions over the period 1998 to 2011, differentiated
by product categories and distinguishing between total goods, final goods and intermediate
goods is provided. The main focus is on differences across destination countries and regions,
differences across different product categories and changes over time. The selected countries
given in Table A1 were chosen based on their importance in the value of Turkey’s total
exports in 2011 and also the availability of the export data. Furthermore, as defined above,
Turkey’s total, final and intermediate exports are decomposed into seven destination regions
: Europe, Asia, Africa, America, CIS, Middle East and World.
Total exports by destination regions and countries
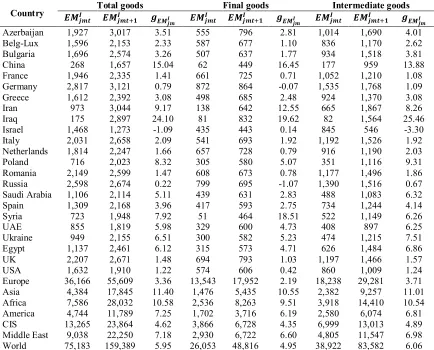
Values and growth rates of Turkey’s total goods exports to the 23 destination countries
and seven destination regions are reported in Table 1 for the period 1998-2011. Despite the
economic downturn in 2001 and the global financial crisis in 2008, Turkey achieved
remarkable export growth during the period of 1998-2011. As seen in Table 1, Turkey’s total
goods exports has more than doubled from 27.,1 billion US dollars in 1997 to 137.9 billion
US dollars in 2011, rising at an average annual (compound) rate of 13.31 percent per year,
which is well above the world average export growth, but trailing behind the BRIC economies
(Brazil, Russia, China, and India).17 As a result, Turkey’s share in world exports has been
substantially increased from 0.49 percent in 1998 to 0.73 percent in 2011.18 19 The literature
has identified several factors accountable for this remarkable growth.
One of the major factors identified to explain the ‘stellar’ export performance, is the
productivity improvements in the manufacturing industry. These productivity improvements
17For more information, see Gros and Selçuki (2013) and The World Bank's Trade Competitiveness in Turkey
Report 2012 at www.ecb.europa.eu.
18 Detailed information on the share of Turkey’s exports in world merchandise exports can be found atthe WTO’s website:http://www.wto.org.
19
have arisen from Turkey’s entry into a customs union with the EU in 1996, which brought
stiff competition to Turkish companies (Bayar, 2002; Akkoyunlu-Wigley and Mihci, 2006;
İzmen and Yılmaz, 2009; Gros and and Selçuki, 2013). In addition, Gros and Selçuki (2013)
argue that the formation of the CU with the EU helped Turkish companies to import cheaper
intermediate goods from these countries, thereby leading to competitive advantage for
Turkish exporters in the global markets.
Beside the impact of the CU on Turkish exports, Turkey’s spectacular export
performance over the years is also due to a number of other factors; the depreciation of the
Turkish Lira (TL); the need to search for new export destinations during the economic
downturns in 2001 and 2008; the need to expand Turkey’s export base forced by the fierce
competition coming from low-wage countries which export similar products; and the inflow
of foreign direct investment (FDI) into Turkey, mostly originating from the EU (İzmen and
Yılmaz, 2009; Gros and and Selçuki, 2013).20
Another factor that has lead to this explosive growth is the entrance of Turkish
companies into global production networks (Kaminski and Ng, 2006 and Saygılı and Saygılı,
2011). The combination of technological developments and trade liberalization through the 24
January 1980 decisions and the establishment of the CU with the EU, has allowed Turkish
companies to join into global production networks based on fragmentation of production. This
in turn has led to fundamental changes in production methods as well as trade patterns in
Turkey. Through integration into global production networks, Turkish companies became
more specialized in producing and then exporting medium and high-technology manufactured
20Despite over-appreciation of the Turkish Lira (TL) after the 2001 economic crisis, the momentum of export
20
goods, such as, machinery and equipment, consumer electronics, and transport vehicles.21 These industries involve medium or high-skilled labor and exhibit a high degree of
fragmentation. The successful transformation of Turkey’s exports from low technology and
unskilled labor-intensive products to medium and high-tech products, which required more
skilled labor, has contributed to a large increase in Turkey’s exports, particularly to the EU, in
recent years (İzmen and Yılmaz, 2009; Saygılı and Saygılı, 2011; Özenç and Altaylıgil,
2013).2223
Table 1 also demonstrates the regional composition of Turkey’s total exports from
1998 to 2011. It shows the regional distribution of Turkey’s exports has changed considerably
over the study period. Europe and America has decreased in importance, while regional trade,
especially with the Middle East, Asia, the CIS and Africa, has increased.24 The results show
that the Middle East (19.56 percent), Asia (18.06 percent), the CIS (15.58 percent) and Africa
(14.95 percent) have been the fastest-growing destination regions for Turkey’s total exports,
compared with 11.72 percent and 8.27 percent growth in Turkey’s exports to Europe and
America, respectively. Thus, the findings suggest that Turkey has successfully diversified its
exports geographically to the Middle East, Asia, the CIS and Africa in recent years.25
However, the bulk of Turkey’s total goods exports were still destined for Europe, although
21Despite the large decline in the share of low technology and unskilled labor intensive products in total exports,
textiles and clothing sectors still remain the main sourceof exportearnings in Turkey. According to Saygılı and Saygılı (2011), the top five items in which Turkey exported in 2006 are (87) Vehicles other than railway or tramway rolling stock, (61) Articles of apparel and clothing accessories knitted, (84) Nuclear reactors, boilers, machinery and mechanical appliances, (85) Electrical machinery and equipment and (72) Iron and steel. The shifting structure of Turkey’s exports suggest that Turkish companies are attempting to move production to areas where they face less competition from low-cost producers, particularly after the Chinese accession to the WTO in 2001.
22However, as pointed out by Yükseler and Türkan (2008), İzmen and Yılmaz (2009), Saygılı and Saygılı (2011)
and Gros and Selçuki (2013), the increasing fragmentation of production coupled with the appreciation of TL has led to a growing share of foreign value added contained in the Turkish exports in recent years, which in turn lead to a serious current account balance problem.
23 Nowak-Lehmann et al. (2007) and Akkemik (2011) point another likely reason for the declining importance of the low-tech products, such as textiles and clothing, in Turkey’s exports to Europe, that is theabolition of quotas on textiles and clothing on 1 January 2005 by the EU has led to an increase in Chinese exports to the EU at the expense of Turkey.
24Taymaz et al. (2011) document similarstylized facts on regional exports of Turkey.
21
this has changed over time. The European share of Turkey’s exports declined from 62 percent
to 42 percent between 1998 and 2011, with the Middle East (increasing from 8 percent to 17
percent), and Asia (increasing from 3 percent to 6 percent), absorbing a majority of that
export decline. One reason for the re-orientation of Turkey’s exports towards the Middle East
and neighboring countries is the sharp increase in the number of FTAs concluded between
Turkey and these countries in recent years (Gros and Selçuki, 2013). Another reason is the
global financial crisis of 2008 in Europe and America which forced Turkish companies to
redirect their exports towards more dynamic regions where the purchasing power has
significantly increased in recent years.26 The growing share of emerging markets in Turkish
exports suggests that Turkish products have so much room to grow in markets untouched by
competitors. This finding is consistent with a number of previous studies (Aldan et al., 2012;
Akkemik, 2011; Gros and Selçuki, 2013).
Finally, a surge in total goods exports to these regions is also a natural outcome of the
export diversification strategies adopted by Turkey in recent years (Göktürk et. al, 2013).
Turkey has implemented several export diversification strategies since 2000. These are ‘The
Neighboring and Surrounding Countries Strategy’ in 2000, ‘African Countries Strategy’ in
2003, ‘The Asian-Pacific Countries Strategy’ in 2005, ‘The Americas Strategy’ in 2006, and
more recently ‘Turkish Exports Strategy for 2023’ in 2009. It is quite apparent that Turkey’s
export diversification strategy is paying off as its exports to all these aforementioned regions,
except America, grew significantly during the study period despite the global economic
downturn.
22
The results further pointed out the impact of the CU on Turkey’s exports has gradually
faded away over time.27 Yılmaz (2011) argue the impact of the EU on Turkey’s exports did
not become evident in until after the first five years because the tariffs between Turkey and
the EU had already been removed prior to 1995. However, Turkey’s exports to the EU have
accelerated considerably since 2001. This was largely due to the depreciation of the TL and
the decline in domestic demand caused by the 2001 economic crisis that compelled Turkish
companies to speed up their search for new export markets. However, the latest data, from
Table 1, shows the situation appears to have reversed once again after the 2008 global
financial crisis, with a declining export share of the EU on Turkey’s total exports.
Furthermore, several studies highlight the fact that exports of medium and high-tech products,
such as consumer electronics and automotive products, to Europe has tended to rise after 2001
(Kaminski and Ng, 2006; Doğan and Kaya, 2011; Yılmaz, 2011; Aldan et al., 2012). On the
contrary, exports of low-tech products, such as textiles and clothing, to Europe have fallen in
the same period due to the fierce competition coming from China.28 In recent years, Turkey’s
low-tech producers are increasingly facing fierce competition in Europe from Chinese exports
and have responded to this pressure by moving out of the low-tech sectors where China is
more competitive. As a result, Turkey has reduced its comparative trade weakness in medium
and high-tech industries, such as consumer electronics and automotive products, through
27Not surprisingly, the impact of the CU on Turkish exports has been extensively investigated in the literature.
Examples of these studies are Harrison et al. (1996), Mercenier and Yeldan (1997), Bayar et al. (2000), Mardas and Moutos (2002), Akkoyunlu-Wigley and Mihci (2006), Antonucci and Manzocchi (2006), Nowak-Lehmann et al. (2007), Neyaptı et al. (2007), Adam and Moutos (2008), Seymen (2009), Doğan and Kaya (2011) and Yılmaz (2011). Despite the vast literature, there is still no general consensus concerning the benefits of the CU for Turkey’s exports. While a few studies found a negative or zero relationship between the CU and Turkey’s exports, some studies have found positive and large as well as small effects. After reviewingthe existing literature,Yılmaz (2011) concluded that the CU has generally a beneficial effect on Turkey’s export flows in the long run, thankslargely to continuingimprovementsinproductivity.
28Kaminski and Ng (2006) report that the share of medium- and high tech products in Turkish exports to the
23
increased productivity, while its comparative strength in low-tech industries, such as textiles
and clothing, is waning.
Turning to the evolution of Turkey’s total exports across destination markets, Table 1
shows export growth rates vary enormously across destinations during the study period.
The results also suggest Turkey’sexports to emerging economies grewmore thanexports to
high-incomecountries. As can be clearly seen in Table 1 over the last few years Turkey has
successfully re-oriented its exports to new destination countries, such as Iraq, China and
UAE. Turkey’s exports to Iraq exhibited the highest annual growth rate of 66.82 percent.
Exports to China registered the second highest annual growth rate at 35.91 percent, followed
by UAE at 23.71 percent, Iran at 22.75 percent and Bulgaria at 19.04 percent. Despite losing
ground to new markets in the Middle East and Asia, four of the top five destination countries
for Turkey’s exports in 2011 are still from Europe. The largest export market for Turkish
products is Germany. Compared with the base year 1998, Turkish exports to Germany have
increased from 5.9 billion US dollars in 1998 to 15.4 billion US dollars in 2011, or at a 7.61
percent growth rate per year. Turkey’s second largest export market is the United Kingdom
(UK) (8.5 billion US dollars in 2011) with 12 percent growth rate per year from 1998 to 2011.
With annual exports worth over 8.2 billion US dollars in 2011, Iraq ranked the third largest
export market in Turkey, in part due to the lifting of the United Nations’ international trade
embargo against Iraq in 2003. Italy is the fourth largest market for Turkey’s exports, 8.2
billion US dollars in 2011, an average growth of 12.77 percent per year over the same period.
Turkey’s exports to France in 2011 were 7.7 billion US dollars, with 12.80 percent growth
rate per year from 1998 to in 2011, making France its fifth largest export market. Further,
there has been notable increases in exports with Bulgaria (19.04 percent), Poland (18.99
percent) and Romania (18.46 percent) over the study period because of their close geographic
24
1990s, enabling Turkey to increase its exports by more than the world average export growth
rate of 13.30 percent per annum.
To sum up, the results reveal that Turkish exporters successfully diversified their
export markets with the emerging countries to offset the weakening demand in European and
American markets in recent years. The share of exports to European countries appears to have
gradually fallen over time, though there is still a high export concentration on European
markets. This is likely due to the fact that these countries already had a high degree of
integration with Turkey because of the establishment of the CU in 1995, leading to low export
growth rates over the last decade. Nevertheless, it is important to keep in mind that Europe is
still the largest and geographically close markets for Turkish exports. Hence, it is most likely
that this situation could be reversed once economic conditions improve throughout Europe in
the near future.
Final goods exports by destination regions and countries
Table 1 also illustrates the value and growth rates of Turkey’s final goods exports by
selected destination country and geographical region between 1998 and 2011. Turkey’s final
goods exports to the world increased from 13.8 billion US dollars in 1998 to 44.9 billion US
dollars in 2011, an increase of 9.50 percent; a much slower rate than that of total goods
exports. As can be seen from Table 1, the shares of final goods exports in Turkey’s total
goods exports has dropped from 48 percent in 1998 to 32 percent in 2011. By contrast, the
shares of intermediate goods in total exports climbed to 48 percent from 42 percent. The
causes for this relatively poor performance of Turkey’s final goods exports are complex, but a
major factor is the transformation of Turkey’s manufacturing industries into global production
networks that boosted the intermediate goods trade at a faster rate than that of final goods
trade (Kaminski and Ng, 2006 and Saygılı and Saygılı, 2011). A very similar trend is
2008-25
2009 financial crises and found that the exports of products with high shares of processing
trade demonstrated a much fasterrecovery from the recession than the low type. 29 Jing (2012)
further found that exports of capital and intermediate goods collapse later than final
consumption goods, but also recover faster. Another related factor would be a shift in the
composition intermediate goods exports toward high-quality parts, such as auto parts. 30
Table 1 exhibits the final goods exports to different geographic regions. Several points
are worth mentioning. First, it is clear, not surprisingly, the value of Turkey’s final goods
exports to the Middle East, Africa, Asia and the CIS has been increasing more than that of
Europe and America over the period considered in this study. In particular, the annual
compound percentage change in the value of Turkey’s final goods exports to the Middle East,
Asia and the CIS over the study period have grown at 20.56 percent, 16.88 percent, 12.43
percent, respectively, surpassing the average export growth of Turkey’s exports to the world
(9.50 percent). The results imply Turkish companies have managed to redirect their final
goods exports towards these regions in recent years, largely due to the more rapid economic
growth in these regions. At the same there has been a relatively small increase in Turkey’s
final goods exports going to developed regions, such as Europe (8.16 percent) and America
(2.81 percent), in part due to the worsening economic situation in Europe and America. Thus,
the results clearly suggest that geographical diversification became more important for
Turkish companies in the period of the latest global economic crisis.
Looking at the evolution of Turkey’s final goods exports by selected destinations
reveals that Turkey’s exports to the emerging countries, except Spain, have exhibited
29 Jing (2012) argues that industries with higher shares of processing trade should fall into collapse earlier if this export contraction is driven by foreign demand shocks. When demand in foreign countries drops in recession, the production in foreign countries fall quickly, the demand for processed trade drops accordingly, given the fact these industries are more deeply integrated into foreignproduction. The results reported in Jing (2012) show that products with high shares of processing trade are found having higher hazard rates to collapse during the downturn and also tend to recover faster from the recession.
26
particularly robust export growth rates, a pattern similar to the one observed in the case of
total goods exports. Between 1998 and 2011, Turkey’s final goods exports to Iraq and China
increased by 63.88 percent and 32.81 percent, respectively. Exports to Iran, UAE and Spain
grew by 31.78 percent, 22.17 percent and 19.88 percent, respectively. This ‘stellar’ export
performance happened despite the 2008 global economic crises as Turkish companies search
for new markets. During the same period, Turkey’s final goods exports to the advanced
countries, such as Belgium-Luxembourg (7.26 percent), France (8.15 percent) and Germany
(4.26 percent), grew less rapidly than those to developing countries. Nevertheless, the
developed countries remained the most important markets for Turkey’s final goods exports.
In 2011, Germany was Turkey’s top export partner, importing 7.4 billion US dollars in final
goods, a 4.26 percent increase from 1998. The UK was the second largest market for Turkey’s
final goods, importing 4.0 billion US dollars in 2011, a 10.58 percent increase since 1998.
Iraq moved up to become the third largest export market for Turkey’s final goods, with
exports totaling over 3.4 billion US dollars in 2011, a 63.88 percent increase since 1998,
presumably attributable to the lifting trade sanctions on that nation. France is Turkey’s fourth
largest final goods export partner with 2.7 billion US dollars in 2011, up 8.15 percent from
1998, while Russia is the fifth largest export market for Turkey’s final goods exports,
accounting for 2.4 billion US dollars, up 11.54 percent from 1998.
Intermediate goods exports by destination regions and countries
The value and average annual growth rates of Turkey’s intermediate goods exports
over the period of 1998-2011 are reported at the level of world, geographical regions and
selected destination country in Table 1. At the aggregate level, Turkey’s intermediate goods
exports grew significantly by 14.42 percent, much larger than export offinal goods exports
(9.50 percent). The results thus reveal that Turkey’s intermediate goods exports have
27
exports, this is consistent with the findings of Jing (2012).31 32 The results thus imply that Turkey’s total exports growth is mainly driven by intermediate goods rather than final goods.
As discussed above, this high growth rates are driven largely by the rising importance of
vertical international production sharing in the Turkey’s manufacturing industry in recent
years. Furthermore, despite global economic downturn, Turkey has managed to sustain high
export growth rates in intermediate goods due to radical transformation of Turkey’s trade
structure from exporting low-value added intermediate goods, such as steel, to high-value
added intermediate goods, such as automotive parts, triggered by the increasing participation
of Turkish companies into the global value chains in recent years (Kaminsky and Ng, 2006).
High growth rates in intermediate goods to the world also imply that Turkish firms are
increasingly locating their production stages abroad to take advantage of lower labor costs in
recent years, thus generating more intermediate goods exports from Turkey to its trade
partners.
Turning to the regional level, the results show that there are significant discrepancies
in growth rates across regions. The evidence indicates that despite maintaining strong
linkages with Europe, Turkey’s intermediate goods exports to non-traditional markets like the
Middle East, Asia, the CIS and Africa has been growing at a much faster rate than Turkey’s
intermediate goods exports to the traditional markets like Europe and America during
1998-2011, suggesting that Turkish companies have successfully entered very large and previously
untapped markets. The Middle East-destined exports grew by 17.81 percent on average during
the 1998-2011 period, while exports to Asia grew by 17.58 percent. At the same time, the
31 In Jing (2012), it is argued that fragmented industries tend to recover much more quickly from the recession if this export boom is driven by a sharp rise in demand from foreign countries because the improved economic conditions can spread rapidly along the global value chain. When demand in foreign countries rise in the period of expansion, the demand for processed intermediate goods, which connects different stages of global value chains, rises quickly, resulting in a faster recovery compared to the final goods.
28
average annual growth rate of Turkey’s exports to the CIS and Africa throughout the period
was 17.10 percent and 16.27 percent, respectively, much higher than either Europe’s rate of
export growth of 12.92 percent or America’s rate of export growth of 9.84 percent. Even
though the traditional markets remained by far the major markets for Turkey’s intermediate
goods, the non-traditional markets have nevertheless become increasingly important markets
for Turkish intermediate goods in recent years, which is largely simulated by the worsening
economic situation in the traditional markets, more rapid growth in non-traditional markets,
and the deepening integration of Turkish manufacturing industries into the global value
chains.
Trends at country level are also reflected in Table 1. Looking at the level and the
growth rate of Turkey’s intermediate goods exports, the data shows the growth rates of
Turkey’s intermediate goods exports to the advanced countries have lagged far behind that of
Turkey’s exports to emerging countries. The fastest growing destinations were Iraq at 69.51
percent, followed by China at 36.80 percent, Bulgaria at 20.77 percent, UAE at 20.73 percent,
and Romania at 20.53 percent. Also worth mentioning is, despite sluggish exports growth to
Turkey’s major trading partners in the EU, the growth rates of intermediate goods exports to
the new member states of the EU like Bulgaria, Romania and Poland has been impressive;
rising considerably above Turkey’s overall average of 14.42 percent, which is quite consistent
with the findings of Kaminsky and Ng (2006). Besides being geographically close to each
other and increasing the export volume via the globally integrated production structure,
particularly with Poland, which has a large established automotive industry, it is clear the CU
had a significant impact on the increase in intermediate goods exports to these
aforementioned countries.
However, Table 1 shows that while Turkey’s dependency on trade with Europe is
29
remain key export destinations for Turkey’s intermediate goods exports due to their size and
large trading capacity. As of 2011, Germany was by far the largest and most important export
market with Turkey’s intermediate goods with 6.4 billion US dollars, an increase of 12.36
percent per annum over the period. Iraq was Turkey’s second largest intermediate goods
market in 2011, 4.1 billion US dollars in 2011, up 69.51 percent per annum from 1998. Italy
was the third largest buyer of Turkey’s intermediate goods exports, amounting to 4.1 billion
US dollars in 2011, a growth rate of 10.69 percent per annum since 1998. The UK ranked the
fourth largest export destination for Turkey’s intermediate goods exports in 2011, with a
value of 3.1 billion US dollars and an annual growth rate of 11.52 percent over the period,
while Iran was in fifth place, with a value of 2.4 billion US dollars and an annual growth rate
of 20.10 percent.
6. Extensive and intensive margins of Turkey’s exports
As mentioned earlier, there have been various methods developed to decompose the
growth of exports into extensive and intensive margins, and the latter further into price and
quantity margins. In this paper, two methods were employed, the count method and
decomposition method of export shares developed by Hummels and Klenow (2005), to
analyze Turkey’s export growth over the period 1998-2011. In addition, these methods were
employed for different categories of goods (total goods exports, final goods exports, and
intermediate goods exports).
6.1 The results of the count method
Extensive and Intensive Margins of Turkey’s Total Goods Exports
The main results of the count method for each product groupings are presented in
Table 2a and 2b at both regional level and country level. The left panel of Table 2a shows the
result of the extensive margin growth of Turkey’s exports while the left panel of Table 2b
30
Table 2a, the first and second column of the left panel shows the number of products that
Turkey exports to each destination country in 1998 and 2011, respectively. The left panel of
Table 2a also reports the number of country-product relationships that Turkey has for each
destination region. In addition, the third column of Table 2a gives the growth at the extensive
margin between Turkey and its destination country or region using the equation (2).
It is worth recalling that the bilateral extensive margin is defined as the number of
products that have been exported from Turkey to each destination country. Multilateral
dimension of the extensive margin, on the other hand, refers to the number of
product-destination pairs within a product-destination region, which allows for the geographical diversification
of the extensive margin to be taken into account. As can be observed, the number of
product-destinations relationships Turkey has with the world increased from 75.1 thousand in 1998 to
159.3 thousand in 2011, an annual average growth rate of 5.95 percent. The results thus
indicate that the extensive margin have contributed positively to Turkey’s export growth over
the period, but its contribution to the overall export growth seems to be relatively small,
because the former grew at a rate much smaller than the growth rate of the latter (13.30
percent) during this period. 33 34 35 Despite the fact the extensive margin explains a small
33 Similarly, Aldan and Çulha (2013) has applied the count methodto Turkey's export flows (at 4-digit level of SITC Revision 3) and found that the number of product-destination pairs grew significantly from 14.1 thousand to 52.6 thousand during 1998-2011. On the contrary, the number of products exported by Turkey to the world has risen slightly from 673 to 702 over the same period. Based on their evidence, they hence conclude that geographic diversification was the key driver of Turkey’s export growth rather than product diversification. Likewise, using the count method Ekmen-Özçelik and Erlat (2013) showed that the number of products (out of 3049 possible productsat 5-digit level of SITC Revision 3) that Turkey exported to the EU-15 market increased substantially from 2,205 in 1996 to 2,557 in 2006. They further concluded that Turkey, ranked9th among30 countries exporting to the EU,has exhibited good performance in terms of product diversification over the period. Last, using the count method, Yücel and Doğruel (2012) provided the evidence that average number of active export lines (at the 4-digit level of ISIC Revision 3) in Turkey grew from 102 in 2000 to 106 in 2010, a 3.72 percent change compared to the base year, indicating much higher percentage change than the percentage change of several emerging economies, including China, Brazil, India and Russia.