Distributed Sensor Logging: As Easy as a Mesh of Yoyos
*
Corey Wallis1, Alison Hutton2, Steve Brown1,3, Romana Challans1, Paul Gardner-Stephen1
1School of Computer Science, Engineering and Mathematics, Flinders University, Adelaide, Australia 2School of Nursing and Midwifery, Flinders University, Adelaide, Australia
3Tourism Department, School of Humanities, Flinders University, Adelaide, Australia Email: [email protected], [email protected], [email protected],
[email protected], [email protected]
Received April 16, 2013; revised May 20, 2013; accepted June 14, 2013
Copyright © 2013 Corey Wallis etal. This is an open access article distributed under the Creative Commons Attribution License, which permits unrestricted use, distribution, and reproduction in any medium, provided the original work is properly cited.
ABSTRACT
The Mass Gathering Data Acquisition and Analysis (MaGDAA) project involved the development of hardware and software solutions to facilitate the rapid and effective collection of autonomous and survey based data during mass gathering events. The aim of the project was the development and trial of a purpose-built Open Hardware based envi- ronment monitoring sensor prototypes using IOIO (pronounced “yoyo”) boards. Data from these sensors, and other de- vices, was collected using Open Source software running on Android powered mobile phones, tablets and other open hardware based platforms. Data was shared using a Wi-Fi mesh network based on an Open Source project called The Serval Project. Additional data in the form of survey based questionnaires were collected using ODK Collect, one of the applications in the Open Data Kit suite. The MaGDAA project demonstrated that it is possible for researchers (through the use of Open Source software and Open Hardware) to own, visualise, and share data without the difficulties of set- ting up and maintaining servers. MaGDAA proved to be an effective infrastructure independent sensor logging network that enables a broad range of data collection (demographic, predispositions, motivations, psychosocial and environ- mental influencers and modifiers of audience behaviour, cultural value) in the field of mass gathering research.
Keywords: Sensor Logging; Open Source Software; Open Source Hardware; Automated Data Acquisition; Surveying
1. Objective
The Mass Gathering Data Acquisition and Analysis (MaGDAA) project has been focused on the develop- ment of Open Source Software and Open Hardware to support research in the area of mass gatherings. By using open technologies and standards the project has been able to develop prototype hardware and software in a relatively short time period.
The use of the MaGDAA sensors and survey man- agement tools on Android powered devices were devel- oped to improve the speed, automation and overall effec- tiveness of the collection of data, particularly in a way that could be incorporated into the overall dataset for a wide range of events.
Additionally, through the use of mesh networking, the sensor network can be used without the need for addi- tional infrastructure and can also support distributed data management.
2. Background
2.1. Mass Gathering Research
In 2004 Arbon proposed a conceptual model that was founded on the idea that mass-gathering health can be understood as an inter-relationship between three do- mains: 1) the biomedical; 2) the environmental; and 3) the psychosocial [1]. Mass gatherings are defined in terms of the number of people who attend an event where people gather and where there is potential for a delay response to emergencies or medical care [2]. To date the science of mass gatherings has focused on the environ- mental and biomedical domains with limited knowledge to support understanding of the psychosocial domain. The psychosocial domain captures the psychological and social influences within mass gatherings mass gatherings and includes both individual and audience behaviour and motivation [1].
In the past there has been recognition that the nature of the audience will impact directly on its health and safety, however the majority of published research focuses on
*This project was funded by a Flinders University Health Science
audience behaviour in a negative context such as vio- lence or conflict [3,4]. Additionally there is no agreement on what audience behaviour, mood and type actually mean. At the same time these elements have a number of applications, including event design and management, emergency planning and mass gathering medicine. These questions are, therefore, worthy of exploration.
An important component of this early model is the po- tential impact that the psychosocial domain may have on the incidence of injury and illness due to features tradi- tionally described as crowd mood and type. This poten- tial arises from the interaction of key features of the event and understanding the audience’s demographic, predispositions and behaviour can lead to the develop- ment of interventions that are likely to reduce risk and enhance the safety of the event. Yet this potential has been little explored until now and there is a dearth of literature describing how the audience’s behaviour, mood, type and motivation impacts on their health and safety at mass gatherings. In addition there is limited evidence of models with practical applications to monitor and meas- ure crowd at mass gatherings [5]. This assertion is sup-ported by Emergency Management Australia (2005) who state that “practical applications to monitor and measure crowd type and mood have received limited attention” (Emergency Management Australia (p. 14) in the past.
Crowd (or audience) behaviour has been defined by [5] as the demonstrable factor that requires assessment and monitoring to underpin management actions at mass gathering events. Zeitz etal. [5] proclaim the term refers
to the gathering of a large number of people; not de- pendent on the reason for the gathering. Whereas “type” is a social descriptor of the sub-culture (society) and “mood” is a psychological descriptor of an audience. Type and mood impact on behaviour. Impacting factors on behaviour also include the nature of the activity, mo- tivation of the crowd, security, weather and the density of the audience (e.g. people per square metre) [2,6].
As audience behaviour is the most visible feature of the psychosocial domain of mass gatherings it is surpris-ing that is has not been measured in a rigorous fashion. In the mid-nineties two models where developed to as-sess crowd mood and crowd type; Berlonghi (USA) [7] and Pines and Maslach (UK). In Australia Berlonghi’s classification of crowd types is now promoted by the EMA (1999) and the work of Pines and Maslach [8] was adapted by Zeitz et al. [5] to analyse the effect crowd
mood may have on emergency services workload at mass gatherings.
In the past few years Brown and Hutton [9,10] have been examining practical strategies to develop accurate models to understand crowd behaviour at mass gather- ings. The outcomes of this research will enable more accurate predictions on the health care needs of people
attending these large public events and support the de- velopment of theory. Part of this strategy is to measure audience behaviour through a wide range of variables (including density, humidity and temperature) and relate these back to the observed health status of individuals. To achieve this a data collection system is being de- signed to capture and compare real-time data on the wide
range of variables of audience behaviour at mass gather- ings that can influence the health of individuals and are measured as patient presentation (PPR) and transport to hospital rates (TTHR).
The maintenance of public order at mass gatherings is often referred to as audience management [11]. The size of the audience and the type of event can impact on the workload of emergency services [12]. Therefore gaining an understanding of audience behaviour is important in supporting timely and appropriate management princi-ples in the planning and provision of emergency services at mass gathering. There is a large theory to practice gap in relation to crowd/audience psychology within the mass gathering setting [3].
The purpose of the research is to develop an evidence base to support theoretical and conceptual models to pro-vide a better understanding of the interaction between key characteristics of individual behaviour and the health effects of mass gatherings. This data will contribute to more accurate predictive models for patient presentation rate (PPR) and transport to hospital rate (TTHR) for mass-gatherings.
The purpose of the MaGDAA project is to automate the collection of as much of the environment data as pos- sible, while at the same time supporting the collection of empirical data using surveys that are accessed using tab- let based computers. Additionally a Wi-Fi mesh network is used to support the distribution of data to each device in the network to reduce the risk of data loss and support easier data management activities.
2.2. MaGDAA System Architecture
The core of the MaGDAA system architecture is a Wi-Fi mesh network. A mesh network within the context of the MaGDAA project is a Wi-Fi network that supports peer- to-peer communication and where the network can be created, used and maintained independently of the pres- ence of any traditional wireless network infrastructure. The formation and management of the Wi-Fi mesh net- work is undertaken by the open source Serval Mesh software developed by the Serval Project.
2.2.1. The Serval Project
identify and launch survey forms. connected to all other devices in its proximity. By trav-
ersing the links between devices, communication can occur between devices that normally would be outside of each other’s range. Android was chosen as the initial development target as it is an open source platform and as such more readily supports the development of soft- ware such as the Serval Mesh software. Other more closed platforms, such as iOS and Windows Phone, have re- strictions prohibit the development of software that needs to integrate with the underlying phone hardware such as the Serval Mesh software.
The collection of data via the survey form is conducted using the ODK Collect application, one of a suite of tools that if it relied on the effective distance of a Wi-Fi net- work alone. Future development plans for the Serval Project include the possibility of integrating with custom hardware to support the use of sub 1GHz, which while lower in bandwidth supports longer distances. Addition-ally there are plans to support integration with other net- work topologies such as satellite to broaden the range of a mesh network even further.
The primary functionality provided by the Serval Mesh software is voice calls using mobile phones. There is also the additional functionality of messaging and file sharing using the Serval Rhizome data transfer service. The Rhi- zome data transfer service is an extension of the tech- nology created to support Serval MeshMS services [13], and is a form of store and forward networking. Data that is stored on one device in the mesh network is automati- cally shared with other devices on the network. This en- sures a high probability that information from one device is copied to all other devices in the mesh network over time.
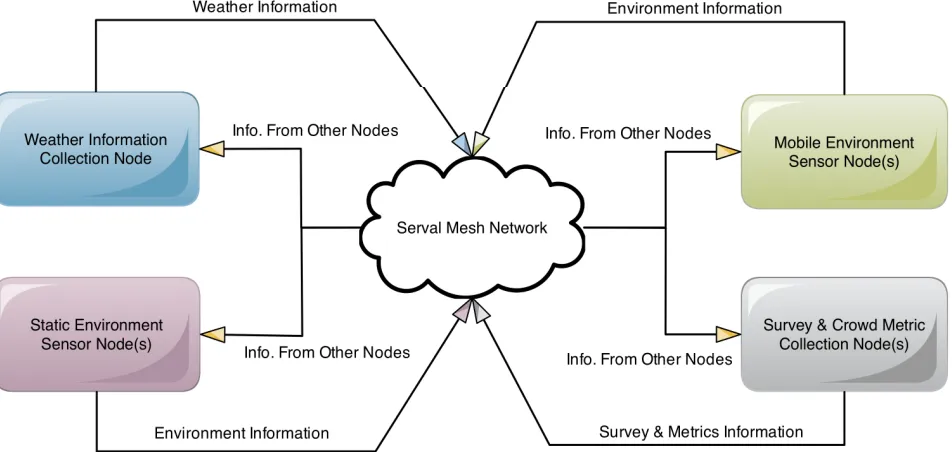
The use of the Serval Mesh software provides two main advantages. The first advantage is the ability to form a network for sharing data between devices on the network without the need for any additional infrastruc-ture. The second advantage is that the data collected by the sensors, and other devices such as tablets used in un- dertaking surveys, is distributed onto all of the devices on the network. The data sharing capabilities of the Rhi- zome data service mitigates the risk of data loss through the loss of any one device. Any single device on the network has copies of the data that it has collected as well as data from other devices. Currently there are four different types of devices envisaged for the MaGDAA system. They are outlined in the following sections, addi- tionally an overview of the system architecture is pro- vided in Figure 1.
Importantly this type of approach also supports tran- sient network devices, such as devices that come into, and then out of, network range of other devices. Data can be propagated from one section of the network to another simply by the act of a researcher moving through the site of the mass gathering event with a mobile device running the Serval Mesh software in their pocket. The network can then cover a greater area than audience such as au- dience behaviour. MaGDAA SAM is designed to provide an easy to use interface that allows researchers to quickly
2.2.2. Survey & Crowd Metric Collection Nodes
[image:3.595.63.539.493.719.2]During the course of a mass gathering event a researcher is engaged in the acquisition of audience metrics and other information through the use of surveys. The re- searcher uses the MaGDAA Survey Acquisition Man-
agement (SAM) software to launch the appropriate sur- vey. For example a survey that collects demographic information from participants at the event, or various metrics related to the audience such as audience behav- iour. MaGDAA SAM is designed to provide an easy to use interface that allows researchers to quickly identify and launch survey forms.
The collection of data via the survey form is conducted using the ODK Collect application, one of a suite of tools that are part of the Open Data Kit (ODK). The ODK suite of tools has been shown to be effective in collecting data in the field using mobile devices [14], especially in the collection of medical and health information [15].
Using the ODK Collect application it is possible to construct survey forms that collect textual information, including free text fields and single and multiple option selection lists, as well as rich media such as images, video and sound. Additionally geographic location in- formation can also be collected as part of completing a survey using the GPS capabilities of the device. The use of the ODK Collect application provides researchers with a wide variety of options for data collection.
There are three key factors, which have made the ODK suite of applications an attractive choice for the MaGDAA project. First, is that the ODK suite of tools is released as open source software and that in particular the ODK Collect application is designed for devices us- ing the Android operating system. Second, is that there are other applications in the ODK suite which can be used for data aggregation as well as survey construction. Lastly, is that the ODK suite of applications uses of the open standard XForms [16]. XForms is an XML based standard for the definition of survey forms and their re-sults in a platform independent manner. Once a survey is finalised by the ODK Collect application the MaGDAA SAM application bundles up the survey data, and any associated rich media, into a single compressed archive and shares this with the other devices on the network using the Rhizome data transfer service.
By using open source software, open hardware and open standards it has been easier to quickly develop the prototype hardware and software that has been required to achieve the initial goals of the MaGDAA project and is one of the key success factors for the project.
2.2.3. Weather Information Collection Node
A prototype weather information collection node is an Android powered mobile phone connected to a custom hardware module based on the open hardware IOIO de-velopment board. The hardware module acts as a bridge between the mobile phone and the console of a Vantage Vue weather station from Davis Instruments. Communi- cation between the hardware module and the console is achieved using the serial communications protocol. The
hardware module communicates with open source soft-ware developed by the MaGDAA project known as Wea- ther Information Straight to Network (WInSTON).
It is envisaged that the WInSTON software will poll for new weather information periodically and distribute the collected information using the Rhizome data transfer service. The weather information collected by the Win- STON software can used by the researchers to gain an indication of the overall weather conditions at the site of a mass gathering event.
2.2.4. Static Environment Sensor Nodes
Environmental data is collected at a single location over the course of the mass gathering event using a prototype static environment sensor device. Connected to a mobile phone running the Android operating system is a sensor module constructed using an IOIO development board. The two sensors currently connected to the module are a TMP36 temperature sensor and a HIH-5031 humidity sensor. The open source MaGDAA Mobile Environment Monitoring (MEM) software interfaces with the sensor module and periodically polls for new sensor readings. This data is then shared with the other devices on the network using the Rhizome data transfer service.
Importantly the IOIO development board has support for the connection of additional sensor components. One such sensor is a light sensor, which provides readings in lux and would provide an indication of the amount of light in an area. Another additional sensor is a carbon dioxide sensor, which when combined with the readings from the temperature and humidity sensor could provide an indication indoor air quality.
The environmental information collected by the MEM software provides researchers with information about the environmental conditions in a specific area, for example inside a marque.
2.2.5. Mobile Environment Sensor Nodes
The environment information collected by the MEM software when used with the mobile sensor modules pro- vides researchers with environmental information wher-ever they go on the site of a mass gathering event.
2.2.6. Distributed Data Management
As mentioned previously the use of the Rhizome data transfer service ensures that the data collected on one device on the network is automatically shared with other devices on the network. In this way there is no single point of failure that will result in data loss. For example if a sensor node fails, or is stolen, the data that it has col- lected up to that point is likely to have been copied to at least one other device on the mesh network.
Additionally at the end of the mass gathering event each device on the network when brought back to the researchers base of operations will automatically share any remaining data with the other devices on the network. In this way the researchers primary computing device, such as a laptop, will have all of the data copied to it and available for copying onto the researchers’ computers in their office to start the analysis process.
2.3. Open Source Software
Open Source Software is software created under licens- ing that requires the additional distribution of the source code. While a creator (or group of creators) may wish to charge for their software version, they must provide the source code. Others are allowed to utilise the source code to provide additional or altered functionality. This right to the code is at the inner most core of the definition of Open Source software. However, the Open Source Initia- tive says that there is more to Open Source than just “ac-cess to the source code” [17]. Under terms of distribution, to be defined as Open Source, software must meet addi-tional criteria including the following.
The licensed software must be distributed freely and the source code must be included with the software, or provision for the easy access to the source code be made. The licensing must allow for derived worked and modi- fications, with the proviso that they must be distributed under the same terms as the originally licensed software. However, to maintain integrity with the originating au- thor, this original license may in fact restrict modified forms being available unless they indicate incremented version numbering, or different naming to indicate the changes.
No additional licensing should be required to use or work with the software in any form, and the license must not be restrictive in the specificity of the product—the software must not, for example, be tied to a particular device, or particular version or distribution of software, and the licensing must not inhibit or restrict the
function-ality of other software. Discrimination of any person or group of people is unacceptable under Open Source soft- ware provisions, as is discrimination based on a particu- lar endeavour, with examples often used including a type of business or research.
It is the belief in these principles, which has encour-aged the release of the software developed by the Ma- GDAA project as open source via a freely available and accessible source code repository
(https://github.com/magdaaproject). Additionally the open source like nature of the Android operating system has contributed to the ability of the Serval Project to access the low level hardware necessary to construct a mesh network and has also contributed to the overall success of the Android operating system [18].
2.4. Open Hardware
Open Hardware, also known as Open Source Hardware, is similar in nature to Open Source Software. The Open Source Hardware Initiative in fact utilises [19] the defini-tions and restricdefini-tions from the Open Source Software Initiative to maintain a “co-existence” [20], which should enable the clear intention and definition to proliferate.
Whereas Open Source Software is obviously where the code is the product upon which all rules are targeted, Open Hardware is hardware where the design is the product, that again has the option to be freely duplicated or modified, albeit with similar restrictions to the ones listed previously. In addition to the design or idea being the product, it is envisaged that: “Ideally, open source hardware uses readily-available components and materi- als, standard processes, open infrastructure, unrestricted content, and open-source design tools to maximize the ability of individuals to make and use hardware” [19].
The IOIO development board, which is the core of all of the sensor boards, is an example of open hardware. All of the schematics and software required to use, and op-tionally construct your own IOIO board is available via the projects main website (http://github.com/ytai/ioio).
It is the belief in these principles, as applied to open hardware as well as open software, which has resulted in the MaGDAA project making all of the documentation, including schematics for the prototype sensor nodes, available on the MaGDAA project wiki
(http://wiki.magdaaproject.org/). Using open source hard- ware has made it possible for the MaGDAA project to rapidly develop the environment sensors starting with a bare development board and moving through to the fi- nalised prototype sensors.
3. Method
2013. The first, the 2013 Adelaide Festival, is an arts and cultural festival that is held annually and is staged over two weeks and three weekends in a range of indoor and outdoor venues. The second, an outdoor (predominantly world music) festival, Womadelaide, is a 4-day festival, staged in Botanic Park on the edge of the central business district.
The Adelaide Festival trial involved the use of the tablets and the Wi-Fi mesh network, the use of Android powered tablets with the ODK suite of application. Demographic and cultural value related data was suc- cessfully collected and safely stored over the network with automatic data entry. The Womadelaide trial also involved the use of: environmental data (including tem- perature, humidity, audience density and sound pressure levels); observational data (audience mood and behav-iour); and the demographic and cultural value data first trialled at the Adelaide Festival. Again the data was suc- cessfully captured and entered and securely stored over the network.
For each trial a post-doctoral fellow (under the super-vision of two academic staff both on campus and onsite in the field) managed the project, briefing up to 12 sur- veyors on the use of the Android tablets and software. The tablets were trialled by the surveyors on campus prior to deployment in the field at the events and ethics approval was sought and gained from the university.
Surveyors were re-briefed onsite at the events about the particular circumstances of the venue and the audi- ence in attendance along with any restrictions imposed by the event organisers. A “refresher” briefing about the use of the tablets and software was given before survey- ing commenced. Supervision staff observed the survey- ors to ensure random data collection form audience members and that surveyors remained within parameters set for observational data collection.
Data was collected on each of the tablets and then transferred via Wi-Fi to a “master” computer on site.
Backup batteries were used and on charge so tablets were always deployed with full power at all times.
4. Results
The MaGDAA project is in its infancy; the proposed system presented here in this paper is the result of a three-month development sprint. The use of open source software and open hardware has been critical to achiev- ing the goals of the project. The ability to develop soft- ware that can run on both Android powered smartphone and tablet devices; with a minimum of hardware specific customisation continues to be attractive.
The use of Open Source Software has been critical to the success of the project. By using open platforms, sys-tems and specifications it has been possible to achieve
the goals of the project in a shorter time frame. Addition- ally by using open data specifications such as XForms it is anticipated that using platforms other than Android will be significantly easier. As the survey form specifica- tions can be written once for all platforms.
Similarly the use of Open Hardware has had a signifi- cant impact on the project. The open platforms such as the IOIO and IOIO Mint have made prototyping sensors easier and the IOIO development community has pro- vided significant assistance.
The use of a mesh Wi-Fi network has been found to be effective in constructing a sensor network without the need for external infrastructure. Additionally be using the Rhizome data sharing service the data collected during a mass gathering event can be distributed to as many net- work device as possible which improves data resiliency and security. As the Serval Mesh software matures it is possible to extend the capabilities of the MaGDAA sen- sor network using other network topologies such as satel- lite, or sub 1GHz network links. Additionally the use of SMS as a command and control channel can also be ex- plored to support functionality such as retrieving the current sensor values by a researcher who is outside the range of the mesh network.
5. Limitations
The increased fragmentation of the Android ecosystem [21] is making development on the platform for a small team increasingly difficult. Additionally Google’s low level of support for Ad-Hoc Wi-Fi, as evidenced by the long-standing bug number 82 in the Android issue sys- tem
(http://code.google.com/p/android/issues/detail?id=82), slows the continued development of mesh networking on the Android platform.
6. Discussion
The aim of the MaGDAA project is the development of a sensor network that can support research that is seeking a better understanding of the interaction between key char- acteristics of audience behaviour and consequent health effects in the mass gatherings setting. MaGDAA achieves this by: 1) automating the collection of a range of data; 2) increasing the effectiveness of the collection survey and audience metrics through the use of ODK Collection; 3) implementing an infrastructure independent mesh net- work for transferring sensor data and support distributed data management.
system compared to more traditional data collection meth-ods.
The combination of a Wi-Fi mesh network, the use of Android powered mobile phones and tablets and the pro- totype environment sensors with the ODK suite of appli- cation, therefore makes the MaGDAA project a unique sensor network for the collection of an extensive range of data in real time at mass gathering events.
REFERENCES
[1] P. Arbon, “The Development of Conceptual Models for Mass-Gathering Health,” PrehospitalandDisasterMedi- cine, Vol. 19, No. 3, 2004, pp. 208-212.
[2] P. Arbon, “Mass-Gathering Medicine: A Review of the Evidence and Future Directions for Research,” Prehospi- talandDisasterMedicine, Vol. 22, No. 2, 2007, pp. 131- 135.
[3] K. M. Zeitz, H. M. Tan, M. Grief, P. Couns and C. J. Zeitz, “Crowd Behavior at Mass Gatherings: A Literature Review,” PrehospitalandDisasterMedicine, Vol. 24, No. 1, 2009, pp. 32-38.
[4] A. Hutton, K. Zeitz, S. Brown and P. Arbon, “Assessing the Psychosocial Elements of Crowds at Mass Gather- ings,” PrehospitalandDisasterMedicine, Vol. 26, No. 6, 2012, pp. 414-421. doi:10.1017/S1049023X12000155 [5] K. Zeitz, S. Bolton, R. Dippy, Y. Dowling, L. Francis, J.
Thorne, T. Butler, and C. Zeitz, “Measuring Emergency Services Workloads at Mass Gathering Events,” TheAus- tralianJournalofEmergencyManagement, Vol. 22, No. 3, 2007, pp. 23-30.
[6] A. M. Milsten, B. J. Maguire, R. A. Bissell and K. G. Seaman, “Mass-Gathering Medical Care: A Review of the Literature,” PrehospitalandDisasterMedicine, Vol. 17, No. 3, 2002, pp. 151-162.
[7] A. E. Berlonghi, “Understanding and Planning for Dif- ferent Spectator Crowds,” SafetyScience, Vol. 18, No. 4, 1995, pp. 239-247. doi:10.1016/0925-7535(94)00033-Y [8] A. Pines and C. Maslach, “Experiencing Social Psychol-
ogy: Readings and Projects,” McGraw-Hill, New York, 1993.
[9] S. Brown and A. Hutton, “Developments in the Real- Time Evaluation of Audience Behaviour at Planned Events,” InternationalJournalofEventandFestivalMa- nagement. SpecialIssueonEventsandfestivalsResearch MethodsandTrends,
http://www.emeraldinsight.com/1758-2954.htm [10] A. Hutton, S. Brown and N. Verdonk, “Exploring Culture:
Audience Predispositions and Consequent Effects on Au- dience Behaviour in a Mass Gathering Setting,” Prehos- pitalandDisasterMedicine.
http://journals.cambridge.org/download.php?file=%2FPD M%2FS1049023X13000228a.pdf&code=76e8517307c9b e50a8274c4fdfabca59
[11] K. Zeitz, S. Bolton, R. Dippy, Y. Dowling, L. Francis, J. Thorne, T. Butler and C. Zeitz, “Emergency Management Australia Projects Program, Measuring Emergency Ser- vices Workloads at Mass Gathering Events,” Australian Government Attorney General’s Department, Emergency Management Australia, Canberra, 2005.
[12] C. Earl, M. Stonehame and M. Capra, “Volunteers in Public Health and Emergency Management at Outdoor Music Festivals,” The Australian JournalofEmergency Management, Vol. 18, No. 4, 2003, pp. 18-24.
[13] P. Gardner-Stephen, J. Lakeman, R. Challans, C. Wallis, A. Stulman and Y. Haddad, “MeshMS: Ad Hoc Data Transfer within Mesh Network,” InternationalJournalof Communications, NetworkandSystem Sciences, Vol. 5, No. 8, 2012, pp. 496-504. doi:10.4236/ijcns.2012.58060 [14] Y. Anokwa, C. Hartung, W. Brunette, G. Borriello and A.
Lerer, “Open Source Data Collection in the Developing World,” Computer, Vol. 42, No. 10, 2009, pp. 97-99. doi:10.1109/MC.2009.328
[15] Z. A. Rajput, S. Mbugua, D. Amadi, V. Chepnǵeno, J. J. Saleem, Y. Anokwa, C. Hartung, G. Borriello, B. W. Mamlin, S. K. Ndege and M. C. Were, “Evaluation of an Android-Based mHealth System for Population Surveil- lance in Developing Countries,” Journal of the American Medical Informatics Association, Vol. 19, No. 4, 2012, pp. 655-659. doi:10.1136/amiajnl-2011-000476
[16] J. M. Boyer, “XForms 1.1,” W3C, 20 October 2009. http://www.w3.org/TR/xforms/
[17] “The Open Source Definition,” Open Source Initiative, 2012. http://opensource.org/osd
[18] A. Oreskovic, “Google’s Android Software in 3 out of 4 Smartphones,” Reuters, San Francisco, 2 November 2012. http://www.reuters.com/article/2012/11/02/us-android-sh are-idUSBRE8A11A820121102
[19] “Definition,” OpenSourceHardwareAssociation, 2012. http://www.oshwa.org/definition/
[20] W. Oskay, “OSHWA and OSI Enter Co-Existence Agree- ment,” Open Source Hardware Association, 17 October 2012. http://www.oshwa.org/2012/10/17/co-existence/. [21] D. Han, C. Zhang, X. Fan, A. Hindle, K. Wong and E.