Comparative Study of Reliability Prediction of
Compressor System by ANN and TTF Time Series
Techniques
P. A. Ozor, C. Mbohwa
ABSTRACT: A comparative study of reliability prediction of Compressor system by means of Artificial Neural Network (ANN) and Time to failure (TTF) analysis is presented. The data for the study was taken from a specific example namely; CO2 compressor at the Utilities Department of a beverage plant, preferred to be addressed as X plant for the sake of confidentiality. The trained neural network predicted the reliability of the compressor very well, given the very low values of mean square error ( ) and high value of the
regression (0.998742). The result was compared to what obtained in reliability prediction by time-to-failure time series. The later equally gave a considerably high value for the coefficient of determination of the linear regression line between the predicted values and the actual values (0.9824). Yet artificial neural network result gave a better value. The result shows that use of artificial neural network is a good means of predicting reliability of deteriorating systems.
Keywords: Reliability prediction, deteriorating systems, artificial neural network, time to failure analysis
I INTRODUCTION
The question of how reliability of deteriorating systems should be ascertained is very important in planning for continued sustenance of optimally designed and proficiently installed Industrial systems. Careful maintenance organization is very necessary especially as a lot of capital is invested on the chains of today’s complex systems. Therefore, any category of system, unit or component must run at or above its planned profitable production or service rate in other to provide adequate returns on the resources invested in it, thereby allowing for further investment [1]. Researchers have shown that analytical models are good means of efficient maintenance planning and developed such models for various maintenance types [2, 3 - 5].
Manuscript received March 23, 2018; revised April 10, 2018.
P. A. Ozor is with the Quality and Operations Management Department of University of Johannesburg, Johannesburg, South Africa (Corresponding author: +27 623 329 377; e-mail: [email protected]).
C. Mbohwa is with the Quality and Operations Management Department of University of Johannesburg, Johannesburg, South Africa (e-mail: [email protected]).
It is still argued that such models, as it were, are most often over simplified, and do not represent the actual system behavior [6]. Multiple considerations [3] and trade-offs that are involved in formulation of an optimal system maintenance approach to ensure industrial compatibility and applicability [7], underscores the need for comparative studies of existing maintenance approaches. In particular, evaluating different techniques employed in elucidating sustainable maintenance characteristics can be useful, since it is very common for system maintenance problems to exhibit multi-parametric character, multiple competing objectives and multiple prospective solutions. As maintenance options increases in complexity, evolutionary algorithms can be explored as an alternative to traditional analytical methods. To demonstrate this, some system maintenance parameters can be investigated by various means to enable selection of the most accurate decision criterion. Reliability is a very important system characteristic that must be ensured for achieving system goals. Most systems begin to deteriorate after installation and commissioning due to age and usage. Though in some cases, systems can fail due to causes that are not known. A valid practice can be achieved by determining the best planning and control strategy that will enable the prediction of reliability of specific systems. This will permit maintenance interventions to be carried out between the point of failure initiation event and acceptable loss of performance in order to avert catastrophic failure, with its attendant huge losses. An evolutionary algorithm based methodology, specifically; Artificial Neural network (ANN) and a traditional empirical approach is used in turn, in this paper to predict system reliability. The two approaches used in evaluating the reliability of an example repairable system with a view to assessing the performance of each. It is expected that the result would guide maintenance practitioners on the course of action when reliability prediction involving the two alternatives is under consideration.
II MATERIALS AND METHODS
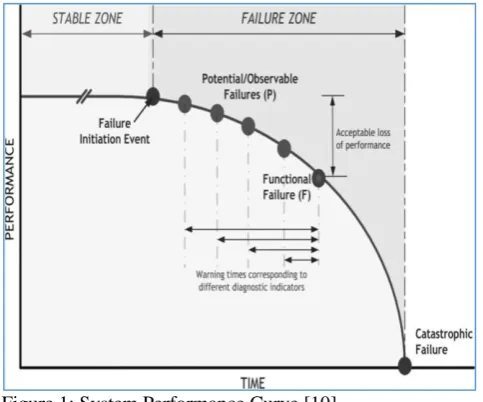
Figure 1: System Performance Curve [10]
Industry management. The essence of the factory visits was to obtain primary information on the system to be studied. The case study system was decided based on data availability. For example, there was good evidence that all the data needed for the research can be sourced from archival records of the company and interviews with the maintenance and production personnel. Secondary data for the study include the ones obtained from company publications and other literature sources. Therefore, the overall data used in the work was obtained from a compressor operated at a beverage plant, otherwise called X-Company in this presentation. The basic assumption that the whole data as collected from the case study system (CO2 compressor at the Utilities Department of
X- plant) were completely and accurately correct has to be made since there were no available method of validating the accuracy. Care was exercised to ensure that the members of staff that were interviewed has acquired good experience on the operation, failure and maintenance of the studied system. To achieve this, only those workers who had worked for upwards of fifteen years were selected for interview. During the analysis, the data was filtered to identify outliers. This step was taken because preliminary analysis of the data as collected did not give good results due to the existence of data points that are uncharacteristically out of range with the majority. The data were rank ordered to allow for empirical determination of the reliability, directly from the data set by means of non-parametric techniques. The result obtained through the approach was carefully noted and recorded. To apply ANN techniques, the data were normalized and partitioned for use in training, validating and testing the ANN which was also used to predict system reliability. The ANN architecture was decided on the basis of trial and error method until the one that yielded best results based on the performance characteristics was attained. The results obtained from the two procedures were compared on the basis of some statistical performance indices.
III ANALYSIS
Ebeling [8] provides empirical equation (1), which is applicable in estimating corresponding reliability values of deteriorating systems. Past researchers [1] present interesting system performance curve that shows the stable performance zone and segments of a deteriorating system trajectory. Figure I shows the performance curve. The essence of the reliability prediction is to ensure that the system remains in the stable zone as far as possible. Maintenance or system restoration interventions must be carried out while the remaining useful life which represents the zone of acceptable loss of performance is not exceeded. The maintenance approach that can keep a system in the stable zone is discussed elsewhere [9].The reliability of the compressor system was first computed by analyzing the historical repair-time-to-failure data using empirical methods. The results are displayed in figure 2 through figure 3.
[image:2.595.304.554.306.474.2]
(1)
Fig 2: Predicting TTF time series: Non-linear relationship
Fig 3: Predicting reliability time series: Purely linear relationship
ARTIFICIAL NEURAL NETWORK DATA PREPARATION
The data presented to ANNs for training are usually transformed into the form amenable to the selected software. Great care is normally exercised in doing this as it is the foundation upon which neural networks are built.
y = 12.726x - 13.203 R² = 0.9824
-200 0 200 400 600 800
0 20 40 60
TTF
Failure Order
Series1
[image:2.595.306.569.511.672.2]preprocessing and post processing steps. Pre-processing steps comprises the activities performed before feeding a set of raw data to the network to improve the efficiency of the training [9]. One importance of this is that it provides significant assistance in analyzing the response of the trained network. All the data are not expected to be used in training. The usual practice is to divide it into three subsets. That is; one for training and the remaining two for validation and testing of the trained network respectively. The data used for training remains in its transformed state throughout the process. Therefore, in other to make the output readable in the form of the original data, prior to preprocessing, a post processing step might equally be necessary for better appreciation of the result. Equation (2) can be relied upon when transforming the original data, in which case, a value (p) of the data having the minimum value (p min) and maximum value (p max) can be converted into a normalized value ( )[9]. When the transformation is performed for all the data points, the efficiency of the normalization can be tested by ensuring that the data lie between -1 and +1.
(2)
Some of the normalization steps are integrated into the artificial neural network software tools such that the processes are provided automatically, upon creation of a network. In such cases, network incoming data follow laid down preprocessing algorithm which are part of the network object.
TRAINING THE NEURAL NETWORK
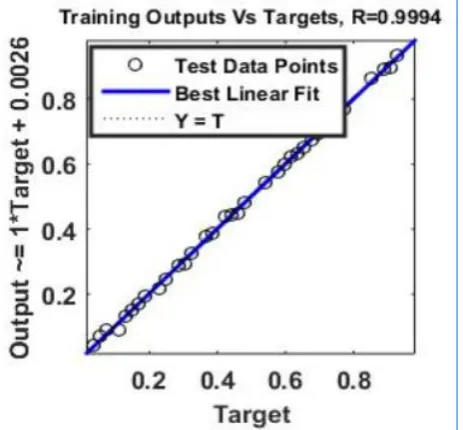
The neural network tool box in MATLAB Software was employed in carrying out the ANN training and validation exercise. The data of Table 1 was normalized using equation (2). Thereafter the data was divided into three parts. Seventy percent of the data was used for training the network while the remaining thirty percent were used for validation and testing (that is; 15% for each). Training automatically stops when generalization stops improving, as indicated by an increase in the mean square error of the validation samples. The best result was recorded with the network architecture (multilayer feed-forward Back Propagation network) shown in figure 4. That is; when the network had one input layer, twenty hidden layers and one output layer. The mean square error during training, validation and testing were ,
3 and respectively. The R
values at these points were 0.9994, 0.9997 and 0.9998 for training, validation and testing respectively.
Other configurations were tried but did not give any better result. The training algorithm, namely; Levenberg-Marquardt algorithm (TrainLM in MATLAB jagon) and the transfer function, namely hyperbolic tangent function (Tansig) for neurons in the input and hidden layers led to quicker convergence and were adopted.
[image:3.595.304.545.147.521.2]figure 5 while figure 6, figure 7 and figure 8 present the regression plots for the ANN training, validation and testing respectively.
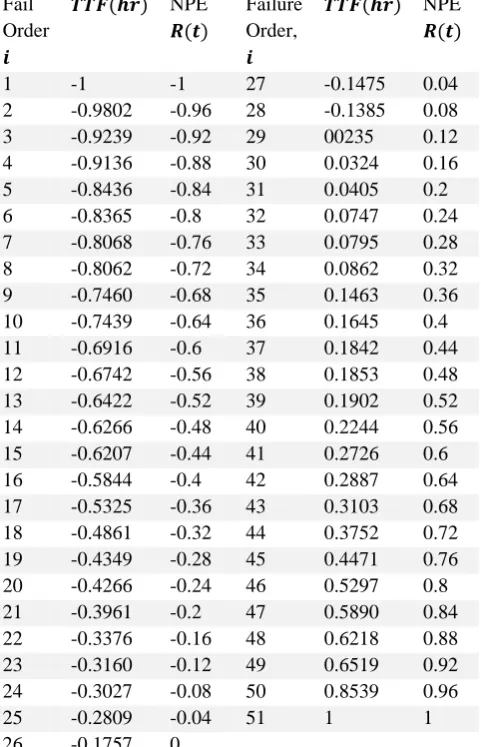
Table 1: TTF and Reliability Data Normalization for the CO2 Compressor
Fail Order
NPE
Failure Order,
NPE
1 -1 -1 27 -0.1475 0.04
2 -0.9802 -0.96 28 -0.1385 0.08 3 -0.9239 -0.92 29 00235 0.12 4 -0.9136 -0.88 30 0.0324 0.16 5 -0.8436 -0.84 31 0.0405 0.2 6 -0.8365 -0.8 32 0.0747 0.24 7 -0.8068 -0.76 33 0.0795 0.28 8 -0.8062 -0.72 34 0.0862 0.32 9 -0.7460 -0.68 35 0.1463 0.36 10 -0.7439 -0.64 36 0.1645 0.4 11 -0.6916 -0.6 37 0.1842 0.44 12 -0.6742 -0.56 38 0.1853 0.48 13 -0.6422 -0.52 39 0.1902 0.52 14 -0.6266 -0.48 40 0.2244 0.56 15 -0.6207 -0.44 41 0.2726 0.6 16 -0.5844 -0.4 42 0.2887 0.64 17 -0.5325 -0.36 43 0.3103 0.68 18 -0.4861 -0.32 44 0.3752 0.72 19 -0.4349 -0.28 45 0.4471 0.76 20 -0.4266 -0.24 46 0.5297 0.8 21 -0.3961 -0.2 47 0.5890 0.84 22 -0.3376 -0.16 48 0.6218 0.88 23 -0.3160 -0.12 49 0.6519 0.92 24 -0.3027 -0.08 50 0.8539 0.96 25 -0.2809 -0.04 51 1 1 26 -0.1757 0
[image:3.595.304.555.560.733.2]NPE = Non parametric estimate
Fig 4: Neural Network Model (Architecture) for CO2
Fig. 5: Plots of the Training, Validation and Testing
Fig. 6: Regression plots for Training
Fig. 7: Regression plots for Validation
Fig. 8: Regression plots for Testing
IV DISCUSSION
The result obtained with the trained ANN predicts the reliability of the compressor very well, given the very low values of MSE ( ) and high value of the
regression (0.998742). It should also be observed that reliability prediction by TTF time series equally gave a considerably high value for the coefficient of determination of the linear regression line between the predicted values and the actual values (0.9824). Yet ANN model gave a better value. The closeness in the results from the two methods is not unconnected with the size of the data used for the work. Artificial Neural Network models are designed to handle stochastic and complex data analysis problems far beyond the size of example data used in this presentation. When the problem involves few data sets, statistical and probabilistic analysis tools can attempt to rival solutions offered by Artificial intelligence techniques. However, the ANN approach presented in this report still exhibited superior prediction capability over the TTF time series non-parametric analytic approach. This comparison can be done for large amount of data and other artificial intelligence techniques incorporated to fully elicit optimal reliability prediction methodology for deteriorating systems.
V CONCLUSION
This work intended to evaluate the use of Artificial Neural etwork-based methodologies in system reliability estimation in comparison with traditional methods. Artificial neural network was x-rayed and its relationship and applicability to reliability prediction delineated. The two tested methodologies was applied to data set taken from an example repairable system from an X-Company. The results of the analysis were displayed graphically to enhance visual comparison. In addition, use of ANN technique in predicting the reliability of a case study industrial system was illustrated. The two-layer (1, 20 and 1) feed forward back propagation neural network was trained to predict the reliability of a CO2 compressor unit. The predictions of the
[image:4.595.57.280.535.765.2]overall comparison of statistical indices. The result shows that ANNs are good means of system maintenance planning.
ACKNOWLEDGEMENT
The financial assistance of the NRF-DST-TWAS fellowship towards this research is hereby acknowledged. However, opinions expressed and conclusions arrived at are those of the Authors and not necessarily to be attributed to NRF-DST-TWAS
REFERENCES
[1] P.A. Ozor, and S.O. Onyegegbu, “Design of Preventive Maintenance Scheduling Model for Deteriorating Systems”,
NIJOTECH, Vol 30, Issue 3, pp. 90-96, 2011
[2] P. Ritchker and G.J. Wilson, “m-T- Group Maintenance Policies”, Management Science, Vol 36, pp. 632-639, 2011 [3] H.Z. Wang and H. Pham, “Reliability and Optimal
maintenance”, Springer Series in Reliability Engineering,
Springer-Verlag London Limited, 2005
[4] Z. Tian and H. Liao, “Condition Based Maintenance Optimization for Multi-Component Systems using Proportional Hazards Model”, Reliability Engineering and System Safety”,
Vol 96, pp. 581-589, 2011
[5] S. Gasmi, C.E. Love and W. Kahle, “A General Repair, Proportional-Hazards Framework to Model Complex Repairable Systems”, IEEE Trans. on Reliability Vol 52 Issue 1, pp. 26-30, 2003
[6] A. Rohani, H.M. Abbaspour-Fard and S. Abdolahpour, “Prediction of tractor repair and maintenance costs using Artificial Neural Network”, Expert Systems with Applications
Vol. 38, pp. 8999–9007, 2011
[7] P.A. Ozor and S.O. Onyegegbu, “System Reliability Estimation with Improvement Factor Under Imperfect Repair”, In the proceedings of the Nigerian Institute of Industrial Engineers International conference, held at University of Benin, August 9-11, 2012)
[8] C.E. Ebeling, “An Introduction to Reliability and Maintainability Engineering”, New Delhi: Tata McGraw Hill Publishing Company Limited, pp. 122- 124 1997
[9] J.Z. Sikorska, M. Hodkiewicz and L. Ma, “Prognostic Modeling Options for Remaining Useful Life Estimation by Industry”,
Mechanical Systems and Signal Processing, Vol. 25, pp. 1803-1836, 2010